The Periodic Labour Force Survey (PLFS) has revamped its sampling methodology to generate high-frequency labor force indicators. The revamped design focuses on estimating employment and unemployment indicators, expanding coverage to rural areas, and providing quarterly estimates. The Monthly Bulletin presents labor force participation rate, worker population ratio, and unemployment rate data at the all-India level, disaggregated by gender, sector, and age group.
SOURCE PDF LINK :
Click to access PLFS_Monthly_Bulletin_April_2025_final.pdf
Click to view full document content
मासिक बुलेटिन
Monthly Bulletin
आवधिक श्रम बल सर्वेक्षण (पीएलएफएस)
Periodic Labour Force Survey (PLFS)
अप्रैत 2025
APRIL 2025

भारत सरकार
Government of India
सांख्यिकी और कार्यक्रम कार्यान्वयन मंज़ालय
Ministry of Statistics and Programme Implementation
राहीय सांख्यिकी कार्यालय
National Statistics Office
$$
\begin{aligned}
& 15^{\text {TH }}$ मई, 2025 \
& 15^{\text {TH }}$ MAY, 2025
\end{aligned}
$$

मासिक बुलेटिन
Monthly Bulletin
आवधिक श्रम बल सर्वेक्षण (पीगलएफएस)
Periodic Labour Force Survey (PLFS)
अप्रैल 2025
APRIL 2025

भारत सरकार
Government of India
सांख्यिकी और कार्यक्रम कार्यान्वयन मंत्रालय
Ministry of Statistics and Programme Implementation
राष्ट्रीय सांख्यिकी कार्यालय
National Statistics Office
$15^{\text {th }}$ May, 2025
A. INTRODUCTION
Considering the need for generation of high frequency labour force indicators with enhanced coverage the sampling methodology ${ }^{1}$ of Periodic Labour Force Survey (PLFS) has been revamped from January 2025. The revamped PLFS design is envisaged to address the following objectives
- to estimate the key employment and unemployment indicators (viz. Labour Force Participation Rate, Worker Population Ratio and Unemployment Rate) on a monthly basis for rural and urban areas in the Current Weekly Status (CWS ${ }^{2}$ ) at all India level
Changes in PLFS from 2025
- to extend the coverage of the Quarterly results of PLFS to rural areas and thereby producing quarterly estimates covering both rural and urban parts of India in the Current Weekly Status (CWS)
- to estimate important employment and unemployment indicators in both usual status ${ }^{3}(\mathrm{ps}+\mathrm{ss})$ and CWS in both rural and urban areas annually.
B. MONTHLY BULLETIN OF PLFS

The Monthly estimates of Labour Force Participation Rate, Worker Population Ratio and Unemployment Rate at all-India level following Current Weekly Status (CWS) disaggregated by gender, sector and broad age-group is planned to be released in the form of Monthly Bulletins of PLFS.
The present monthly Bulletin for the month of April, 2025 is the first in the series.
C. Labour Force Participation Rate (LFPR)
Labour force refers to the part of the population which supplies or offers to supply labour for pursuing economic activities for the production of goods and services and therefore, includes both ’employed’ and ‘unemployed’ persons.
Labour force according to current weekly status (CWS) is the number of persons either employed or unemployed on an average in a week of 7 days preceding the date of survey

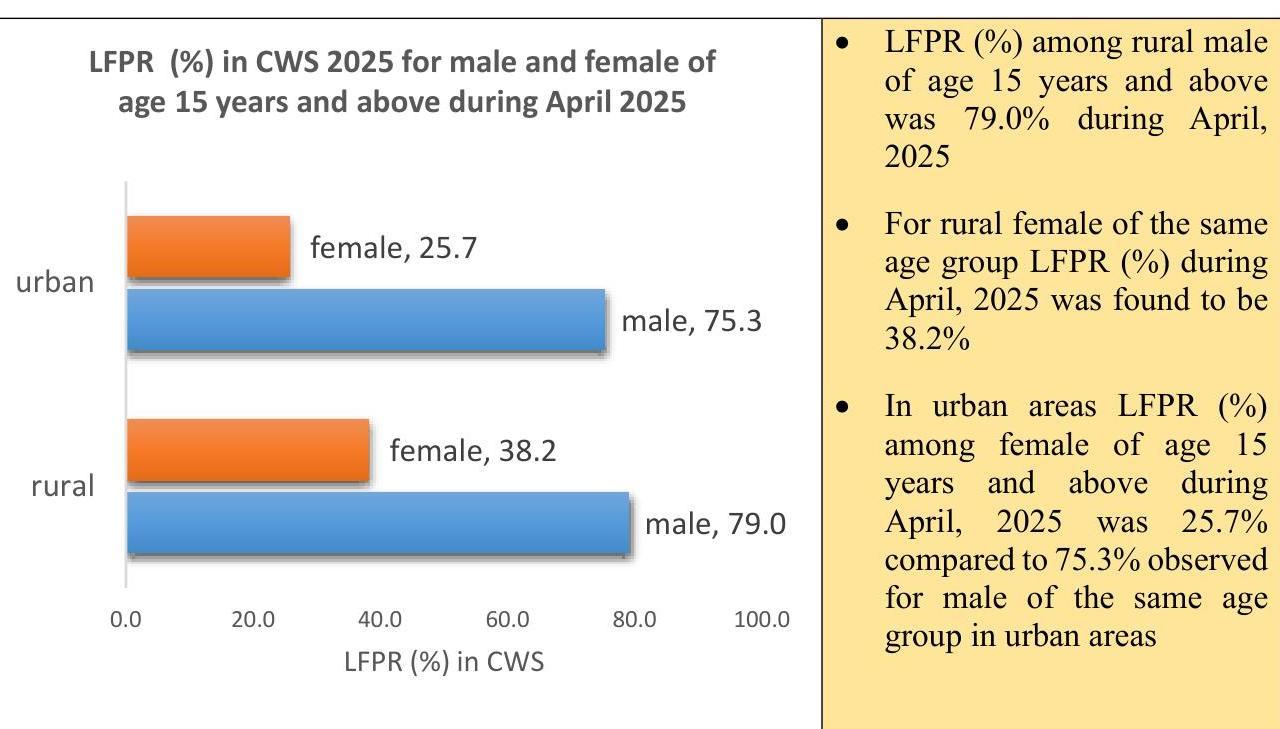
- LFPR (\%) in CWS for persons of age 15 years and above in the country stood at $55.6 \%$ in April 2025.
- LFPR (\%) in CWS for persons of age 15 years and above in rural areas was $58.0 \%$ and in urban areas was $50.7 \%$
LFPR (\%) in CWS among persons of age 15-29 years during April, 2025
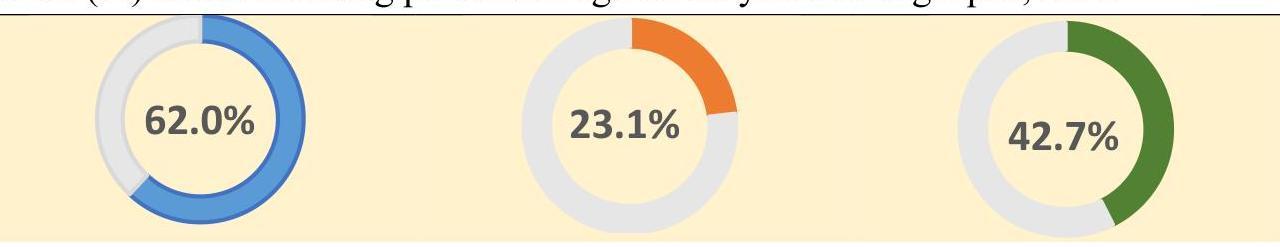
LFPR (\%) among male of age 15-29 years
LFPR (\%) among female of age 15-29 years
LFPR (\%) among persons of age 15-29 years
In Statement 1, estimates of LFPR (\%) in CWS for April, 2025 are presented for different gender, sector and broad age-group categories
| Statement 1: Labour Force Participation Rate (in per cent) in CWS | ||||
|---|---|---|---|---|
| sector | age group | male | female | person |
| rural | 15-29 years | 63.5 | 23.8 | 43.4 |
| 15 years and above | 79.0 | 38.2 | 58.0 | |
| all ages | 57.5 | 28.8 | 42.9 | |
| urban | 15-29 years | 59.1 | 21.5 | 41.2 |
| 15 years and above | 75.3 | 25.7 | 50.7 | |
| all ages | 58.5 | 20.5 | 39.9 | |
| rural + urban | 15-29 years | 62.0 | 23.1 | 42.7 |
| 15 years and above | 77.7 | 34.2 | 55.6 | |
| all ages | 57.8 | 26.2 | 42.0 |
D. Worker Population Ratio (WPR)
WPR
IN
CWS
The workforce measured in CWS gives the average picture of the workforce in a short period of one week during the survey period.
The estimate of workforce in the CWS provides the number of persons who worked for at least 1 hour on any day during the 7 days preceding the date of survey.

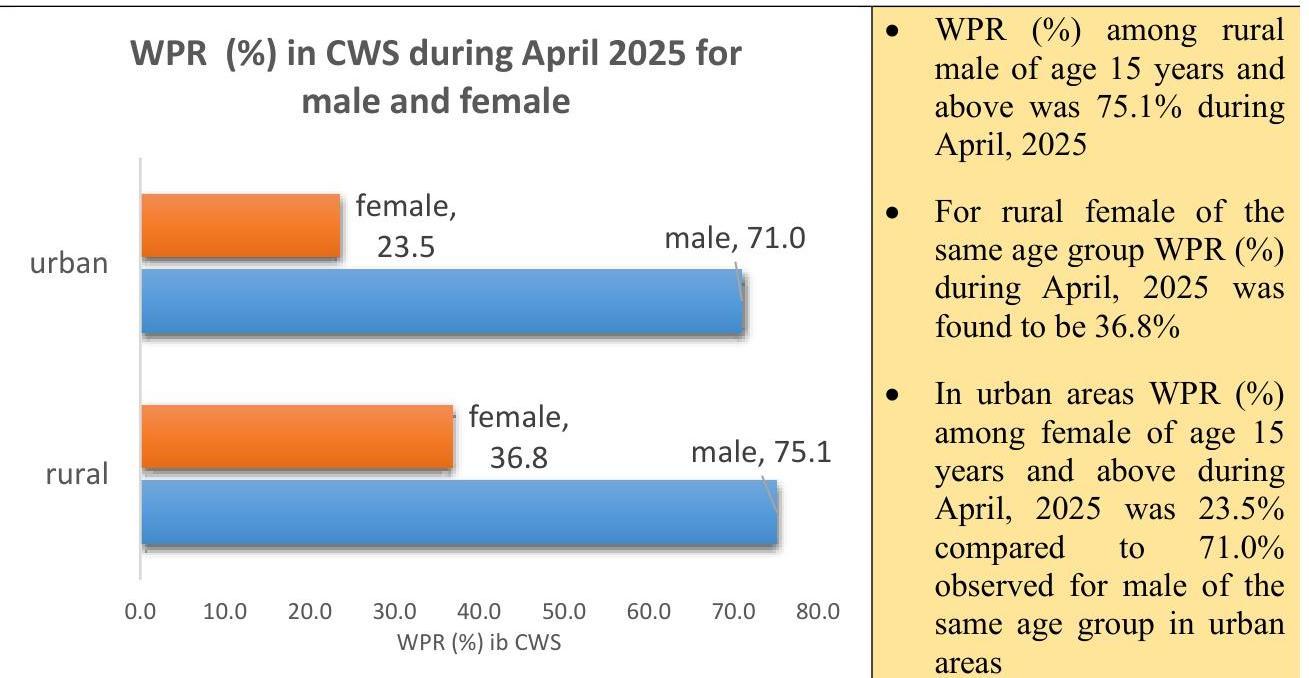
- WPR (\%) in CWS for persons of age 15 years and above in the country stood at $52.8 \%$ in April 2025.
- WPR (\%) in CWS for persons of age 15 years and above in rural areas was $55.4 \%$ and in urban areas was $47.4 \%$.
In Statement 2, estimates of WPR in CWS for April, 2025 are presented for different gender, sector and broad age-group categories
Statement 2: Worker Population Ratio (in per cent) in CWS
| sector | age group | male | female | person |
|---|---|---|---|---|
| rural | 15-29 years | 55.3 | 21.2 | 38.0 |
| 15 years and above | 75.1 | 36.8 | 55.4 | |
| all ages | 54.7 | 27.7 | 41.0 | |
| urban | 15-29 years | 50.2 | 16.4 | 34.1 |
| 15 years and above | 71.0 | 23.5 | 47.4 | |
| all ages | 55.1 | 18.7 | 37.3 | |
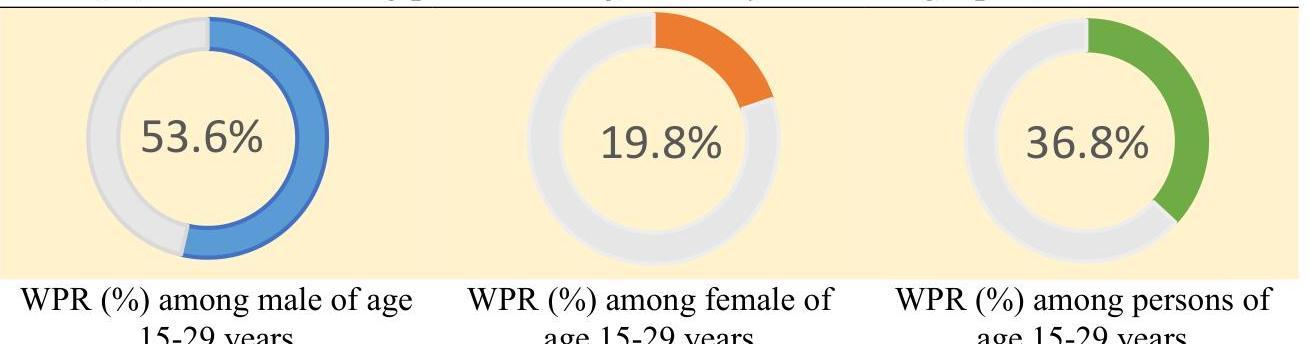
| rural + urban | 15-29 years | 53.6 | 19.8 | 36.8 |
| 15 years and above | 73.7 | 32.5 | 52.8 | |
| all ages | 54.8 | 24.9 | 39.8 |
WPR (\%) in CWS among persons of age 15-29 years during April, 2025
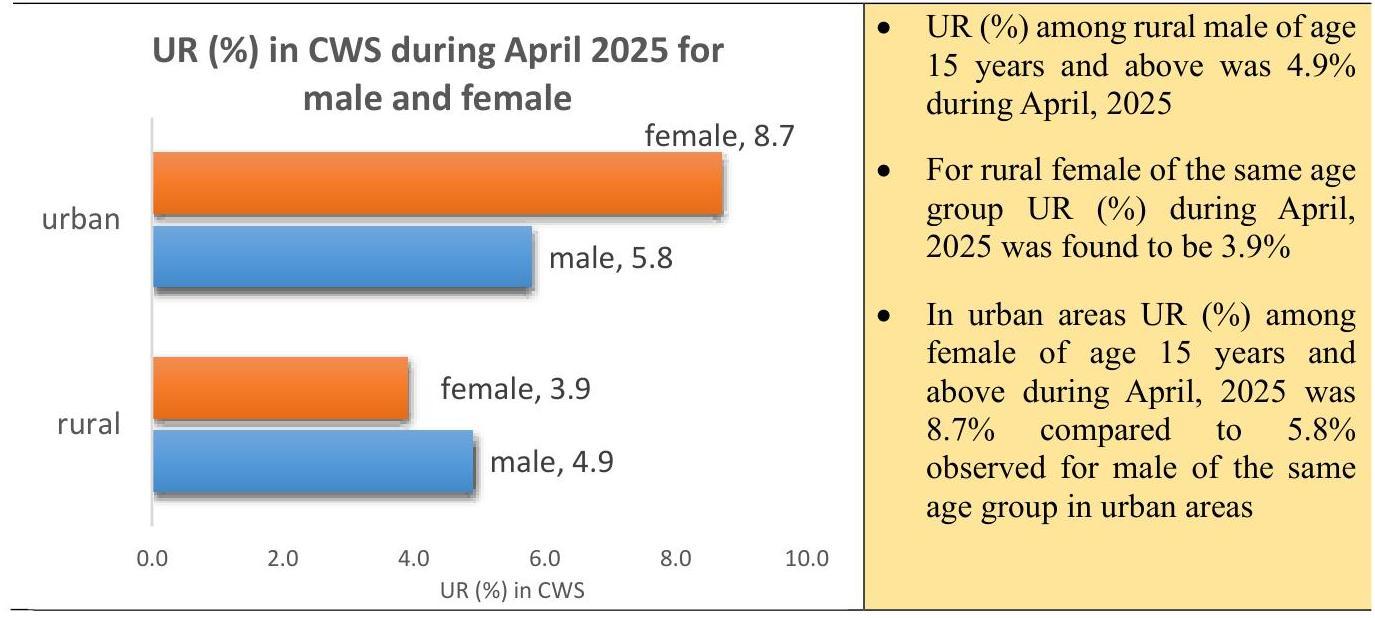
E. Unemployment Rate (UR)

The estimates of unemployed in CWS give an average picture of unemployment in a short period of 7 days during the survey period.
A person was considered as unemployed in a week if he/she did not work even for 1 hour on any day during the reference week but sought or was available for work at least for 1 hour on any day during the reference week

- UR (\%) in CWS for persons of age 15 years and above in the country stood at $5.1 \%$ in April 2025.
- UR (\%) in CWS for persons of age 15 years and above in rural areas was $4.5 \%$ and in urban areas was $6.5 \%$
In Statement 3, estimates of UR in CWS for April, 2025 are presented for different gender, sector and broad age-group categories.
Statement 3: Unemployment Rate (in per cent) in CWS
| sector | age group | male | female | person |
|---|---|---|---|---|
| rural | 15-29 years | 13.0 | 10.7 | 12.3 |
| 15 years and above | 4.9 | 3.9 | 4.5 | |
| all ages | 4.9 | 3.8 | 4.5 |
Statement 3: Unemployment Rate (in per cent) in CWS
| sector | age group | male | female | person |
|---|---|---|---|---|
| urban | 15-29 years | 15.0 | 23.7 | 17.2 |
| 15 years and above | 5.8 | 8.7 | 6.5 | |
| all ages | 5.8 | 8.7 | 6.5 | |
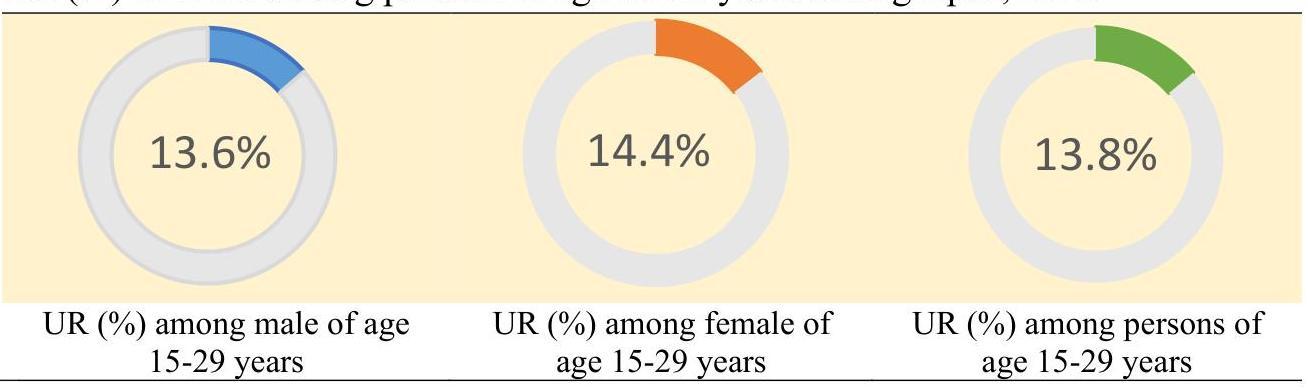
| rural + urban | 15-29 years | 13.6 | 14.4 | 13.8 |
| 15 years and above | 5.2 | 5.0 | 5.1 | |
| all ages | 5.2 | 5.0 | 5.1 |
UR (\%) in CWS among persons of age 15-29 years during April, 2025
F. Sample Size:
In revamped PLFS design adopted from January 2025, a rotational panel sampling design is used and in this rotational panel scheme each selected household is visited four times in four consecutive months -in the beginning with first visit schedule in the first month and other three with the revisit schedule in the following three months for both rural and urban areas.
In the statement given below, the sample size in terms of FSUs (census 2011 villages /Urban Frame Survey blocks/ subunits), households and persons are given, separately for rural areas, urban areas and rural and urban areas combined. It may be noted that, besides the first visit sample ( 25 per cent of total sample size), samples in respect to three revisits ( 75 per cent of total sample size) were also surveyed during the month of April, 2025.
Statement 4: The sample size for monthly estimates of April, 2025
| Sector | Surveyed FSUs | Surveyed Housetolds |
Person surveyed |
|---|---|---|---|
| rural | 4,140 | 49,323 | $2,17,483$ |
| urban | $3,371$ | $40,111$ | $1,63,355$ |
| rural + urban | 7,511 | 89,434 | $3,80,838$ |
G.Reliability of the estimates
Reliability of the estimates of key labour market indicators is measured here by the Relative Standard Error (RSE) of the estimates.
In Statement 5, the RSE (\%) of the estimates of Labour Force Participation Rate (LFPR), Worker Population Ratio (WPR) and Unemployment Rate (UR) in CWS for April, 2025 is presented for persons of age 15 years and above.
| Statement 5: RSE (\%) of LFPR, WPR and UR estimates in CWS for persons aged 15 years and above | ||||
|---|---|---|---|---|
| Indicator | sector | male | female | person |
| LFPR | rural | 0.02 | 0.07 | 0.03 |
| urban | 0.04 | 0.12 | 0.04 | |
| rural + urban | 0.02 | 0.06 | 0.03 | |
| WPR | rural | 0.03 | 0.08 | 0.03 |
| urban | 0.04 | 0.12 | 0.04 | |
| rural + urban | 0.02 | 0.07 | 0.03 | |
| UR | rural | 0.22 | 0.29 | 0.19 |
| urban | 0.30 | 0.44 | 0.26 | |
| rural + urban | 0.18 | 0.26 | 0.16 |
H. Comparability of monthly estimates with previously released estimates of PLFS
The sample design of the Periodic Labour Survey (PLFS) has been revamped from January 2025. As part of revamping of the sample design monthly rotational panel scheme has been implemented for both rural and urban areas wherein each selected household is visited four times in four consecutive months – one with first visit schedule and other three with the revisit schedule in the following three months. The aspects related to the multistage stratified design followed in PLFS like the choice of First stage Units (FSU) to be surveyed, the primary geographical unit (i.e. basic stratum) from which FSUs are selected, stratification rules applied to FSUs and sampling selection method for selecting FSUs have been changed. The number of households to be surveyed within a selected FSU has been increased from 8 to 12 households.
In addition, some changes have also been incorporated in the structure of the Schedule of inquiry. The details of the revamped PLFS sample design and changes made in the Schedule of inquiry have been provided in the PLFS release titled PLFS: Changes in 2025. Users of PLFS results need to consider the changes implemented in PLFS from January 2025 while comparing PLFS results with estimates released through PLFS publications up to December, 2024. The results of the PLFS post January 2025 thus need to be understood and used in the context with which the sample selection methodology of PLFS has been designed.
FEEDBACK FORM
- Name (optional):
- email id (optional) :
- Your field of Work: (please tick $(\checkmark)$ the relevant)
(a) Govt Sector
(b) Corporate Sector
(c) Research
(d) Civil Services
(e) NGO
(f) Education
(g) Art \& Culture
(h) Media
(i) Business
(j) Student - Please mention the report/publication you are commenting on:
CONTENT
- How useful/relevant is the Monthly Bulletin for your professional interests [please tick $(\checkmark)$ the relevant]
(a) very useful
(b) Moderately Useful
(c) not at all useful - How useful/relevant is the Monthly Bulletin for your personal interests [please tick $(\checkmark)$ the relevant]
(a) very useful
(b) Moderately Useful
(c) not at all useful
PRESENTATION
- How do you find style of presentation of information of the Monthly Bulletin? [please tick $(\checkmark)$ the relevant]
(a) Excellent
(b) Very Good
(c) fair
(d) not good at all
ACCESSIBILITY
- How easy was it to access the Monthly Bulletin?
(a) Very easy
(b) Moderately easy
(c) difficult
9. ADDITIONAL COMMENTS
Please note: These comments may be used for internal and external promotional purposes but will not be attributed to the person making them, unless explicitly agreed to this in writing. (please add extra sheet if required)
Dissemination of NSS Results :
The Monthly Bulletin is available in the website of Ministry of Statistics \& Programme Implementation (www.mospi.gov.in)
-
${ }^{1}$ Details of changes in the PLFS Sampling methodology is highlighted in the document PLFS: Changes in 2025, available at the website of the Ministry (https://mospi.gov.in).
${ }^{2}$ The activity status of a person is determined on the basis of the activities pursued by the person during the specified reference period. The activity status determined on the basis of a reference period of last 7 days preceding the date of survey is known as the current weekly status (CWS) of the person.
${ }^{3}$ The activity status determined on the basis of the reference period of last 365 days preceding the date of survey is known as the usual activity status of the person. Activity status in the usual status (ps+ss) are obtained by considering the usual principal status (ps) and the subsidiary status (ss) together. ↩