This document provides a comprehensive overview of key aspects of the Indian economy, including consumer price indices, industrial production, energy statistics, economic census, gender statistics and public grievances. It also sheds light on data dissemination, methodology for GDP estimation, and various types of administrative data and their integration into statistical processes. These insights are essential for policymakers, researchers, and citizens interested in understanding the Indian economy and related data.
SOURCE PDF LINK :
Click to access FAQ_CC19092023.pdf
Click to view full document content
1. Which is the nodal office responsible for dissemination of information published by the Ministry of Statistics and Programme Implementation?
Ans : Computer Centre, an attached office of MoSPI, located at R K Puram, is the nodal office responsible for disseminating various data and reports compiled by different divisions of the Ministry through the website of the Ministry (https://www.mospi.gov.in/).
2. How to access reports and publications brought out by MoSPI?
Ans: Reports/ publications brought out by MoSPI may be accessed at https://www.mospi.gov.in/download-reports OR access it from the following path: https://www.mospi.gov.in/ –> Download Reports (can be seen on landing page of the Website).
3. Whether data and reports compiled by the Ministry of Statistics and Programme Implementation are available free of cost to various users?
Ans: Yes, the data and report pertaining to various surveys conducted by the Ministry is available free of cost to all its users.
4. If there is a manual for microdata download available with the Ministry?
Ans: The user may follow the below mentioned path to access the manual: https://www.mospi.gov.in/ –> Micro Data Catalogue (can be seen at the bottom of the landing page –> Data Dissemination –> Guide to download Microdata. This will open a new window containing the manual for using the data available in Micro Data Catalogue.
5. How to access microdata and aggregated data available on the website?
Ans: https://www.mospi.gov.in/ –>Micro Data Catalogue (can be seen at the bottom of the landing page of the Website. This will lead to the National Data Archive portal.
i. For downloading microdata, if user is already registered, they may enter username/ Password; else click on Register for first time registration. Subsequent to successful registration, you will be able to download microdata.
ii. Aggregated data(CPI, ASI), Statistical Year Book, is available at : https://www.mospi.gov.in/download-tables-data
6. what are the contact details of Computer Centre for data dissemination?
Ans: The centre can be contacted through the following mail id : webunit.diid@mospi.gov.in.
- How to interpret the information available at readme file e.g. R75250L01.TXT
Ans: It can be interpreted as below:
$R$ as Round; 75250 as 75 th round ; Sch. 25.0 ; L01 as Level 01
FAQs on Consumer Price Indices (CPI) for Rural, Urban and Combined
1. What is CPI?
Ans: Consumer Price Indices (CPI) measure changes over time in general level of prices of a basket of selected goods and services that households acquire for the purpose of consumption.
2. What is Inflation?
Ans: Inflation is the rate at which prices for a basket of selected goods and services rise over a period of time. Usually, it is calculated by measuring year on year change in CPI i.e. current month CPI over CPI of same month of last year.
3. What is the base year for current CPI series?
Ans: The Base Year of the current Consumer Price Index (CPI) series for Rural, Urban and Combined sector is $2012=100$.
4. How many items cover under CPI?
Ans: The current CPI basket at All India level comprises of 299 weighted items.
5. Who compiles CPI for Rural, Urban and Combined and since when it is released?
Ans: The National Statistical Office (NSO), erstwhile, Central Statistics Office (CSO), Ministry of Statistics and Programme Implementation (MoSPI) started releasing Consumer Price Indices (CPI) on base 2010=100 for All-India and States/UTs separately for Rural, Urban and Combined every month with effect from January, 2011. Subsequently, MoSPI has revised the Base Year of the Consumer Price Index (CPI) from 2010=100 to 2012=100 with effect from the release of indices for the month of January, 2015.
6. Which Consumer Price Indices are released by NSO?
Ans: The Consumer Price Indices released by NSO are as follows:
i. All India Group/Sub-group and General Consumer Price Index for Rural, Urban and Combined Sector.
ii. All India Consumer Food Price Index for Rural, Urban and Combined Sector
iii. State-wise Sub-group/Group/General Indices for Rural, Urban and Combined sectors in respect of Major States (having population more than 50 lakhs as per Population Census 2011).
iv. State-wise Group/General Indices for Rural, Urban and Combined sectors in respect of Minor States (having population less than 50 lakhs as per Population Census 2011).
v. All India Item Indices for Combined sector only
vi. Annual Inflation rates based on All India Sub-group/Group/General/ Consumer Food Price Indices, State-wise Sub-Group/Group/General Indices for Major States (having population more than 50 lakhs as per Population Census 2011) and State-wise Group/General Indices for Minor States (having population less than 50 lakhs as per Population Census 2011) for Rural, Urban and Combined sectors.
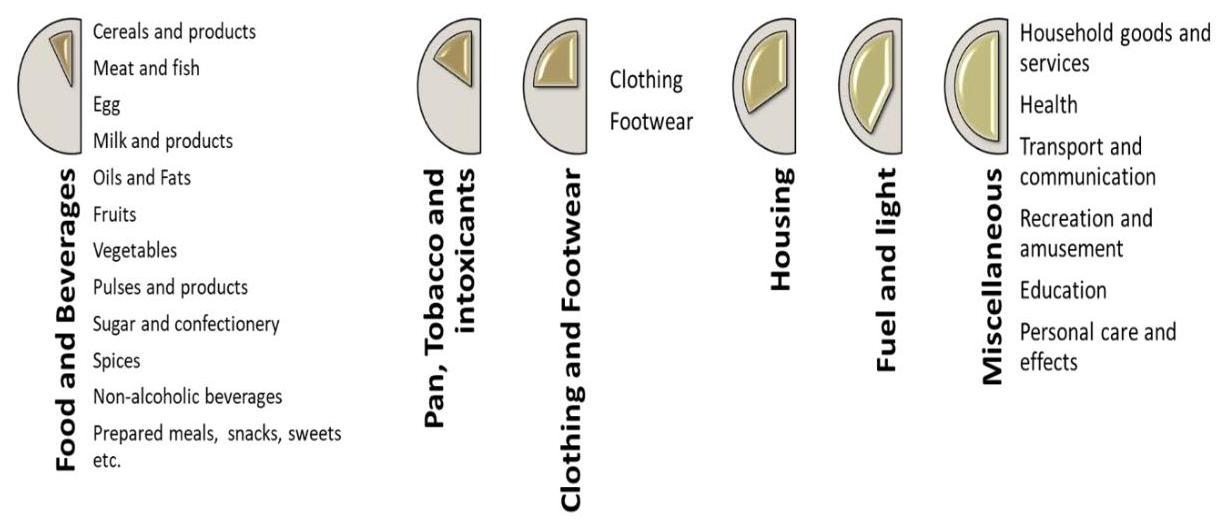
7. What are the different Groups and Sub-Groups covered under CPI?
Ans: The different Groups and Sub-Groups covered under CPI is given as follows:
8. What is Consumer Food Price Index?
Ans: Consumer Food Price Index (CFPI) measures changes over time in general level of retail prices of food items consumed by households. CFPI are being compiled as weighted average of the indices of the 1st ten subgroups, out of 12 sub-groups contained in ‘Food and Beverages’ group, excluding ‘Non-alcoholic beverages’ and ‘Prepared meals, snacks, sweets etc.’
9. What is a frequency of release of CPI?
Ans: CPI is released on monthly basis. Price Statistics Division, NSO, Ministry of Statistics and Programme Implementation (MoSPI) is responsible for preparation and release of Consumer Price Index (Rural, Urban, Combined) on 12th of every month (if holiday, next working day) at 5:30 PM.
10. What are the sources of price data used for compilation of CPI?
Ans: The monthly price data are collected from selected 1181 villages and 1114 urban markets in 310 selected towns and covering all States/UTs through personal visits by field staff of Field Operations Division of NSO, MoSPI on a weekly roster.
11. What is the source of Item Basket and Weighing Diagram of current CPI series?
Ans: For the present series of CPI with Base 2012=100, item basket and weights were derived on the basis of average monthly consumer expenditure of urban/rural household obtained from Modified Mixed Reference Period data of NSS 68th round Consumer Expenditure Survey (CES) conducted during 2011-12.
12. What are the uses of CPI for Rural, Urban and Combined?
Ans: Some of the uses of CPI for Rural, Urban and Combined is given as follows: –
i. CPI is widely used as a macroeconomic indicator of inflation.
ii. It is used as a tool by Government and Reserve bank of India for targeting inflation and for monitoring price stability.
iii. It is used as deflator in the National Accounts.
13. Where can one access the CPI figures for a month?
Ans: The CPI for Rural, Urban and Combined are released by the Ministry of Statistics and Programme Implementation through a Press Release Note on Consumer Price Index, which can be accessed from the official website of MoSPI i.e. www.mospi.gov.in. The detailed granular data can also be accessed from this website.
14. How can one access the time series data of CPI for Rural, Urban and Combined?
Ans: The complete time series data pertaining to the CPI for Rural, Urban and Combined is available on the warehouse page of Consumer Price Indices. The steps to access this warehouse is mentioned below: –
a. Open the web page of the Ministry: www.mospi.gov.in
b. On the Home page there is a tab ‘Consumer Price Index’. Click on that tab. It will pop up a message “You are about to proceed to an external website. Click Yes to proceed.” Click on ‘Yes’. It would take you to a page titled ‘Welcome to Consumer Price Indices Warehouse’.
c. There are different tabs like ‘Time Series’, ‘Annual Inflation Rates’, ‘All India Item Index’ etc; mentioned on the page ‘Welcome to Consumer Price Indices
Warehouse’. Click on those buttons and get the desired information, after choosing the relevant options. You can get more information on month wise CPIs and Inflation rates.
d. National Metadata Structure (NMDS) for Consumer Price Index (CPI) is available on the warehouse page of Consumer Price Indices under the tab ‘Metadata’
15. Is there any Metadata available for CPI for Rural, Urban and Combined?
Ans: Yes, National Metadata Structure (NMDS) for Consumer Price Index (CPI) is available on the warehouse page of Consumer Price Indices under the tab ‘Metadata’. It can also be accessed using the following link https://cpi.mospi.gov.in/PDFile/ National Metadata Structure for CPI.pdf
1. What is Index of Industrial Production (IIP)?
Ans: The all India Index of Industrial Production (IIP) is a short-term composite indicator that measures the changes in the volume of production of a basket of industrial products during a given period with respect to that in a chosen base period.
2. What is coverage of IIP?
Ans: The index is being compiled with (i) Mining, (ii) Manufacturing and (iii) Electricity as scope of all India IIP. In the current base year (i.e. 2011-12), the index covers 839 items clubbed into 407 items groups under three sectors i.e. Mining ( 29 items clubbed into 1 item group), Manufacturing ( 809 items clubbed into 405 item groups) and Electricity ( 1 item) with weights of $14.37 \%, 77.63 \%$ and $7.99 \%$ respectively.
3. What is the importance of IIP?
Ans:
- The all-India IIP provides a single representative figure to measure the general level of industrial activity in the economy on a monthly basis.
- It is used by Government agencies/ departments especially the Ministry of Finance, the Reserve Bank of India, etc. for policy purposes.
- The all-India IIP forms a crucial input for compilation of Gross Value Added of Manufacturing sector in Gross Domestic Product of the country on quarterly basis. It is also used extensively by financial intermediaries, policy analysts and private companies for various analytical purposes suited for their requirements.
4. What is the base year of IIP?
Ans: The current base year of IIP is 2011-12
5. Which classification is used for IIP?
Ans: Classification: The current series of IIP (base 2011-12) follows the National Industrial Classification 2008 (NIC-2008) which is based on ISIC-Rev 4 published by UNSD.
6. What is the recommended procedure for selection of item basket with base year 2011-12?
Ans: Item Basket for the three sectors are as follows:
i. Mining
$>$ Mineral items (MCDR Minerals) produced within the geographical boundaries.
Data is available from Indian Bureau of Mines.
ii. Electricity Sector
Generation within the geographical boundaries (Conventional \& Renewable)
$>$ Data is available from Central Electricity Authority
iii. Manufacturing Sector
Representative basket is selected from Annual Survey of Industries (ASI) data.
The items which represent at least $80 \%$ of the output within each industry group (NIC 3 digit) in ASI 2011-12 have been included in the basket.
Q. How to draw Weighting Diagram of IIP?
Ans:
Weighting Diagram is drawn by using National Accounts data and ASI data of base year.
i. Sectoral Weights
Sectoral GVA figures are taken from National Accounts Statistics
ii. NIC 2/3/4-digit level weights
Weight of Manufacturing sector proportionately distributed in NIC 2 Digit level in proportion of their GVA in ASI of base year
Weight of NIC 2 Digit level proportionately distributed in respective NIC 3 Digits in proportion of their GVA in ASI of base year
Weight of NIC 3 Digit level proportionately distributed in respective NIC 4 Digit in proportion of their GVA in ASI of base year
iii. Item level weights
Weight of NIC 4 Digit level proportionately distributed among the items within the NIC 4 Digit in proportion of their GVO in ASI of base year
Q. How to select the manufacturing factory /Industrial unit for IIP.
Ans.
i. Mining Sector: Data is collected from all the producing units/ mines by Indian Bureau of Mines (IBM)
ii. Electricity Sector: Data is collected from all the generation units by Central Electricity Authority (CEA)
iii. Manufacturing Sector:
Data is collected on both Census basis and from panel of factories
The panel of factories for Manufacturing sector is selected using ASI data of base year. The factories contributing 80 percent towards the total output of an item are selected.
7. How is data collected for IIP compilation?
Ans: IIP is compiled using secondary data from 14 different source Ministries/Departments. The largest source agency for IIP is Department for Promotion of Industry and Internal Trade (DPIIT).
8. Which formula is used for IIP compilation?
Laspeyres’ formula is used to compile Index
$$
I=\frac{\sum W_{i} I_{i}}{\sum W_{i}}
$$
[where $I$ is the Index; $W_{i}$ is the weight of the $i^{\text {th }}$ item group; $I_{i}$ is the index of the $i^{\text {th }}$ item group.]
Index for Item Group: $I_{i}=R_{i} X 100$
Where
$$
R_{i}=\frac{\text { Deflated production of current month }}{\text { Average production of Base Year }}
$$
- How many Use-Based Categories are in IIP?
Ans: The item groups in IIP have been categorized as per the following use-based classifications:
i. Primary goods: Only such goods as are directly obtained from natural sources and used for further processing and consumption in manufacturing and powergenerating activities.
ii. Capital goods: Plants, machinery and goods used for further investments. E.g.: Boilers, Air \& Gas Compressors, Engines including Internal Combustion and Diesel Engine, Tractors (complete), Transformers, Commercial Vehicles and all machineries like Textile Machinery, Printing Machinery etc.
iii. Infrastructure/ construction goods: Finished goods which are primarily used in infrastructure industry or construction industry as an input. This category has been created to precisely categorise items which could not be classified under Consumer durables or Intermediate goods. E.g.: paints, cement, cables, bricks and tiles, rail materials, etc.
iv. Intermediate goods: Any good/ product produced as incomplete product or which goes as input in production for further finishing or forming a part of a product. E.g.: Cotton yarn, Plywood, Steel Tubes/ Pipes, Fasteners, etc.
v. Consumer durables: Products directly used by consumers and having a longer durability (more than 2/3 years). E.g.: Pressure Cooker, Air Conditioners, Tyres, Telephone and mobile instruments, TV Sets, Passenger cars, Two-wheelers (motorcycles/ scooters), Jewellery of gold etc.
vi. Consumer non-durables: Products that are directly used by consumers and can’t be preserved for long periods. E.g.: Soyabean Oil, Full-cream/ Toned/ Skimmed milk, Milk Powder, Maida, Rice, Biscuits/ cookies, Sugar, Tea, Cigarettes, etc
9. What is the revision policy for IIP?
Ans : Each month data is published for 3 periods:
- Reference month for Quick estimate (e.g. January 2023)
- Previous month of the reference month for $1^{\text {st }}$ revision (e.g. December 2022)
- Third previous month of the reference month for final estimate (e.g. October 2022)
10. How is IIP disseminated in public domain?
Ans : On $12^{\text {th }}$ of every month (previous working day if $12^{\text {th }}$ is a holiday) – lag 42 days
- Through press release on PIB
- Through MoSPI website
- Monthly indices along with their growth rates ( $y$-o-y)
- Sectoral level
- NIC 2-digit level
- Use Based Category wise
- Item group level production and indices are provided through micro data catalogue on MoSPI’s Website to registered users.
FAQ on National Factsheet :
1. What is Monthly National Factsheet?
Ans: The Monthly National Factsheet is a report published by the Economic Statistics Division (ESD) of MoSPI based on the Key Economic Indicators of India.
2. When the report gets published by MoSPI?
Ans: The report is prepared on monthly basis by MoSPI.
Based on the updated Statistics on Key Economic Indicators, as available in their updated monthly reports of different concerned Ministries, the National Factsheet gets updated and published in the official website of MoSPI latest by $15^{\text {th }}$ of the Month.
3. How many Indicators are covered under this report?
Ans: The report of National Factsheet covers 30 Indicators spanned across different facets of the Indian economy.
4. What are the sectors/categories against which the information gets collected?
Ans: The 30 Key Economic Indicators covers the following eight (8) major sectors of the Indian Economy.
- National Account Statistics (information on GVA, GDP, Consumption Expenditure etc.);
- Industry Indices (information on IIP, Index of Eight Core Indices etc.);
- Price Indices (information on WPI, CPI etc.);
- Fiscal Statistics (information on GST collection, Gross Receipt and Expenditure of Govt. etc.);
- External Sector Statistics (information on gross Import/Export, Foreign Reserve etc.);
- Production Statistics (information on production of agri. products, coal, natural gas etc.);
- Labor Statistics (information related to EPF, unemployment rate etc.) and
- Infrastructure Statistics;
- What is the form of the uploaded report? Can it be downloaded for free?
Ans: The report gets uploaded to the official website of MoSPI in MS Excel form. Yes, the same can be easily downloaded (free of cost ).
FAQ On The annual publication of Energy Statistics of India:
1. What is meant by Energy Commodity?
Ans: Commodities which are the resources of Energy like Coal, Crude Oil, Natural Gas etc. are termed as Energy Commodities.
2. What the publication Energy Statistics of India, consists of?
Ans: The publication of Energy Statistics of India contains an integrated database of diverse key information pertaining to reserve, capacity, production, consumption, import/export of energy commodities/products (like Coal, Lignite, Petroleum, Natural Gas, Renewable Energy etc.) of India against a particular financial year.
3. What are the data-sources of Energy Statistics?
Ans: The ESD collects secondary information on energy Statistics from all the concerned energy Ministries like, M/o Coal, M/o Petroleum and Natural Gas, M/o Power, M/o New and Renewable Energy.
4. How Energy statistics gets collected?
Ans: Energy data in India gets collected and compiled by different energy Ministries by invoking different Statutory Rules/Acts like,
- Collection of Statistics Act 2008 by MoSPI;
- Colliery Control Rule, 2004;
- The Oilfields (Regulation and Development) Act, 1948 etc.
- When the publication is finalised and available?
Ans: The publication Energy Statistics of India, is finalised and uploaded in the official website of MoSPI latest by $31^{\text {st }}$ March.
6. What are the different chapters of Energy Statistics India publication?
Ans: The entire publication has been organised into eight (8) different segments/chapters. Those are given as below:
- Reserves and Potential for Generation: The section contains the potential reserves of all Energy Commodities (like Coal, Lignite, Crude Oil, Natural Gas etc.) and Renewable Energy resources (like Wind, Hydro, Solar, etc.)
- Installed Capacity and Capacity Utilisation: The section contains the capacity of all the installed coal-washeries, oil-refineries, power-plants to generate the required outcome.
- Production of Energy Resources: The section contains the production of all energy commodities (like Coal, Lignite, Crude Oil, Natural Gas etc.) over a financial year. The Chapter also contains the production of different petroleum products (like Diesel, Petrol, LPG etc.) and generation of electricity (sources wise like Thermal, Hydro, Nuclear etc.).
- Foreign Trade and Prices of Energy Resources: This section contains the Import/Export of all the Energy Commodities (like Coal, Lignite, Crude Oil, Petroleum Products etc.) over a financial year. This depicts the Import dependency of India in Energy sector.
- Availability of Energy Resources: The section contains the final figures of availability of all the energy commodities (like Coal, Lignite, Crude Oil, Petroleum Products, Electricity etc.) in India over financial years, incorporating the figures of Net Import (Import-Export) and Change of Stock (Closing Stock – Opening Stock).
- Consumption of Energy Resources: The section contains the sector-wise end use consumption of all energy commodities. The flow of energy in fulfilling all the needs of the economy against a particular financial year.
- Energy Balance and Sankey Diagram: The section contains the Energy Commodity Balance, Energy Balance table of India along with the Sankey Diagram.
- Sustainability and Energy: This section contains different Sustainable Indicators of India based on the available energy statistics.
- What is meant by Energy Commodity Balance?
Ans: A table containing the information on all energy products, entering and used by the economy. It relates to:
- Information on Production, Import, Export, Transformation (from Primary Energy to Secondary Energy) and Supply of all Energy Commodities;
- Against a particular time-period;
- Within the national territory of the country;
- All units are as per the standard reporting units of the energy-commodities
- What is meant by Energy Balance?
Ans: The Energy Balance table summarises the flow of the Energy in a single tabular form.
- The quantity units are transferred into energy units by using suitable conversion factors;
- Against a particular time-period and within the national territory of the country;
- Generates a comprehensive overview of the energy profile of a country;
- Indispensable tool to monitor energy security, energy market, future prediction and determination of different policies at national level.
- What is Sankey Diagram?
Ans: The Sankey Diagram is a pictorial representation of the flow of energy in a nation. The Sankey Diagram generated from the Energy Balance table, helps us to visualize the existing energy flow scenario and identify the areas of improvement.
10. How to get the publication?
Ans: The soft copy of the Annual publication of Energy Statistics India, is available in the official website of MoSPI. All the tables are also available in the form of MS-Excel for the ease of user. The same can be easily downloaded from the Download Report section (https://www.mospi.gov.in/downloadreports ) of MoSPI website.
FAQ On Economic Census
1. What is Economic Census?
Ans : Economic Census (EC) is the complete count of all non-farm establishments (i.e. units engaged in production and/or distribution of goods and services not for the purpose of sole consumption) located within the geographical boundaries of the country. Economic Census (EC) is the complete count of all non-farm economic establishments located within the geographical boundary of India.
2. What is the purpose of Economic Census?
Ans : Economic Census provides disaggregated information on various operational and structural variables of all such establishments of the country. Economic Census provides valuable insight into geographical spread/clusters of economic activities, ownership pattern, persons engaged, etc. of all economic establishments in the country. The information collected during Economic Census is useful for socio-economic developmental planning at state and district levels. Economic Census provides an updated sampling frame for follow- up enterprise surveys undertaken for detailed and comprehensive analysis of all non-farm establishments in the country.
3. How many Economic Censuses have been held till date.
Ans : So far, 6 Economic Censuses have been conducted in years 1977, 1980, 1990, 1998, 2005 and 2013. Data collection for $7^{\text {th }}$ Economic Census has been conducted during 2019-21. Data finalization is currently being undertaken in coordination with State/UT and the Implementing Agency.
4. What is establishment?
Ans : An establishment is a unit situated in a single location in which predominantly one kind of entrepreneurial activity is carried out such that at least a part of the goods and / or services produced by the unit goes for sale (i.e. entire produce is not for sole consumption). Establishments may be located at Residential or Commercial EC house.
5. What kind of establishments are covered in Economic Census?
Ans: All kind of establishments (formal, informal, fixed structure, within the household, outside the household without any fixed structure) engaged in various entrepreneurial activities (excluding crop production, plantation, public administration, defence and compulsory social security) are covered in Economic Census.
- What parameters are captured in Economic Census?
Ans: Various important economic parameters such as: Nature of Economic Activity, Type of ownership, Hired & non-hired workers, Major source of finance. etc. are captured in Economic Census.
- What is excluded in Economic Census?
Ans: Following establishments are excluded from coverage under Economic Census:
- Establishments of shelter-less and nomadic population, which keep on moving from place to place and camp either without shelter or with makeshift shelter.
- Establishments engaged in some illegal activities like smuggling, gambling, beggary, prostitution, etc.
- Domestic servants, whether they work in one household or in a number of households, drivers, etc. who undertake jobs for others on wages.
- All wage-paid employees of casual nature.
- Household members engaged in household chores.
- Persons doing different types of jobs depending on the availability of work e.g. loading, unloading, helping a mason or a carpenter, doing earthwork for a contractor.
- Household members working for other households and earning some money which is insignificant.
- Households in which none of the members is engaged in any gainful activity i.e. Households depending on remittance, rent, interest, pension etc.
#
FAQs on Public Grievances
1. What are the contact details of the Grievance Cell, Ministry of Statistics \& Programme Implementation?
Ans: PIGR Section, Ministry of Statistics \& Programme Implementation, Room No. 613, $6^{\text {th }}$ Floor, Khurshid Lal Bhawan, Janpath Road, New Delhi – 110001
Tele: 011-23455613 E-mail: pigr-mospi@mospi.gov.in
2. Where can the grievances be sent?
Ans: The grievance can be lodged by the aggrieved persons on-line through pqportal.gov.in and pqportal.gov.in/pension/. It can also be sent by post or by hand in person addressing it to Nodal Officer for Public Grievances in the Ministry.
3. How do I lodge the grievance?
Ans: The grievances can be lodged on-line. In cases where internet facility is not available or even otherwise, the aggrieved person is free to send her/his grievance by post. There is no prescribed format for lodging a grievance.
The grievance may be written on a plain sheet of paper or on a Postcard/ Inland letter and addressed to the Nodal Officer for Public Grievance in the Ministry.
4. What happens when I lodge the grievance on-line?
Ans: The grievance is acknowledged on-line. A unique registration number is given to each grievance. After examination at initial level, the same is taken up with the concerned authority in the Ministry for expeditious redressal.
5. How do I track the status of my grievance?
Ans: Status of the grievance can be tracked on the PG Portal by entering the unique registration no. and other basic details.
6. What happens to the grievances? How are the grievances dealt with in the Ministries?
Ans: A Nodal Officer for redressal of grievance cases arising out of work areas allocated to this Ministry has been nominated. Further, Public Grievance Officers (PGO) have been nominated for various sections/divisions/subordinates’ offices within the Ministry. Nodal Officer is responsible for monitoring the timely redressal of PG cases as well as overall supervision of the process of redressal of PG cases.
7. How can the Nodal Officer for PG of the Ministry be reached?
Ans: Shri Raj Kumar, Deputy Secretary (C \& P), Ministry of Statistics \& Programme Implementation is currently the Nodal Officer for PG matters in the Ministry. His contact details are as below:
Address: Room No. 303, $3^{\text {rd }}$ Floor, Khurshid Lal Bhawan, New Delhi – 110001.
Tele: 011-23455303, E-mail: raj.k@nic.in
8. After redressal, can the grievance be re-opened for further correspondence about it having been closed for the want of adequate details for closure of grievance etc.?
Ans: Yes, the aggrieved person can lodge an Appeal to the Appellate Authority for PG matters in the Ministry. Currently, Shri Tanweer Qamar Mohammad, Joint Secretary (A) is the Nodal Appellate Authority for PG matters in the Ministry. His contact details are as below:
Address: Room No. 309, $3^{\text {rd }}$ Floor, Khurshid Lal Bhawan, New Delhi – 110001.
Tele: 011-23455309, E-mail: tq.mohammad@qov.in
9. What are the types of grievances which are not taken up for redressal by the Ministry/Department?
Ans:
- Grievances by serving employees by-passing the existing channels in the hierarchy available to them.
- Sub-judice Matters/ Policy Decision/ Statutory Changes.
- Personal and family disputes.
- RTI matters.
- Suggestions.
10. What is the time limit for redressal of grievance?
Ans: Department of Administrative Reforms \& Public Grievances (DARPG) has prescribed a time-limit of thirty (30) days for redressal of grievance. In case of delay, an interim reply with reasons for delay is given. Covid-19 related Grievances are redressed within 3 days of the receipt.
11. What action can be taken by me in case of non-redressal of my grievance within the prescribed time?
Ans: You may take up the matter with the Nodal Officer of the Ministry.
12. What should an aggrieved do for quick redressal of his/her grievance?
Ans: They should try to provide the complete facts of their grievance so that the unnecessary delay in tracking the aggrieved for additional details for examining the case further can be avoided.
13. What precautions should pensioners take while lodging a grievance?
Ans: The pensioners must provide the precise details mentioning the name of Section/Division where he last served, details of the last post held, year of retirement, details of Pension Payment Order (PPO) for cases related to revision of pension, details of the last scale of pay drawn, etc.
- Can serving employees represent their grievance through PG Portal of Ministry/DARPG/PMO?
Ans: No. Serving employees can not resort to PG Portal without exhausting the proper channels available to them in the hierarchy. As per Instructions issued by DoPT vide its OM No. 11013/08/2013-Estt. (A-III) dated 31.08.2015, it may attract Disciplinary Action if PG case is lodged by surpassing the existing channels available to the serving Government employees.
FAQs on National Accounts
- How to get information about release dates of upcoming GDP releases?
Ans: All the estimates of GDP are released as per pre-announced schedule given in Advance Release Calendar (ARC). ARC can be downloaded from website of MoSPI through the following path: Home $\rightarrow$ Release Calendar $\rightarrow$ Advance Release Calendar Link: https://mospi.gov.in/release-calendar
2. From where one can download methodology for compiling Advance and Quarterly estimates of GDP?
Ans: Methodology for compiling Advance and Quarterly estimates of GDP is available under Home $\rightarrow$ Download Tables Data $\rightarrow$ Document Related To National Account $\rightarrow$ Methodology Document for compilation of Quarterly GDP.
Link: https://mospi.gov.in/document-related-national-account
3. From where one can obtain time series information on quarterly estimates of various micro-economics aggregates?
Ans: Time series information on Quarterly estimates (base year 2011-12) at current and constant prices are available under Home $\rightarrow$ Download Tables Data $\rightarrow$ National Accounts Data at Statement 12 and 13.
Link: https://mospi.gov.in/data
4. How can one download statements annexed to Press Note in MS Excel format?
Ans: Link to download statements in excel format is highlighted in blue colour in Para 2 or 3 of the Press Note itself.
- Where can one find Revision Policy for Annual and Quarterly Estimates of GDP and related Macro-economic Aggregates?
Ans: MoSPI has issued a notification regarding release dates of Revision in Annual and Quarterly Estimates of GDP and related Macro-economic Aggregates and the same can be downloaded from the link:
https://www.mospi.gov.in/sites/default/files/main menu/nsdp sdds/Notification ReI easeCalendarChange.pdf.
6. How can one download Revision Matrix of GDP?
Ans: Quarterly and Annual GDP Revision matrix is available at Home $\rightarrow$ Download Tables Data $\rightarrow$ National Accounts Data at Statement 19 and 20 respectively.
Link: https://mospi.gov.in/data
7. How can one get XML file of Statistical Data and Metadata eXchange (SDMX)?
Ans: XML file of Statistical Data and Metadata eXchange (SDMX) is uploaded under the tab Home $\rightarrow$ Statistical Data and Metadata eXchange (SDMX) $\rightarrow$ Quarterly Estimates of GDP at Current and Constant Prices, 2011-12 series.
Link: https://mospi.gov.in/statistical-data-and-metadata-exchange-sdmx/
8. Where can one get National Summary Data Pages (NSDP) uploaded by MoSPI under Special Data Dissemination Standard (SDDS)?
Ans: National Summary Data Pages (NSDP) under SDDS are available at Home page of MoSPI’s website under the floating tabs Home $\rightarrow$ NSDP/SDDS.
Link:
https://mospi.gov.in/sites/default/files/main menu/nsdp sdds/nad nsdp real sector. pdf
9. What is National Accounts Statistics Publication and from where it can be accessed?
Ans: National accounts Statistics (NAS) publication of Ministry of Statistics and Programme Implementation contains time series information on various macroeconomic aggregates including GDP, GVA, PFCE, GFCE, GCF etc. Besides, Sequence of Accounts for Institutional Sectors are also published in NAS publication. National Account Statistics publications can be accessed from the website of the ministry in the ‘Miscellaneous Report’ Section under ‘Download Reports’ on the home page.
10. From where one can access the concept, definition and methodology for compilation of estimates of various macro-economic aggregates?
Ans: A) Sources and Methods: This publication of Ministry of Statistics and Programme Implementation describes the sources and methods of estimation of macroeconomic aggregates, domestic product, consumption expenditure, saving,
capital formation, capital stock, accounts of the public sector and consolidated accounts of the nation, which are presented in the Ministry of Statistics and Programme Implementation (MoSPI’s) annual publication ‘National Accounts Statistics’ (NAS). The same can be accessed from the website of the ministry through the link given below:
https://www.mospi.gov.in/sites/default/files/publication_reports/sources_method_2012 \%20\%281\%29.pdf
B) Changes in Methodology and Data Sources in The New Series of National Accounts Base Year 2011-12: This publication was brought out by Ministry of Statistics and Programme Implementation subsequent to the release of the new series of national accounts with base year 2011-12. The publication has details of changes in methodology and data Sources in the new Series of National Accounts the same can be accessed from the website of the ministry through the link given below:
https://www.mospi.gov.in/sites/default/files/publication_reports/Changes\%20in\%20M
ethodology\%20and\%20Data\%20Sources\%20in\%20the\%20New\%20Series\%20of\%20Na tional\%20Accounts Base\%20year\%202011-12.pdf
11. From where one can access the methodology used for generating the National Accounts Statistics for Private Corporate Sector?
Ans: The detailed methodology for compiling the National Accounts Statistics for Private Corporate Sector is available in the report titled “Final Report of the Subcommittee on Private Corporate Sector including PPPs” which is available in public domain in MoSPI’s website
at
the
link https://mospi.gov.in/sites/default/files/publication_reports/final Report Goldar s ubcommittee2mar15.pdf
12. From where one can obtain time series information on Gross Value Added by economic activity at current prices for Private Corporations?
Ans: Information on Gross Value Added and related estimates by economic activity at current prices is available at Statement 7.1B of “National Accounts Statistics” publication of MoSPI.
13. From where one can get the value added by central and state governments?
Ans: Information on value added by central and state governments is available in “National Accounts Statistics” publication of National Accounts Division (NAD), MoSPI at Statement 4.1.
14. From where one can get the sequence of accounts for General Government?
Ans: Information on sequence of accounts for General Government is available in “National Accounts Statistics” publication of National Accounts Division (NAD), MoSPI at Statement 4.0.
- What is the specific macro aggregate data of Agriculture and allied sectors available in National Accounts Statistics and how it can be accessed?
Ans: Output \& value added from Crop; Livestock; Forestry \& logging; and Fishing \& aquaculture sectors at Constant and Current Prices for the current series (2011-12) may be obtained from the latest annual publication of ‘National Accounts Statistics’ (NAS) in the Statements 8.1.1, 8.1.2, 8.2, 8.3 and 8.4. The other statements of NAS can also be referred for additional data of this sector such as Gross Capital Formation, Compensation to Employees, Operating Surplus etc. The latest publication of NAS can be accessed at MOSPI website using the link “https://www.mospi.gov.in/download-reports”.
16. Whether item-wise output \& value added from Crop, Livestock, Forestry and Fisheries sector are available at State/District/Block level?
Ans: Only State-wise and Item-wise value of output for Crop, Livestock, Forestry and Fisheries sector are available at Constant and Current Prices for the current series (201112) and can be accessed at the link given below: “https://www.mospi.gov.in/download-reports”
17. From where one can obtain time series information on subsector-wise Gross Value Added of Electricity, Gas, Water Supply and Remediation services at current and constant prices?
Ans: Information on subsector-wise Gross Value Added of Electricity, Gas, Water Supply and Remediation services at current and constant prices are available in “National Accounts Statistics” publication of National Accounts Division (NAD), MoSPI at Statement 8.7.
18. From where one can obtain time series information on Category-wise Gross Value Added of Minerals at current and constant prices in mining \& Quarrying sector?
Ans: Information on category-wise Gross Value Added of Minerals at current and constant prices are available in “National Accounts Statistics” publication of National Accounts Division (NAD), MoSPI at Statement 8.5.
19. From where one can obtain time series information on subsector-wise Gross Value Added of Manufacturing at current and constant prices?
Ans: Information on subsector-wise Gross Value Added of Manufacturing at current and constant prices are available in “National Accounts Statistics” publication of National Accounts Division (NAD), MoSPI at Statement 8.6.1Part 2 \& 8.6.2 part 2.
- From where one can obtain time series information on Output and Gross Value Added of Construction?
Ans: The time series information on Output and Gross Value Added pertaining to Construction both at current and constant prices is available in Statement 8.8 of “National Accounts Statistics” publication of MoSPI.
21. From where one can obtain time series information on subsector-wise Gross Value Added of financial services at current and constant prices?
Ans: Information on subsector-wise Gross Value Added of financial services at current and constant prices are available in “National Accounts Statistics” publication of National Accounts Division (NAD), MoSPI at Statement 8.12.
22. From where one can obtain time series information on Output and Gross Value Added of Non-financial Service sector?
Ans: The time series information on Output and Gross Value Added pertaining to service sector both at current and constant prices is available from Statement 8.9 to Statement 8.14 of “National Accounts Statistics” publication of MoSPI.
| Outputs and Value Added from trade, repair services, hotels \& restaurants |
Statement 8.9 |
|---|---|
| Output \& Value Added from transport services |
Statement 8.10 |
| Output \& Value Added from storage, communication \& services related to broadcasting |
Statement 8.11 |
| Value Added from financial services | Statement 8.12 |
| Outputs \& Value Added from real estate, ownership of dwelling \& professional services |
Statement 8.13 |
| Outputs Value Added from other services | Statement 8.14 |
- From where one can obtain time series of Estimates of Private Final Consumption Expenditure (PFCE)?
Ans: The time series information in respect of Private Final Consumption is available in following statements of National Accounts Statistics” publication of MoSPI.
| Private Final Consumption Expenditure at current and constant prices |
Statement 1.12 |
|---|---|
| Private final consumption expenditure classified by item |
Statement 5.1 |
|---|---|
| Individual consumption expenditure by households and general government |
Statement 5.2 |
- From where one can obtain time series of Estimates of Gross Capital Formation (GCF)?
Ans: The time series information in respect of Gross Capital Formation (GCF) is available in following statements of National Accounts Statistics” publication of MoSPI.
| Gross Capital Formation by Industry of Use | Statement 1.10 |
|---|---|
| Gross Fixed Capital Formation by Asset \& Institutional Sector at current and constant prices |
Statement 1.11 |
| GCF, GFCF, CIS, CFC, by Industry | Statement 7.2 |
| GFCF by type of asset, by Industry | Statement 7.3 |
- From where one can obtain time series information in respect of Financial assets and liabilities of the household sector?
Ans: The time series information in respect of Financial assets and liabilities of the household sector is available in Statement 5.3 of “National Accounts Statistics” publication of MoSPI.
FAQs on Gender Statistics
1. What is the difference between sex and gender?
Ans: The word “sex” refers to biological differences between women and men. Biological differences are fixed and unchangeable and do not vary across cultures or over time. Meanwhile, “Gender”, refers to socially-constructed differences in the attributes and opportunities associated with being female or male and to social interactions and relationships between women and men.
2. What is the difference between gender equality and gender equity?
Ans: Gender equality, equality between men and women, entails the concept that all human beings, both men and women, are free to develop their personal abilities and make choices without the limitations set by stereotypes, rigid gender roles and prejudices ${ }^{1}$. Gender equality means that an individual’s rights, responsibilities and opportunities will not be determined by the sex they are assigned at birth.
Gender equity means fairness of treatment for all genders according to their respective needs. This may include equal treatment or treatment that is different but which is considered equivalent in terms of rights, benefits, obligations and opportunities. Thus, gender equity leads to gender equality.
3. What is gender inequality?
Ans: Gender inequality refers to the unequal treatment and opportunities that individuals face based on their gender. It can manifest in various ways such as unequal pay, limited access to education and employment opportunities, discrimination based on gender stereotypes, etc.
4. Why does gender inequality exist?
Ans: Gender inequality exists due to a variety of factors, including cultural and social norms that reinforce gender stereotypes and biases, limited access to education and economic opportunities, discriminatory laws and policies, and gender-based violence and harassment.
5. What are gender statistics?
Ans: Gender statistics are defined as statistics that adequately reflect differences and inequalities in the situation of women and men in all areas of life ${ }^{2}$. Gender statistics are defined by the sum of the following characteristics: (a) data are collected and presented with disaggregation by sex as a primary and overall classification; (b) data reflect gender issues; (c) data are based on concepts and definitions that adequately
reflect the diversity of women and men and capture all aspects of their lives; and (d) data.
6. Why are gender statistics important?
Ans: Women and girls constitute almost half the population of a country and hence a nation can’t develop unless the concerns of its one-half is addressed in all its decisions. Gender statistics are therefore necessary to:
- Design inclusive and effective policies that meet the needs of all
- Ensure the schemes initiated by the Government benefit men and women equally.
- Keep government accountable for their commitments, including the achievement of Sustainable Development Goals (SDGs)
- Advocate for gender equality and women’s and girl’s empowerment in an effective and truthful way
- Conduct analysis and academic research on the differentiated characteristics of the lives of women and men.
- What kinds of data are included in gender statistics?
Ans: Gender statistics cover a wide range of data related to the socio-economic and political conditions of women and men viz. education, employment, health, violence against women, poverty, participation in decision making, political participation.
8. What are gender indicators?
Ans: Indicators are a quantitative metric that provide information to monitor performance, measure achievement and determine accountability. ${ }^{3}$ Gender indicators, therefore, are tools for measuring gender inequalities or gender-specific issues. Types of gender indicators are as follow:
- Targeted gender-specific indicators: These indicators refer explicitly to issues pertaining to either women or men (e.g. adolescent fertility rates) and are therefore gender-specific by default.
- Gender-specific indicators where sex-disaggregation is explicitly mentioned: These indicators includes the explicit mention “by sex”. Therefore, data produced will quantify as gender statistics. E.g. Proportion of employed who are own-account workers, by sex. It is often the case that data can be further disaggregated beyond just sex. For example, data has also been disaggregated by marital status to capture the situation of single mothers.
- Gender-relevant indicators: These are indicators that do not necessarily mention sex or gender but have a gender angle. E.g.: The indicator “Proportion of households using
1
clean cooking fuel” fits in this category because use of clean fuels has a significant effect on indoor air quality. Women tend to spend longer than men inside the household, and are often tasked with cooking, the use of unclean fuels affects their health disproportionately.
9. What are the methods for gender data collection?
Ans: Like any other statistics, gender statistics produced are also based on three main datacollection instruments: administrative records or registries, household \& enterprise surveys and population censuses. It is important to ensure that gender perspective is integrated into data collection. It goes beyond just collecting data disaggregated by sex but involves including questions that are women specific as also those that impact men and women differently to make it useful for analysis.
10. Whether Gender statistics is simply data disaggregated by sex?
Ans: Gender statistics are more than data disaggregated by sex. Sex-disaggregated statistics are simply data collected and tabulated separately for women and men. Disaggregating data by sex does not guarantee, for example, that the data collection instruments involved in the data production were conceived to reflect gender roles, relations and inequalities in society ${ }^{4}$.
On the other hand, some statistics that incorporate a gender perspective are not necessarily disaggregated by sex. For example, national accounts statistics that incorporate a gender perspective take into account both women’s and men’s contribution to all social and economic areas, including unpaid work.
In most societies, being a man or a woman is not simply a matter of different biological and physical characteristics. Men and women face different expectations about how they should dress, behave or work, etc.
11. How can gender statistics be used to promote gender equality?
Ans: Gender statistics can be used to identify areas where gender-based disparities exist, helps in formulating policies and programs aimed at reducing these disparities and track progress towards gender equality. By using data for informed decision-making, policymakers can make more choices and allocate resources more effectively to promote gender equality.
12. What are some challenges associated with collecting and using gender statistics?
Ans: There are numerous challenges associated with collecting and using gender statistics including issues related to data availability and quality, data privacy \& confidentiality; and cultural and social barriers to collecting data on sensitive topics. Additionally, it is important to ensure that gender statistics are used in ways that are sensitive to the diverse experiences and needs of different groups of women and men.
13. What is mainstreaming a gender perspective in statistics?
Ans: Mainstreaming a gender perspective in statistics means that gender issues and genderbased biases are systematically taken into account in the production of all official statistics and at all stages of data production ${ }^{5}$. The purpose of gender mainstreaming is to promote gender equality and the empowerment of women in population and developmental activities. Mainstreaming a gender perspective in the national statistical system may also lead to more efficient coverage of gender issues and better coordination among data collection programmes in producing gender statistics.
14. What kind of gender statistics are available in India?
Ans: Gender statistics in India cover a range of topics, including education, employment, health, violence against women, and political participation. These statistics are collected by various government agencies.
15. What does the Ministry of Statistics and Programme Implementation on Gender Statistics?
Ans: For improved access to gender statistics, The Ministry of Statistics and Programme Implementation has been releasing a publication titled “Women and Men in India” since 1995 which provides data and analysis on major socio-economic indicators relevant to the status of women and men in India.
16. What are the topics covered in the publication “Women and Men in India”?
Ans: The publication covers topics such as population, health, education, employment. The publication also provides information on participation of women in decision making, impediments in empowerment and Minimum Set of Gender Indicators.
17. What are the key data sources used in the Publication “Women and Men in India”?
Ans: The key data sources used in the publication are Population Census, Population Projection, Sample Registration System, National Family Health Survey(NFHS), National Sample Surveys (NSS), Unified District Information System for Education Plus (UDISE+), All India Survey on Higher Education (AISHE), administrative data available with different Ministries/Departments of Govt. of India.
18. How the publication “Women and Men in India” is useful?
Ans: The publication “Women and Men in India” provides a variety of available gender statistics at one place to serve as a single platform for accessing gender statistics which is
useful for policymakers, researchers, civil society and organizations working to promote gender equality in India.
19. What is the periodicity of the publication “Women and Men in India”?
Ans: The publication “Women and Men in India” is published annually. The latest publication is the $24^{\text {th }}$ issue released in 2023.
20. How can the publication “Women and Men in India, 2022” be accessed?
Ans: The publication “Women and Men in India, 2022” can be accessed through Ministry’s website and is available at https://mospi.gov.in/publication/women-men-india-2022.
21. How can individuals use the information in the publication “Women and Men in India” to promote gender equality?
Ans: Individuals can use the information in the “Women and Men in India” to raise awareness about gender disparities and advocate for policies and programs that promote gender equality. The report can also serve as a tool for monitoring and evaluating progress towards gender equality in India.
22. What are Minimum Set of Gender Indicators?
Ans: The Minimum Set of Gender Indicators is a collection of 51 quantitative and 11 qualitative indicators measuring and collecting information on issues relevant for gender equality and women’s empowerment ${ }^{6}$. It has been developed by Inter-Agency Expert Group on Gender Statistics (IAE-GS) constituted by United Nations Statistics Division (UNSD).
23. What is the purpose of Minimum Set of Gender Indicators?
Ans: The purpose of minimum set of gender indicators is to develop a common statistical measurement framework that could be used for national production and international compilation of gender statistics and to track progress across countries and regions.
24. How many themes are covered under Minimum Set of Gender Indicators?
Ans: Minimum Set of Gender Indicators are organized into five themes: Economic Empowerment (18 indicators); Education (11 indicators); Health and related services (11 indicators); Public life and decision-making (6 indicators); and Human rights of women and girl children ( 5 indicators). Each domain addresses one or more critical areas of concern of the Beijing Platform for Action, and is aligned with the Sustainable Development Goals (SDGs) Indicator framework.
Out of these 51indicators, 30 are included in Women \& Men in India, 2022; the mapping of which may be seen in the publication.
25. How are gender data and indicators used for monitoring of SDG?
Ans: SDGs are the blueprint for achieving a better and sustainable future for all. The United Nations General Assembly during its $70^{\text {th }}$ Session, on $25^{\text {th }}$ September 2015, with the aim of taking forward the success of Millennium Development Goals, adopted the document titled “Transforming our World: The 2030 Agenda for Sustainable Development” consisting of 17 Sustainable Development Goals and associated 169 targets. To measure progress towards these targets, internationally agreed indicators are used.
The SDGs include a goal on ‘Gender Equality and Empowerment of all Women and Girls (Goal 5)’. There are 9 targets under SDG 5 to monitor gender equality and ensure empowerment of women and girls. However, gender-related issues cut across all SDGs. Similarly, gender indicators are sprinkled across the SDG indicator framework.
The UN Women, the United Nations premiere entity working for gender equality and the empowerment of women, has indicated that there are 54 gender-specific indicators across the SDG framework and around over one quarter of these are found in SDG 5. The complete description of these indicators and mapping of partially or completely matching with National Indicator Framework (NIF) of SDG is given in the publication “Women and Men in India 2022”.
1. What are the functions of Policy Implementation and Monitoring Division (PIMD) of MoSPI?
Ans: The PIMD has been notified, as one of the Divisions of the MoSPI, in January, 2021. The Division has been bestowed with inter alia overseeing the implementation of various components of the proposed National Policy on Official Statistics through functional Divisions of NSO/Ministries, wherever applicable.
2. What are the other activities PIMD undertaking?
Ans: PIMD is actively coordinating within and amongst Ministries/Departments to improve its Data Governance Quality Index (DGQI) score anchored by NITI Aayog. The aim is to reach frontier score of 5. Besides, PIMD also co-ordinates with other Divisions of the MoSPI for providing inputs for ensuring timely data updation for Global Indices.
3. What are Administrative Data?
Ans: Administrative data are the data sets collected by government institutions or agencies for tax, benefit or public administration purposes and are collected/recorded during the course of some operation, and then retained in a database.
4. What are various types of administrative data?
Ans: Health /education records, Registration systems for persons /businesses/ property/vehicles, Identity cards/passports/driving licenses, Electoral registers, register of farms, Local council registers, Building permits, Licensing systems e.g. television, sale of restricted goods, Published business accounts, Internal accounting data held by businesses, Private businesses with data holdings, Credit agencies are some of the examples of administrative data sets.
5. What are the advantages of administrative data?
Ans: It is High quality data, since the effectiveness of the operation of the organization depends on this. In a real sense administrative data often tell us what people are and what they do, not what they say they are and what they claim to do. We might thus argue that such data get us closer to social reality than do survey data. Administrative data may provide tighter definitions than alternative sources of data.
- What are the benefits of integrating administrative data sources into statistical production process?
Ans:
- Reduced cost
- Reduced response burden
- Improved data coverage and availability
- Enables compilation of disaggregated statistics – Often, the results of sample surveys pertaining to population sub-groups cannot be presented due to unacceptably large sampling error.
- Improve the quality and efficiency across the entire statistical production system.
- What is Metadata?
Ans: Metadata is data about data, more precisely it describes data containing specific information like type, length, textual description and other characteristics. Metadata should contain all the information users need to analyse a dataset and draw conclusions.
8. Why is Metadata important?
Ans:
- To Protect Resources and their future accessibility.
- For archiving and preservation purposes, it takes metadata elements that track the object’s lineage, and describe its physical characteristics and behaviour so it can be replicated on technologies in the future.
- Makes it easier to find relevant data and to use a dataset, users need to understand how the data is structured, definitions of terms used, how it was collected, and how it should be read.
- What are the scores of the MoSPI on Data Governance Quality Index (DGQI) of NITI Aayog?
Ans: The score of MoSPI in Data Governance Quality Index of NITI Aayog improved significantly from 2.51 in 2020-21 to 3.84 in Q2 of 2021-22; it further improved to 4.08 in Q4 of 2021-22 and 4.27 in Q 3 of 2022-23. Amongst strategic Ministries in which MoSPI is placed, it occupies second position.