The National Statistics Office (NSO) conducted a forward-looking survey on private corporate sector capital expenditure (CAPEX) investment intentions between November 2024 and January 2025, revealing key insights into investment patterns. The survey, which focused on large private sector companies, collected data on capital expenditures from private corporate sector enterprises, analyzing trends from the past three years and projections for current and next year. Manufacturing, information and communication, and transportation sectors are expected to attract the highest investment. The survey also examines the investment strategies and main objectives for making CAPEX. NSO’s survey achieved a 58.3% response rate, utilized a dedicated web portal and chatbot assistance.
SOURCE PDF LINK :
Click to access CAPEX_booklet_29042025.pdf
Click to view full document content

निजी क्षेत्र के कैपेक्स निवेश लक्ष्यों पर दूरदर्शी सर्वेक्षण के निष्कर्षो पर पुस्लिका
DORKEET ON THE FIRDINGS OF THE FORMARD-LOOKING SURVEY ON PRIVATE SECTOR GAPEL INVESTMENT INTENTIONS
सर्वेक्षण अवधि: नवंबर 2024 – जनवरी 2025 SURVEY PERIOD: MOVEMBER 2024 – JANUARY 2025)

भारत सरकार
Government of India
सांख्यिकी और कार्यक्रम कार्यान्वयन मंत्रालय
Ministry of Statistics and Programme Implementation
राष्ट्रीय सांख्यिकी कार्यालय
National Statistics Office

निजी क्षेत्र के कैपेक्स निवेश लक्ष्यो पर द्रदर्शी सर्वेक्षण के
निष्कर्षो पर पुस्तिका
Booklet on the Findings of the
Forward-Looking Survey on Private Sector CAPEX Investment Intentions
(सर्वेक्षण अवधि: नवंबर 2024-जनवरी 2025)
(Survey period: November 2024 – January 2025)

भारत सरकार
Government of India
सांख्यिकी और कार्यक्रम कार्यान्वयन मंत्रालय
Ministry of Statistics and Programme Implementation
राष्ट्रीय सांख्यिकी कार्यालय
National Statistics Office
प्रस्तावना

राष्ट्रीय सांखियकी कार्यालय (एन.एस.ओ.) ने नवंबर 2024 से जनवरी 2025 तक निजी कॉर्पोरेट क्षेत्र के कैपेक्स निवेश लक्ष्यों पर अपना पहला दुरदर्शी सर्वेक्षण संचालित किया। सर्वेक्षण के निष्कर्षो को एक पुस्तिका के रूप में जारी किया जा रहा है ।
एन.एस.ओ. के घरेलू सर्वेक्षण प्रभाग के द्वारा सर्वेक्षण उपकरणों को विकसित करने की जिम्मेदारी थी जबकि उद्यम सर्वेक्षण प्रभाग ने उद्यमों द्वारा स्व-संकलन को सुलभ बनाने हेतु उन्नत विशेषताओं युक्त सॉफ्टवेयर विकास करने के साथ ही साथ आंकड़ा विधायन, सारणीकरण और रिपोर्ट तैयार करने के कार्य को संभाला। क्षेत्र संकार्य प्रभाग ने उद्यमों को नोटिस जारी किए और समय पर आंकड़ा प्रस्तुत करने के लिए उद्यमों के साथ समन्वय किया। समन्वय एवं गुणवत्ता नियंत्रण प्रभाग ने सर्वेक्षण से संबंधित विभिन्न कार्यकलापों का समन्वय किया। उपरोक्त सभी का जीवंत समन्वय इस पुस्तिका का सार है ।
मैं कोंरपोरेट कार्य मंत्रालय की आभारी हूँ जिन्होंने उद्यमों का प्रतिचयन फ्रेम तैयार करने के लिए महत्वपूर्ण जानकारी प्रदान की। सर्वेक्षण की योजना और अभिकल्प में उनके महत्वपूर्ण योगदान के लिए आर्थिक कार्य विभाग, भारतीय रिज़र्व बैंक और राष्ट्रीय लेखा प्रभाग, एन.एस.ओ., सांखियकी एवं कार्यक्रम कार्यान्वयन मंत्रालय का भी आभार व्यक्त करती हूँ। मैं सर्वेक्षण के सभी चरणों में उनके मूल्यवान मार्गदर्शन के लिए तकनीकी सलाहकार समूह, राष्ट्रीय प्रतिदर्श सर्वेक्षण की परिचालन समिति और राष्ट्रीय सांखियकी आयोग के सदस्यों का हार्दिक धन्यवाद करती हूँ।
इस सर्वेक्षण का प्रारंभिक चरण एकयोगिक चरण के रूप में माना जा सकता है,प्रश्नावली, कार्य प्रणाली, आकलन प्रक्रियाओं और समय क्रियान्वयन को परिष्कृत करने के लिए अहमूभ्रतर्दृष्टि प्रदान करता है । इससे प्राप्त अनुभव सर्वेक्षण प्रक्रिया के विभिन्न पहलुओं में आवश्यक समायोजन के पश्चात् भविष्य के सर्वेक्षणों में सुधार हेतु मार्गदर्शन करेंगे ।
मैं इस सर्वेक्षण के लिए डेटा उपलब्ध कराने वाले सभी उद्यमों के प्रति अपना हृदयगत आभार व्यक्त करती हूँ। मुझे आशा है कि यह पुस्तिका योजनाकारों, नीति निर्माताओं, शिक्षाविदों और शोधकर्ताओं के लिए उपयोगी साबित होगी। इसकी विषय-वस्तु और कवरेज में सुधार हेतु सुझावों का स्वागत है ।

नई दिल्ली
शौता सिंह राठौर
अर्पेल, 2025
महानिदेश (एन.एस.एस.)

National Statistics Office (NSO) conducted its first Forward-Looking Survey on Private Corporate Sector Capex Investment Intentions from November 2024 to January 2025. The findings of the survey have been brought out in the form of a booklet.
The Household Survey Division (HSD) of NSO was responsible for developing survey instruments, while the Enterprise Survey Division (EnSD) handled software development with enhanced features to facilitate self-compilation by enterprises, as well as data processing, tabulation, and report preparation. Field Operations Division (FOD) issued notices to the enterprises and coordinated with the enterprises for timely submission of data. The Coordination and Quality Control Division (CQCD) coordinated various activities pertaining to the survey. The vibrant sync of the aforesaid sums up this booklet.
I thank the Ministry of Corporate Affairs (MCA) for providing crucial data for the sampling frame, and acknowledge the contributions of the Department of Economic Affairs (DEA), Reserve Bank of India (RBI), and the National Accounts Division, NSO, MoSPI in survey planning and design. I also express profound gratitude towards the members of Technical Advisory Group, Steering Committee for NSS and National Statistical Commission (NSC) for their valuable guidance throughout all stages of survey.
This initial round of the survey can be considered as an experimental phase, providing valuable insights to refine the questionnaire, methodology, estimation processes, and overall implementation. The lessons learned will guide improvements for future surveys, with necessary adjustments to various aspects of the survey process.
I record my sincere appreciation for all the enterprises that provided data for this survey. I hope this booklet will be useful to the planners, policy makers, academics and researchers. Suggestions for improvement of its content and coverage are most welcome.
New Delhi
April, 2025

Geeta Singh Rathore
Director General (NSS)
कैपेक्स सर्वेक्षण के महत्वपूर्ण निष्कर्ष
निजी क्षेत्र के CAPEX निवेश लक्ष्यों पर दुरदर्शी सर्वेक्षण पिछले तीन वर्षो (2021-22, 2022-23 और 2023-24) के रुझ़ानों और चालू वर्ष (2024-25) और अगले वर्ष (2025-26) के अनुमानों का विश्लेषण करते हुए निजी कॉर्पोरेट क्षेत्र के उद््यमों से पूंजीगत व्यय (CAPEX) पर डेटा एकत्र करता है।
सर्वेक्षित उद्यम 3,064 (संसस क्षेत्र -2,368 ओर सेम्पल क्षेत्र -696)
सभी पांच वर्षो के लिए कैपेक्स की सूचना देने वाले उद्यमों के गैर-भारित आंकड़ों के आधार पर सकल कैपेक्स (द करोड़ में)
| $2021-22$ | $2022-23$ | $2023-24$ | $2024-25$ | $2025-26$ |
|---|---|---|---|---|
| 394,681.5 | 572,199.7 | 422,183.3 | 656,492.7 | 488,865.5 |
सकल कैपेक्स पांच साल के संदर्भ अवधि (2021-22 से 2025-26) में $23.9 \%$ की दर से बढ़ा ।
| प्रति उद्यय अनुमानित सकल अचल संपति (GFA) | ||
|---|---|---|
| 2021-22 | 2022-23 | 2023-24 |
| ₹3,151.9 | ₹3,279.4 | ₹4,183.3 |
| करोड़ | करोड़ | करोड़ |
प्रति उद्यय अनुमानित पूंजीगत व्यय (र करोड़ो में )
अनुमानित पूंजीगत व्यय में उपचलन हिस्सेदारी वाले
श्रीर्ष तीन क्षेत्र (2024-25)
विनिर्माण
सूचना एवं संचार कार्यकलाप
$15.6 \%$
परिवहन और भण्डारण
2024-25 में पूंजीगत व्यय के लिए प्रस्तावित शीर्षस्थ सबसे विशिष्ट संपत्ति
मशीनरी एवं
उपकरण (53.1\%)
आवास, अन्य इमारते और संरचनाएं ( $9.7 \%$ )
अन्य अमूर्त
परिसंपत्तियां/बाँदधिक
संपदा उत्पाद (5.8\%)
2024-25 नें निवेश के उद्देश्यों के अनुसार उद्युयो का वितरण
आय सृजन
$49.6 \%$
उन्नयन
$30.1 \%$
अन्य
$16.2 \%$
विविधता
$2.8 \%$
$1.4 \%$
Important Findings of CAPEX Survey
The Forward-Looking Survey on Private Sector CAPEX Investment Intentions collects data on capital expenditures (CAPEX) from private corporate sector enterprises, analysing trends from the past three years (2021-22, 2022-23 \& 2023-24) and projections for current year (202425) and next year (2025-26).
Surveyed enterprises 3,064 (Census sector 2,368 \& Sample sector -696)
Aggregate CAPEX (in ₹ Crore) based on unweighted data of enterprises that reported CAPEX for all the five years
| $2021-22$ | $2022-23$ | $2023-24$ | $2024-25$ | $2025-26$ |
|---|---|---|---|---|
| 394,681.5 | 572,199.7 | 422,183.3 | 656,492.7 | 488,865.5 |
| {Aggregate CAPEX grew at a rate of $23.9 \%$ during the five years reference period (2021-22 to 2025-26).} |
||||
| Estimated Gross Fixed Asset (GFA) per enterprise |
||
|---|---|---|
| $\mathbf{2 0 2 1 – 2 2}$ | $\mathbf{2 0 2 2 – 2 3}$ | $\mathbf{2 0 2 3 – 2 4}$ |
| ₹3,151.9 | ₹3,279.4 | ₹4,183.3 |
| crore | crore | crore |
| Estimated Capital Expenditure per Enterprise (₹ Crores) |
|---|
| 200 |
| 150 |
| 100 |
| 50 |
| 0 |
| 2021-22 |
| Top three sectors with highest share in projected capital expenditure (2024-25) |
|---|
| Manufacturing |
| Information and Communication Activities |
| Transportation \& storage |
Top most distinct assets proposed for capital expenditure in 2024-25
Machinery and
Equipment
$(53.1 \%)$
Dwelling, other buildings and structures $(9.7 \%)$
other intangible assets / intellectual property products $(5.8 \%)$
Distribution of enterprises by main objectives of investment in 2024-25
Contents
| Section | Page No. |
|---|---|
| 1. Introduction | 1 |
| 2. Reference Period | 2 |
| 3. Survey Frame | 2 |
| 4. Sampling Methodology | 3 |
| 5. Methodology for Data Collection | 4 |
| 6. Estimation Procedure | 5 |
| 7. Key advantages of the Survey | 6 |
| 8. Experience and way-forward | 7 |
| 9. Note to the Users | 8 |
| 10. Summary of Findings | 10 |
| 10.1. Unweighted aggregate based on responses of enterprises that reported CAPEX for all the five years (2021-22 to 2025-26) | 11 |
| 10.2. Estimated (weighted) key indicators by Activity Categories and Asset Group | 19 |
| Annexures | |
| I. Enterprises allotted, surveyed, casualties and non-response | A-1 to A-5 |
| II. Concepts \& Definitions | B-1 to B-8 |
| III. Questionnaire of Survey | C-1 to C-15 |
| IV. List of NIC – 2008 included in the survey | D-1 to D-4 |
| V. Estimation Procedure | E-1 to E-4 |
1. Introduction
The Parliamentary Standing Committee on Finance has recommended conducting forward-looking surveys to gather data on private sector capital expenditure (CAPEX) intentions. In response, the Ministry of Statistics and Programme Implementation (MoSPI) designed survey instruments and appropriate methodology for a forward-looking survey on private sector CAPEX intentions in alignment with the specifications of the Department of Economic Affairs (DEA).
The National Statistics Office conducted its first-ever ForwardLooking Survey on Private Sector CAPEX Investment Intentions to gather data on capital expenditures (CAPEX) from private corporate sector enterprises. The data was collected over three months starting from November 2024 to January 2025. A fully online survey conducted on a dedicated web portal followed an enterprise approach to collect the requisite information through self-compilation from the respondents.
The survey covers CAPEX trends over the past three years (2021-22, 2022-23, 2023-24) and projections for the next two years (2024-25, 2025-26). These insights aim to support informed decision-making for industry, businesses, and government.
2. Reference Period
The survey gathered information on capital expenditure investment intentions of the private corporate sector, including both financial and non-financial, for the financial years 2024-25 and 2025-26. It also captured data on past capital investments made by enterprises over the last three years (2021-22, 2022-23, 2023-24).
3. Survey Frame
The survey focused exclusively on larger private corporate sector enterprises with substantial contributions in their respective sectors. The survey frame was derived from active enterprises listed in the Ministry of Corporate Affairs (MCA) database, meeting specific annual turnover criteria in at least one of the last three financial years. The qualifying thresholds were:
- $\quad$ Manufacturing Enterprises: ₹400 crore or more in annual turnover.
- $\quad$ Trade Enterprises: ₹300 crore or more in annual turnover.
- $\quad$ Other Enterprises: ₹100 crore or more in annual turnover.
The survey frame comprised of 16,025 enterprises.
4. Sampling Methodology
The eligible enterprises were first categorized into seventeen (17) strata based on their Principal Business Activity, as reported in the MGT-7 Form of the Ministry of Corporate Affairs (MCA). The selection process was as follows:
Stratum with 100 or fewer enterprises: all were included in the survey.
Strata with more than 100 Enterprises: These were further divided into two sectors:
Census Sector Enterprises
For identifying enterprises qualifying for complete enumeration, units were sorted into two separate lists:
(i) Descending order of the highest asset value recorded in the past three years
(ii) Descending order of asset value in the latest reported year
From these lists, the top enterprises accounting for $90 \%$ of total asset value (or $80 \%$ in the case of Construction and Trade) were selected as Census List 1 and Census List 2. An enterprise was classified under the Census Sector if it appeared in either list.
Sample Sector Enterprises
Enterprises not included in the Census Sector were classified as Sample Sector Enterprises. From this group, 10\% were randomly selected using Simple Random Sampling without Replacement (SRSWOR) for data collection in the survey. It is then allocated to different strata in proportion to the strata size and strata variation. The survey covered a total of 5,380 enterprises: 4,145 enterprises in the Census Sector and 1,235 enterprises in sample sector.
5. Methodology for Data Collection
The survey was conducted under the provisions of the Collection of Statistics Act, 2008. Notices were issued to all selected enterprises in advance explaining the objective of the survey and the purposes for which survey results will be used. Enterprises were assured of the confidentiality of their individual data, and that unit-level information will not be disseminated.
While disseminating the survey results, care has been taken not to release any information, which could identify the enterprise that has furnished it. While releasing the results, adequate measures are applied to prevent the publication or disclosure of any information deemed confidential. To protect the confidentiality of CAPEX investment plans
of individual enterprises, the Steering Committee of NSS Surveys recommended that unit-level data of CAPEX survey would not be disseminated.
A dedicated web portal featuring secure user authentication was developed for facilitating self-compilation and submission of the survey questionnaire by selected enterprises. The background of the survey and reason why a specific unit was selected for the survey were explained in the home page. Chat-bot assistance was provided to help respondents in understanding key concepts and definitions used in the survey.
6. Estimation Procedure
Estimated total of aggregates from the survey was calculated as the sum of Census sector aggregate and estimate of Sample Sector aggregate. For estimating the sample sector aggregates, the ratio of ‘total allotment of enterprises in the stratum’ to ‘actual number of surveyed enterprises in the stratum’ has been used as sample sector weights.
As the response rate in census sector was moderate (58.6\%), the census sector estimates were adjusted by calibrating the estimates using annual turnover (as available from the frame) as auxiliary variable as given below:
$\underset{\sum \text { Turnover of responding enterprises in the strata }}{\text { do }}$
Detailed estimation procedure is in Annexure-V.
7. Key advantages of the Survey
Capital expenditure (CAPEX) is a key driver of national investment, contributing significantly to the accumulation of physical assets within the economy. By facilitating the creation of long-term assets, CAPEX not only generates sustained revenue streams but also enhances the efficiency and productivity of economic operations. It plays a pivotal role in expanding production capacity and acts as a catalyst for accelerated economic growth, which in turn promotes job creation and boosts labour productivity.
Having access to comprehensive information on CAPEX will greatly benefit a diverse group of stakeholders including government agencies, private sector firms, industry associations, researchers, and other relevant organizations. Such information will support evidence-based policymaking by enabling the analysis of future investment trends. Moreover, a clear understanding of CAPEX patterns and magnitude will empower enterprises to make informed, strategic investment decisions, leveraging insights derived from the survey findings.
8. Experience and way-forward
Notices under Collection of Statistics Act, 2008 were sent to selected enterprises outlining the survey’s objectives and assuring confidentiality of the information provided. However, several enterprises expressed concerns regarding the authenticity of the notices, particularly due to the inclusion of portal login credentials, which raised apprehensions related to cyber security. Explaining the portal’s functionality and submission procedures over phone calls proved to be a significant challenge.
The data analysis highlighted several issues, including incorrect unit entries, e.g. reporting figures in Rupees instead of Rupees in thousands and a lack of response to follow-up queries. Enterprises also encountered difficulties in accurately selecting appropriate National Industrial Classification (NIC) codes and in projecting future investment figures, especially in the absence of official data sources.
While the response rate and results were generally promising, this initial round of the survey can be considered as an experimental phase, providing valuable insights to refine the questionnaire, methodology, estimation processes, and overall implementation. Looking ahead, greater emphasis will be placed on proactive engagement with participating enterprises prior to the survey. Efforts will be made to address concerns regarding the credibility of the online survey, provide guidance on interpreting the questionnaire, and ensure the confidentiality of individual responses.
To enrich the findings, future surveys will also incorporate qualitative inputs, such as explanations for year-on-year variations in investment, offering a more nuanced understanding of enterprise-level CAPEX intentions and trends.
9. Note to the Users
NSO’s first-ever initiative to engage the corporate sector through a selfreporting survey powered by a dedicated web portal and chatbot assistance also marks its inaugural effort to gather data on future investment intentions. While industry participation showed variability, the survey successfully achieved an overall response rate of $58.3 \%$ ( $58.6 \%$ in the census sector and $57.2 \%$ in the sample sector).
Out of the total 3,064 surveyed enterprises, 2,172 enterprises reported CAPEX intentions for 2025-26. The data suggests a measured approach by respondents in declaring capital expenditure plans, with some enterprises indicating that final figures were not yet available or pending management approval at the time of the survey.
It is important to note that certain enterprises, such as some Special Purpose Vehicles (SPVs) involved in activities like road construction, often make substantial capital investments but do not report any turnover. Consequently, although they belong to the corporate sector, these entities fall outside the scope of the survey. Conversely, SPVs
within the construction sector that are part of the survey frame may lack future investment intentions due to the completion of their projects.
It may be noted that all results presented in this booklet pertain to larger enterprises with turnover exceeding the specified thresholds under survey frame. Therefore, these results do not represent the entire private corporate sector, and users should consider these constraints while interpreting the result.
10. Summary of Findings
The findings of the survey are presented in two sections:
(i) Aggregated responses from 2,172 enterprises that reported investment intentions for both 2024-25 and 2025-26, along with data for the preceding three years-2021-22, 2022-23, and 2023-24 is presented in Table-1 of Section 10.1. No weights have been applied in this section for either the census or sample sectors. Rest of the tables in this section are also generated based on sample counts (i.e. without use of weights).
(ii) Section-10.2 provides estimates of key indicators derived from the survey data, with results presented separately for each activity category and asset group. Estimated per-enterprise figures are provided for the years 2021-22 through 2024-25. The methodology used for estimation in this section is detailed in Annexure-V.
10.1 Unweighted aggregate based on responses of enterprises that reported CAPEX for all the five years (2021-22 to 2025-26)
This section presents aggregated CAPEX figures by activity category, based on data submitted by a panel of enterprises that consistently reported for all five reference years (2021-22 to 2025-26). The figures represent aggregates as reported by the enterprises under different asset categories, without the application of any estimation weights. Based on the data presented in Table-1, aggregate CAPEX shows an overall increase of $23.9 \%$ over the five-year period (2021-22 to 2025-26).
Table 1: Aggregate value ${ }^{1}$ (in ₹ Crore) of Capital Expenditure during 2021-22 to 2025-26
| activity description | aggregate value (in ₹ Crore) | no. of enterprises | ||||
|---|---|---|---|---|---|---|
| actual capital expenditure in 2021-22 | actual capital expenditure in 2022-23 | actual capital expenditure in 2023-24 | intended CAPEX to purchase of new assets in 2024-25 | intended CAPEX to purchase of new assets in 2025-26 | ||
| agriculture, forestry, and fishing | $1,257.7$ | $1,534.3$ | $1,569.3$ | $4,394.7$ | $1,433.0$ | 46 |
| mining and quarrying | $5,388.7$ | $5,501.0$ | $6,590.9$ | $12,494.9$ | $13,933.4$ | 31 |
| manufacturing | $128,912.1$ | $130,733.5$ | $125,360.0$ | $150,385.1$ | $210,859.6$ | 588 |
| electricity, gas, steam, air conditioning supply | $5,839.5$ | $8,914.0$ | $8,414.1$ | $11,856.2$ | $16,265.8$ | 37 |
| water supply, sewerage, waste management and remediation activities | 467.7 | 739.7 | 882.4 | 375.2 | 573.4 | 26 |
| construction | $12,356.4$ | $16,733.2$ | $17,992.9$ | $9,681.5$ | $20,454.9$ | 164 |
| wholesale and retail trade and repair of motor vehicles and motorcycles | $20,001.5$ | $24,661.9$ | $21,508.5$ | $46,016.8$ | $19,055.7$ | 193 |
| transportation and storage | $10,864.1$ | $13,253.5$ | $19,600.0$ | $135,659.8$ | $23,478.0$ | 116 |
| accommodation and Food service activities | $1,354.9$ | $2,731.9$ | $2,815.1$ | $2,445.0$ | $3,036.4$ | 35 |
Table 1: Aggregate value ${ }^{1}$ (in ₹ Crore) of Capital Expenditure during 2021-22 to 2025-26
| activity description | aggregate value (in ₹ Crore) | no. of enterprises | ||||
|---|---|---|---|---|---|---|
| actual capital expenditure in 2021-22 | actual capital expenditure in 2022-23 | actual capital expenditure in 2023-24 | intended CAPEX to purchase of new assets in 2024-25 | intended CAPEX to purchase of new assets in 2025-26 | ||
| information and communication | 128,214.0 | 212,180.3 | 105,208.3 | 153,739.5 | 109,631.8 | 258 |
| financial and insurance activities | 3,966.7 | 9,511.6 | 7,267.7 | 8,517.4 | 8,095.1 | 188 |
| real estate activities | 12,326.9 | 15,548.4 | 18,017.8 | 31,927.1 | 18,251.4 | 128 |
| professional, scientific, and technical activities | 15,540.9 | 27,151.1 | 18,837.0 | 18,435.9 | 17,244.9 | 118 |
| administrative and support service activities | 14,351.1 | 53,840.7 | 4,747.3 | 5,179.0 | 5,485.9 | 46 |
| education | 1,731.3 | 2,095.2 | 1,123.3 | 840.3 | 1,472.1 | 37 |
| human health, and social work activities | 27,011.4 | 30,771.6 | 43,849.6 | 16,622.1 | 17,088.6 | 100 |
| arts, entertainment and recreation, other service activities n.e.c. | 5,096.5 | 16,297.6 | 18,399.1 | 47,922.3 | 2,505.6 | 61 |
| all | 394,681.5 | 572,199.7 | 422,183.3 | 656,492.7 | 488,865.5 | 2172 |
10.1.1 Percentage of enterprises intending to incur capital expenditure in 2024-25 \& 2025-26, categorized by sector/industry receiving the investment
According to the survey, enterprises were asked to specify the sector/ industry where their provisional CAPEX for 2024-25 and proposed CAPEX for 2025-26 is allocated, along with percentage share for each.
The key sectors projected to attract the highest capital expenditure (CAPEX) from the private corporate sector in 2024-25 and 2025-26 include manufacturing, which will account for nearly $29 \%$ of enterprises. This is followed by information and communication at around $14 \%$, wholesale and retail trade (including motor vehicle and motorcycle repair) at approximately $9 \%$, and construction, which is projected to receive capital investment from about $10 \%$ of the enterprises.
It may be noted that the percentages presented in Table-2 are calculated based on sample counts.
Table 2: Percentage of enterprises which intended to incur capital expenditure in 2024-25 and 2025-26 by range of expenditure (in \%) for each sector/ industry receiving the investment ${ }^{2}$
| activity description ${ }^{3}$ | 2024-25 | 2025-26 | ||||||||
|---|---|---|---|---|---|---|---|---|---|---|
| $\begin{gathered} 0- \ 20 \% \end{gathered}$ | $\begin{gathered} 20 \%- \ 50 \% \end{gathered}$ | $\begin{gathered} 50 \%- \ 80 \% \end{gathered}$ | $\begin{gathered} 80 \%- \ 100 \% \end{gathered}$ | all | $\begin{gathered} 0- \ 20 \% \end{gathered}$ | $\begin{gathered} 20 \%- \ 50 \% \end{gathered}$ | $\begin{gathered} 50 \%- \ 80 \% \end{gathered}$ | $\begin{gathered} 80 \%- \ 100 \% \end{gathered}$ | all | |
| agriculture, forestry, and fishing | 0.04 | 0.18 | 0.00 | 2.07 | 2.28 | 0.09 | 0.05 | 0.05 | 2.12 | 2.30 |
| mining and quarrying | 0.25 | 0.18 | 0.15 | 1.27 | 1.85 | 0.09 | 0.18 | 0.14 | 1.29 | 1.70 |
| manufacturing | 0.58 | 0.80 | 1.38 | 26.29 | 29.04 | 0.69 | 0.97 | 1.29 | 26.24 | 29.19 |
| electricity, gas, steam, air conditioning supply | 0.76 | 0.18 | 0.15 | 1.99 | 3.08 | 0.83 | 0.14 | 0.05 | 1.61 | 2.62 |
| water supply, sewerage, waste management and remediation activities | 0.33 | 0.22 | 0.04 | 1.31 | 1.89 | 0.28 | 0.14 | 0.14 | 1.10 | 1.66 |
| construction | 1.16 | 0.76 | 0.65 | 7.07 | 9.64 | 1.24 | 1.01 | 0.60 | 7.18 | 10.04 |
| wholesale and retail trade and repair of motor vehicles and motorcycles | 0.44 | 0.36 | 0.18 | 7.87 | 8.85 | 0.60 | 0.28 | 0.14 | 7.55 | 8.56 |
| transportation and storage | 0.69 | 0.11 | 0.18 | 5.47 | 6.45 | 0.51 | 0.14 | 0.18 | 5.11 | 5.94 |
| accommodation and Food service activities | 0.25 | 0.29 | 0.00 | 1.45 | 1.99 | 0.28 | 0.14 | 0.00 | 1.70 | 2.12 |
Table 2: Percentage of enterprises which intended to incur capital expenditure in 2024-25 and 2025-26 by range of expenditure (in \%) for each sector/ industry receiving the investment ${ }^{2}$
| activity description ${ }^{3}$ | 2024-25 | 2025-26 | ||||||||
|---|---|---|---|---|---|---|---|---|---|---|
| $\begin{gathered} 0- \ 20 \% \end{gathered}$ | $\begin{gathered} 20 \%- \ 50 \% \end{gathered}$ | $\begin{gathered} 50 \%- \ 80 \% \end{gathered}$ | $\begin{gathered} 80 \%- \ 100 \% \end{gathered}$ | all | $\begin{gathered} 0- \ 20 \% \end{gathered}$ | $\begin{gathered} 20 \%- \ 50 \% \end{gathered}$ | $\begin{gathered} 50 \%- \ 80 \% \end{gathered}$ | $\begin{gathered} 80 \%- \ 100 \% \end{gathered}$ | all | |
| information and communication | 1.23 | 0.73 | 0.33 | 11.35 | 13.63 | 1.10 | 0.46 | 0.60 | 11.88 | 14.04 |
| financial and insurance activities | 0.25 | 0.07 | 0.15 | 7.43 | 7.90 | 0.14 | 0.14 | 0.18 | 7.50 | 7.97 |
| real estate activities | 0.29 | 0.47 | 0.25 | 6.06 | 7.07 | 0.28 | 0.51 | 0.23 | 5.39 | 6.40 |
| professional, scientific, and technical activities | 0.47 | 0.36 | 0.18 | 4.82 | 5.84 | 0.64 | 0.37 | 0.23 | 4.93 | 6.17 |
| administrative and support service activities | 0.36 | 0.18 | 0.04 | 1.96 | 2.54 | 0.28 | 0.23 | 0.05 | 2.03 | 2.58 |
| education | 0.00 | 0.04 | 0.11 | 1.49 | 1.63 | 0.05 | 0.00 | 0.18 | 1.52 | 1.75 |
| human health, and social work activities | 0.22 | 0.04 | 0.04 | 4.02 | 4.31 | 0.18 | 0.05 | 0.00 | 4.60 | 4.83 |
| arts, entertainment and recreation, other service activities n.e.c. | 0.36 | 0.33 | 0.07 | 3.12 | 3.88 | 0.32 | 0.23 | 0.05 | 3.08 | 3.68 |
10.1.2 Percentage distribution of enterprises which have not reported capital expenditure in 2025-26 by reasons of not reporting for each principal/ main activity category
The over-all non-response in the survey with regard to furnishing information on the intended capital expenditure for the year 2025-26 was $29 \%{ }^{4}$. Whenever an enterprise is not reporting the intended capital expenditure for the year 2025-26, there was a provision to report the reason for the same (Table 3)
According to the survey $43.2 \%{ }^{5}$ of the enterprises that have not reported capital expenditure for the year 2025-26 are because no capital expenditure is intended to be incurred during the period (i.e. zero capital expenditure for 2025-26 is proposed at the time of reporting).
The remaining enterprises, which did not report a figure against the year are expected to make some capital expenditure for 2025-26 but the proposed figure was not available at the time of reporting. However, around $20.2 \%$ indicated that the capital expenditure for 2025-26 expected to be at the same level as 2024-25. Another $32.5 \%$ planned to have more CAPEX in 2025-26 than the previous year. And the remaining $4.1 \%$ planned to have a lower CAPEX than 2024-25.
Table 3: Percentage distribution of enterprises who have not reported capital expenditure in 2025-26 by reasons for each principal/ main activity category
| activity description | zero capital expendi ture | figures are not available but plans are for | all | ||
|---|---|---|---|---|---|
| no change in capital expenditure | increase in capital expendi -ture | decrease in capital expendi -ture | |||
| agriculture, forestry, and fishing | 36.84 | 26.32 | 36.84 | 0.00 | 100 |
| mining and quarrying | 66.67 | 0.00 | 33.33 | 0.00 | 100 |
| manufacturing | 25.93 | 20.11 | 51.32 | 2.65 | 100 |
| electricity, gas, steam, air conditioning supply | 65.31 | 22.45 | 12.24 | 0.00 | 100 |
| water supply, sewerage, waste management and remediation activities | 35.00 | 15.00 | 50.00 | 0.00 | 100 |
| construction | 66.10 | 15.25 | 14.41 | 4.24 | 100 |
| wholesale and retail trade and repair of motor vehicles and motorcycles | 46.39 | 18.56 | 30.93 | 4.12 | 100 |
| transportation and storage | 38.98 | 22.03 | 33.90 | 5.08 | 100 |
| accommodation and Food service activities | 40.00 | 10.00 | 50.00 | 0.00 | 100 |
| information and communication | 29.17 | 26.39 | 37.50 | 6.94 | 100 |
| financial and insurance activities | 55.00 | 18.75 | 20.00 | 6.25 | 100 |
| real estate activities | 54.79 | 23.29 | 17.81 | 4.11 | 100 |
| professional, scientific, and technical activities | 27.59 | 34.48 | 31.03 | 6.90 | 100 |
| administrative and support service activities | 47.62 | 14.29 | 23.81 | 14.29 | 100 |
| education | 10.00 | 30.00 | 60.00 | 0.00 | 100 |
| human health, and social work activities | 8.33 | 0.00 | 75.00 | 16.67 | 100 |
| arts, entertainment and recreation, other service activities n.e.c. | 34.48 | 27.59 | 37.93 | 0.00 | 100 |
| all | 43.16 | 20.24 | 32.48 | 4.12 | 100 |
10.2 Estimated (weighted) key indicators by Activity Categories and Asset Group
This section presents estimates of key indicators derived from the survey data, disaggregated by activity category and asset group. Estimated per-enterprise figures are provided for the years 202122 to 2024-25. The weights derived through the estimation procedure (Annexure-V) have been used in all the results presented in Section 10.2.
10.2.1 Estimated Gross Fixed Assets per enterprise
Average Gross fixed asset ${ }^{6}$ (GFA) per enterprise in private corporate sector was estimated to be ₹3,151.9 crore in 2021-22. Average GFA per enterprise grew by $4.0 \%$ to reach ₹3,279.4 crore in 2022-23 and thereafter by $27.6 \%$ to reach ₹4,183.3 crore in 2023-24 (Table 4).
GFA per enterprise was highest (more than ₹14,000 crore) for the activity category ‘electricity, gas, steam, air conditioning supply’ followed by ‘manufacturing’ (between ₹7,000 to ₹10,000 crore) and ‘transportation \& storage’ (between ₹2,000 to ₹5,000 crore).
Enterprises principally engaged in manufacturing accounted for more than two-third of the total Gross fixed asset ${ }^{7}$ in private corporate sector over the past three years from 2021-22 to 202324.
Electricity, gas, steam, air conditioning supply ( $8 \%$ to $10 \%$ of the total share of GFA), information \& communication ( $8 \%$ to $10 \%$ of the total share of GFA) and transportation \& storage ( $5 \%$ to $8 \%$ of the total share of GFA) were the other sectors that reported next highest gross fixed capital in the past three years.
Figure 1: Percentage distribution of Gross Fixed Assets (GFA) by activity category
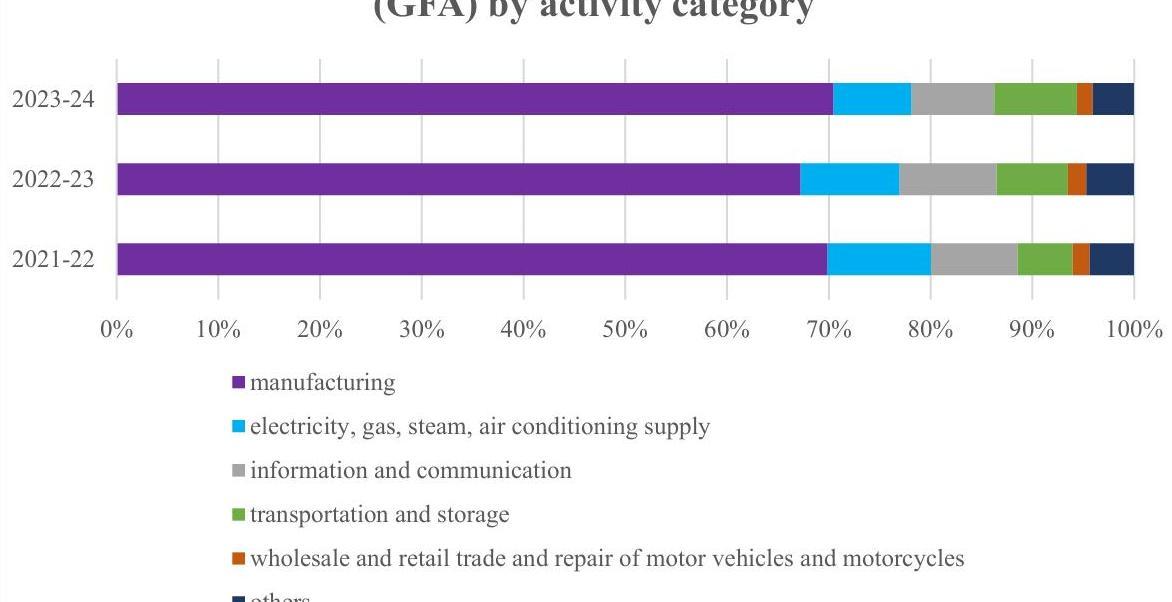
Table 4: Estimated Gross fixed asset per enterprise ( $\frac{1}{2}$ crore) and percentage distribution of gross fixed asset by activity category
| activity description | 2021-22 | 2022-23 | 2023-24 | |||
|---|---|---|---|---|---|---|
| GFA per enter -prise | $\begin{gathered} \% \ \text { distribu } \ \text { tion } \end{gathered}$ | GFA per enter -prise | $\begin{gathered} \% \ \text { distrib } \ \text { ution } \end{gathered}$ | GFA per enter -prise | $\begin{gathered} \% \ \text { distrib } \ \text { ution } \end{gathered}$ | |
| agriculture, forestry, and fishing | 1,098.7 | 0.39 | 1,155.8 | 0.39 | 1,181.2 | 0.31 |
| mining and quarrying | 817.0 | 0.24 | 930.9 | 0.26 | 1,039.7 | 0.23 |
| manufacturing | 7,422.0 | 69.88 | 7,473.1 | 67.23 | 9,966.5 | 70.46 |
| electricity, gas, steam, air conditioning supply | 14,429.4 | 10.14 | 14,540.7 | 9.73 | 14,652.1 | 7.68 |
| water supply, sewerage, waste management and remediation activities | 109.3 | 0.02 | 124.9 | 0.03 | 144.1 | 0.02 |
| construction | 242.2 | 0.92 | 273.4 | 1.01 | 350.3 | 1.02 |
| wholesale and retail trade and repair of motor vehicles and motorcycles | 388.9 | 1.68 | 429.6 | 1.8 | 472.0 | 1.54 |
| transportation and storage | 2,489.2 | 5.42 | 3,327.9 | 7.01 | 4,923.4 | 8.12 |
| accommodation and Food service activities | 407.7 | 0.14 | 432.1 | 0.14 | 461.9 | 0.12 |
| information and communication | 2,431.5 | 8.52 | 2,858.7 | 9.53 | 3,108.8 | 8.12 |
| financial and insurance activities | 52.1 | 0.12 | 59.1 | 0.13 | 70.3 | 0.12 |
| real estate activities | 616.5 | 0.47 | 675.5 | 0.49 | 730.5 | 0.42 |
| professional, scientific, and technical activities | 1,466.3 | 0.72 | 1,475.0 | 0.75 | 1,500.2 | 0.59 |
| administrative and support service activities | 215.4 | 0.31 | 294.1 | 0.41 | 294.8 | 0.32 |
| education | 134.2 | 0.03 | 168.7 | 0.03 | 214.9 | 0.03 |
| human health, and social work activities | 1,205.2 | 0.73 | 1,357.1 | 0.79 | 1,466.1 | 0.66 |
| arts, entertainment and recreation, other service activities n.e.c. | 355.9 | 0.26 | 395.1 | 0.27 | 418.4 | 0.23 |
| all | 3,151.9 | 100 | 3,279.4 | 100 | 4,183.3 | 100 |
Sample size: 3032 (2021-22), 3057 (2022-23), 3062 (2023-24)
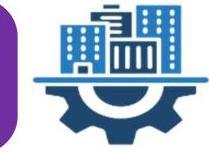
10.2.2 Estimated value of proposed and actual capital expenditure per enterprise in 2021-22 to 2023-24
The survey collected information on proposed capital expenditure and actual capital expenditure incurred by the enterprises for each of the past three financial years.
During the year 2021-22, the proposed capital expenditure per enterprise in the private corporate sector was ₹102.7 crore, however actually incurred was more than that (₹109.3 crore). The realization ratio was $111.9 \%$ against the proposed capital expenditure of ₹133.0 crore per enterprise in 2022-23 and $99.7 \%$ against the proposed capital expenditure per enterprise of ₹107.9 crore in 2023-24 (Table 5).
The actual capital expenditure per enterprise increased to ₹148.8 crore in 2022-23 from ₹109.3 crore in 2021-22 and thereafter decreased to ₹107.6 crore in 2023-24.
Among the activity categories, enterprises primarily engaged in ‘electricity, gas, steam, air conditioning supply’ had the lowest capital expenditure realization, hovers around $72 \%-79 \%$ over the past three years. However, their proposed capital expenditure was higher across all three years (between ₹230 to ₹272 crore).
Table 5: Estimated value of proposed \& actual capital expenditure per enterprise ( $\boldsymbol{\ell}$ crore) for each principal/ main activity category
| activity description | 2021-22 | 2022-23 | 2023-24 | ||||||
|---|---|---|---|---|---|---|---|---|---|
| propos ed | actual | RR (\%) | propo sed | actual | RR (\%) | propo sed | actual | RR (\%) | |
| agriculture, forestry, and fishing | 19.0 | 25.5 | 134.33 | 24.4 | 33.1 | 135.51 | 26.0 | 37.2 | 143.47 |
| mining and quarrying | 127.9 | 136.2 | 106.51 | 131.1 | 145.2 | 110.75 | 147.3 | 160.1 | 108.71 |
| manufacturing | 164.4 | 171.5 | 104.32 | 118.9 | 131.9 | 110.93 | 141.3 | 125.2 | 88.59 |
| electricity, gas, steam, air conditioning supply | 271.5 | 197.4 | 72.73 | 229.5 | 180.3 | 78.55 | 249.8 | 178.8 | 71.56 |
| water supply, sewerage, waste management and remediation activities | 24.1 | 21.6 | 89.83 | 19.9 | 20.0 | 100.27 | 22.1 | 22.2 | 100.51 |
| construction | 47.9 | 40.2 | 83.79 | 68.4 | 66.4 | 97.07 | 85.8 | 85.4 | 99.48 |
| wholesale and retail trade and repair of motor vehicles and motorcycles | 57.1 | 62.7 | 109.91 | 60.6 | 68.9 | 113.73 | 44.2 | 53.3 | 120.51 |
| transportation and storage | 147.0 | 157.9 | 107.41 | 143.8 | 169.3 | 117.76 | 142.6 | 152.9 | 107.24 |
| accommodation and Food service activities | 12.6 | 18.6 | 148.47 | 28.5 | 40.9 | 143.47 | 32.0 | 37.7 | 118.03 |
| information and communication | 115.9 | 161.6 | 139.47 | 429.3 | 510.6 | 118.93 | 166.4 | 201.8 | 121.28 |
| financial and insurance activities | 9.1 | 10.7 | 117.94 | 17.3 | 20.8 | 120.19 | 17.5 | 19.2 | 109.18 |
Table 5: Estimated value of proposed \& actual capital expenditure per enterprise ( $\boldsymbol{\ell}$ crore) for each principal/ main activity category
| activity description | 2021-22 | 2022-23 | 2023-24 | ||||||
|---|---|---|---|---|---|---|---|---|---|
| propos ed | actual | RR (\%) | propo sed | actual | RR (\%) | propo sed | actual | RR (\%) | |
| real estate activities | 68.4 | 77.8 | 113.87 | 87.5 | 89.6 | 102.45 | 95.5 | 97.6 | 102.21 |
| professional, scientific, and technical activities | 106.3 | 112.5 | 105.89 | 166.0 | 172.3 | 103.81 | 116.0 | 126.1 | 108.7 |
| administrative and support service activities | 41.2 | 35.9 | 87.12 | 117.0 | 131.6 | 112.53 | 18.0 | 12.7 | 70.56 |
| education | 38.4 | 33.6 | 87.35 | 47.8 | 42.0 | 87.88 | 30.6 | 26.2 | 85.63 |
| human health, and social work activities | 160.8 | 164.3 | 102.18 | 184.8 | 189.1 | 102.32 | 271.5 | 265.6 | 97.81 |
| arts, entertainment and recreation, other service activities n.e.c. | 27.2 | 29.6 | 108.73 | 97.9 | 99.1 | 101.22 | 103.9 | 104.5 | 100.61 |
| all | 102.7 | 109.3 | 106.41 | 133.0 | 148.8 | 111.89 | 107.9 | 107.6 | 99.73 |
- RR: – Realisation Ratio
10.2.3 Provisional capital expenditure incurred or intended to be incurred per enterprise to purchase new asset, second hand asset, improvement of existing asset and receipt from intended sale of assets in 2024-25
For each Activity Category
Along with the information on actual capital expenditure incurred during the past three years, the survey also collected information on the provisional figures for capital expenditure incurred or intended to be incurred for purchasing new assets during the current year (2024-25). However, the non-response, attributed to different reasons, for provisional/intended capital expenditure was nearly $10 \%{ }^{8}$ for the year 2024-25. The estimates presented under this section need to be taken with caution in the context of higher non-response rates.
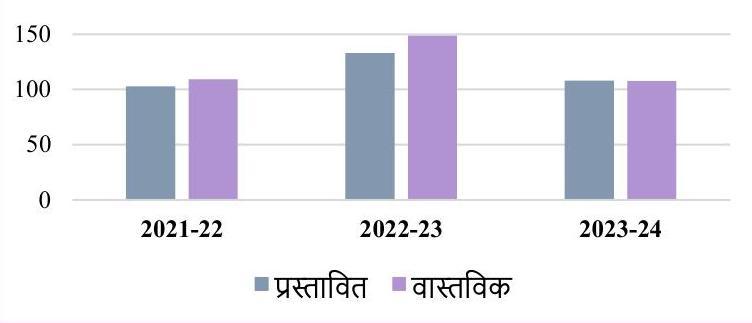
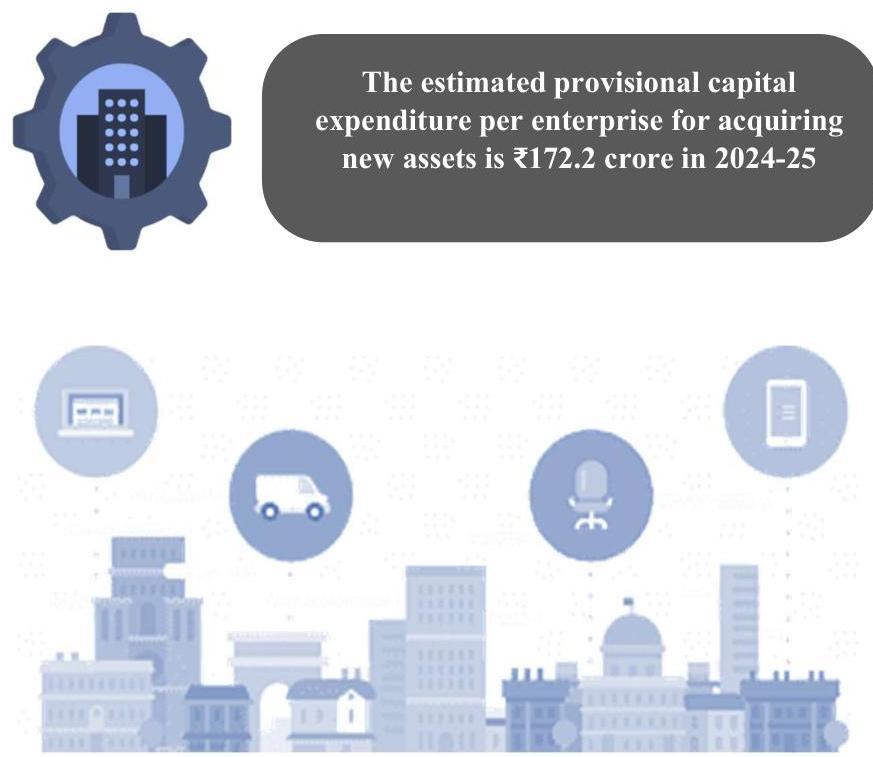
The estimated provisional capital expenditure per enterprise (incurred or intended to be incurred) for purchasing new assets is $₹ 172.2$ crore for the year 2024-25 (Table 6).
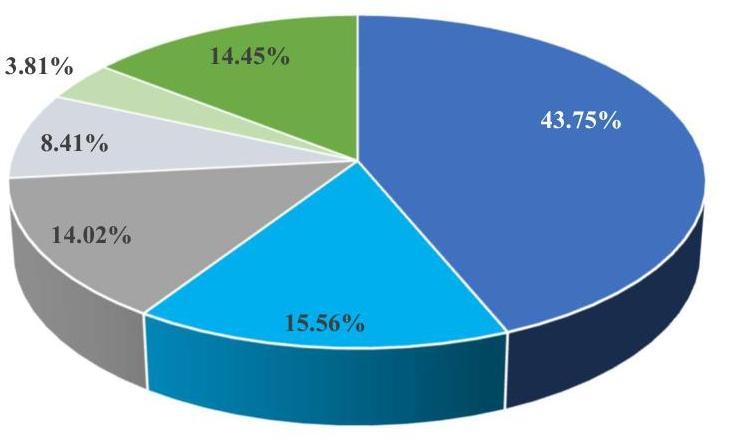
Provisional capital expenditure incurred per enterprise in 2024-25 was the highest for enterprises principally engaged in ‘mining \&quarrying’ activities (₹449.7 crore) followed by ‘transport \& storage’ (₹371.4 crore). In the estimated provisional capital expenditure for 2024-25, manufacturing sector enterprises held the largest share at $43.8 \%$,
followed by enterprises in ‘Information and Communication Activities’ (15.6\%) and ‘Transportation and Storage Activities’ (14.0\%).
In addition to the information on capital expenditure for purchasing new assets, the survey also collected provisionally incurred expenditure in 2024-25 by the private corporate sector for purchasing second-hand assets and undertaking major improvement of existing assets. The receipts expected from the intended sale of fixed assets during these reference years were also captured.
In the year 2024-25, the average provisional expenditure incurred per enterprise for purchasing second-hand assets was estimated to be at ₹1.2 crore. The activity categories that have reported higher expenditure per enterprise for purchasing second-hand assets in 2024-25 were electricity, gas, steam, air conditioning supply (₹19.3 crore), transportation \& storage (₹7.0 crore) and arts, entertainment and recreation, other service activities n.e.c. (₹2.5 crore). For majority of other activity categories, this expenditure was less than ₹1.0 crore per enterprise.
The provisional expenditure incurred by the private corporate sector in 2024-25 for undertaking major improvement of existing assets was ₹8.0 crore per enterprise. This is estimated to $4.7 \%$ of the capital expenditure per enterprise provisionally/intended to be incurred for purchasing new assets during the same year. The receipt expected per enterprise from intended sale of fixed assets was estimated at ₹15.0 crore in 2024-25.
Table 6: Estimated value of provisional capital expenditure per enterprise (in ₹ crore) incurred or intended to be incurred to purchase new asset, per enterprise expenditure (in ₹ crore) to purchase second-hand asset and perform major improvement of existing assets, receipts from intended sale (in ₹ crore) in 2024-25 for each principal/ main activity category
| activity description | to purchase new asset | expenditure per enterprise provisionally incurred for | receipts from intended sale of fixed assets | ||
|---|---|---|---|---|---|
| expenditure per enterprise provisionally incurred | \% distribution of aggregate expenditure | purchase of secondhand assets | major improvement of existing assets | ||
| agriculture, forestry, and fishing | 34.8 | 0.24 | 0.1 | 11.2 | 0.2 |
| mining and quarrying | 449.7 | 2.62 | 0.1 | 1.3 | 4.5 |
| manufacturing | 238.0 | 43.75 | 0.3 | 2.8 | 43.0 |
| electricity, gas, steam, air conditioning supply | 172.4 | 1.72 | 19.3 | 1.6 | 2.1 |
| water supply, sewerage, waste management and remediation activities | 12.7 | 0.05 | 0.4 | 0.2 | 0.1 |
| construction | 18.9 | 1.27 | 0.0 | 0.4 | 1.3 |
| wholesale and retail trade and repair of motor vehicles and motorcycles | 113.2 | 8.41 | 1.9 | 5.9 | 0.9 |
| transportation and storage | 371.4 | 14.02 | 7.0 | 26.5 | 4.4 |
| accommodation and Food service activities | 38.4 | 0.20 | 0.6 | 4.1 | 1.8 |
| information and communication | 233.5 | 15.56 | 0.3 | 21.9 | 5.2 |
Table 6: Estimated value of provisional capital expenditure per enterprise (in ₹ crore) incurred or intended to be incurred to purchase new asset, per enterprise expenditure (in ₹ crore) to purchase second-hand asset and perform major improvement of existing assets, receipts from intended sale (in ₹ crore) in 2024-25 for each principal/main activity category
| activity description | to purchase new asset | expenditure per enterprise provisionally incurred for | receipts from intended sale of fixed assets | ||
|---|---|---|---|---|---|
| expenditure per enterprise provisionally incurred | \% distribution of aggregate expenditure | purchase of secondhand assets | major improvement of existing assets | ||
| financial and insurance activities | 41.6 | 1.76 | 0.0 | 0.2 | 0.7 |
| real estate activities | 217.3 | 2.50 | – | 8.2 | 1.3 |
| professional, scientific, and technical activities | 130.6 | 1.39 | 0.1 | 87.6 | 1.7 |
| administrative and support service activities | 48.6 | 1.31 | 0.0 | 0.0 | 0.1 |
| education | 17.4 | 0.07 | 0.0 | 2.3 | 0.0 |
| human health, and social work activities | 108.7 | 1.32 | – | 1.8 | 0.4 |
| arts, entertainment and recreation, other service activities n.e.c. | 330.0 | 3.81 | 2.5 | 4.1 | 0.5 |
| all | 172.2 | 100.0 | 1.2 | 8.0 | 15.0 |
Sample size: – 2,758 (2024-25)
Figure 2: Percentage distribution of intended capital expenditure to buy new asset in 2024-25 by main activity
- manufacturing
- information and communication
- transportation and storage
- wholesale and retail trade and repair of motor vehicles and motorcycles
- arts, entertainment and recreation, other service activities n.e.c.
- others
For each Asset Category
While collecting the data on capital expenditure per enterprise provisionally incurred in 2024-25 for purchasing new assets, the amount allocated against each type of assets were also ascertained.
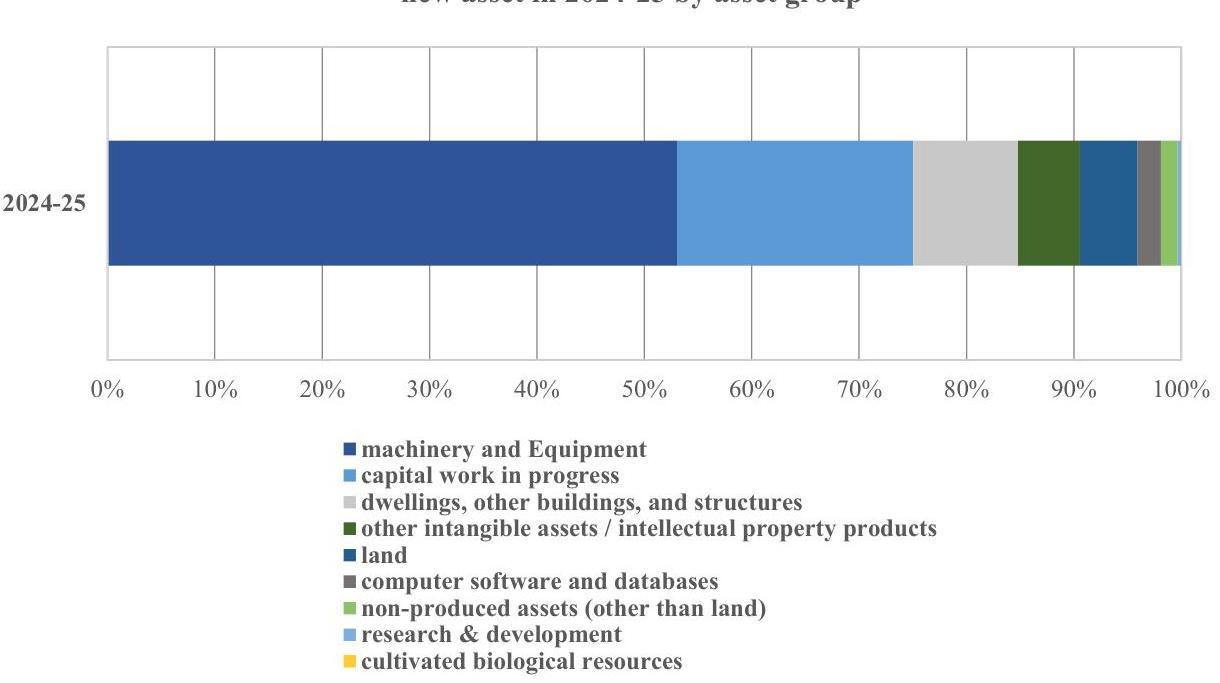
Out of the total capital expenditure provisionally incurred in the year 2024-25, nearly $53.1 \%$ were utilized for purchasing machinery \& equipment. The amount allocated for ‘capital work in progress’ (22.0\%) and purchasing dwellings, other buildings and structures’ (9.7\%) had the next highest share of allocation (Table 7).
Table 7: Estimated value of provisional capital expenditure per enterprise (in ₹ crore) incurred or intended to be incurred to purchase new asset, per enterprise expenditure (in ₹ crore) to purchase second-hand asset and perform major improvement of existing assets, receipts from intended sale (in ₹ crore) in 2024-25 for each asset group
| asset description | new asset | expenditure per enterprise provisionally incurred for | receipts from intended sale of fixed assets | ||
|---|---|---|---|---|---|
| expenditure per enterprise | $\%$ distribution | purchase of secondhand assets | major improvement of existing assets | ||
| dwellings, other buildings, and structures | 16.8 | 9.74 | 0.0 | 5.0 | 0.3 |
| machinery and Equipment | 91.4 | 53.05 | 1.2 | 2.7 | 11.9 |
| cultivated biological resources | 0.0 | 0.02 | – | – | – |
| land | 9.2 | 5.36 | – | – | 0.9 |
| computer software and databases | 3.7 | 2.17 | – | 0.1 | 0.4 |
| research and development | 0.6 | 0.32 | – | – | 0.0 |
| other Intangible Assets / Intellectual property products | 9.9 | 5.78 | – | 0.1 | 0.2 |
| non-Produced Assets (other than Land) | 2.7 | 1.56 | – | 0.0 | 1.3 |
| capital Work in progress | 37.9 | 22.0 | – | – | – |
| all assets | 172.2 | 100 | 1.2 | 8.0 | 15.0 |
Figure 3: Percentage distribution of intended capital expenditure to buy new asset in 2024-25 by asset group
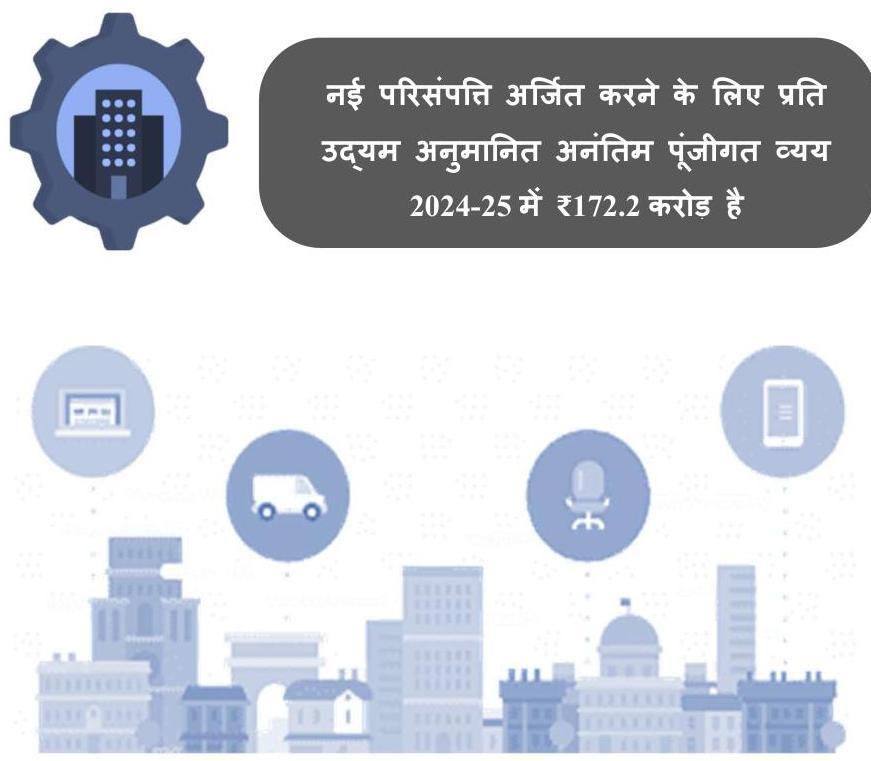
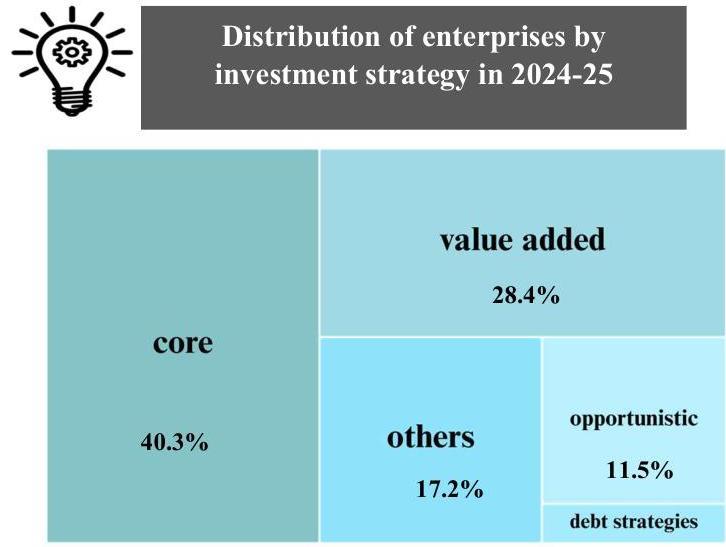
10.2.4 Investment strategy for CAPEX by the Private Corporate Sector in 2024-25
The survey collected information on the investment strategy ${ }^{9}$ planned for the provisional CAPEX incurred in the current year (i.e. 2024-25) from each of the responded enterprises.
As per the estimates generated from the survey data, over-all, nearly $40.3 \%$ of the enterprises have planned to make the CAPEX on core assets during 2024-25. Another $28.4 \%$ have done it on value-addition of their existing assets, nearly $11.5 \%$ on opportunistic assets and less than $3 \%$ for their debt strategies. Less than half a percent of the enterprises in the current year used strategy of investing in distressed assets and non-performing loans. However, about $16.9 \%$ of the enterprises used their CAPEX in 2024-25 for various other investment strategies (Table 8).
Among the principal activity categories, more than half of the enterprises in ‘agriculture, forestry, and fishing’ and ‘human health, and social work activities’ have used the CAPEX in 2024-25 for investing in their core assets. Whereas, in activity categories like ‘accommodation and Food service activities’ and ‘professional, scientific, and technical activities’ about one-fourth of the enterprises followed this strategy for CAPEX in 2024-25.
The survey estimated that nearly $68.3 \%$ enterprises in ‘accommodation and Food service activities’ and $55.7 \%$ of enterprises in ‘water supply, sewerage, waste management and remediation activities’ strategized to use their CAPEX in 2024-25 for the value addition of their existing assets.
The enterprises that followed an investment strategy for opportunistic assets were significantly higher among activity categories like ‘electricity, gas, steam, air conditioning supply’ (34.0\%) and ‘realestate activities $(30.3 \%)$.
Figure 4: Percentage distribution of enterprises by investment strategy in 2024-25 for each principal/ main activity category
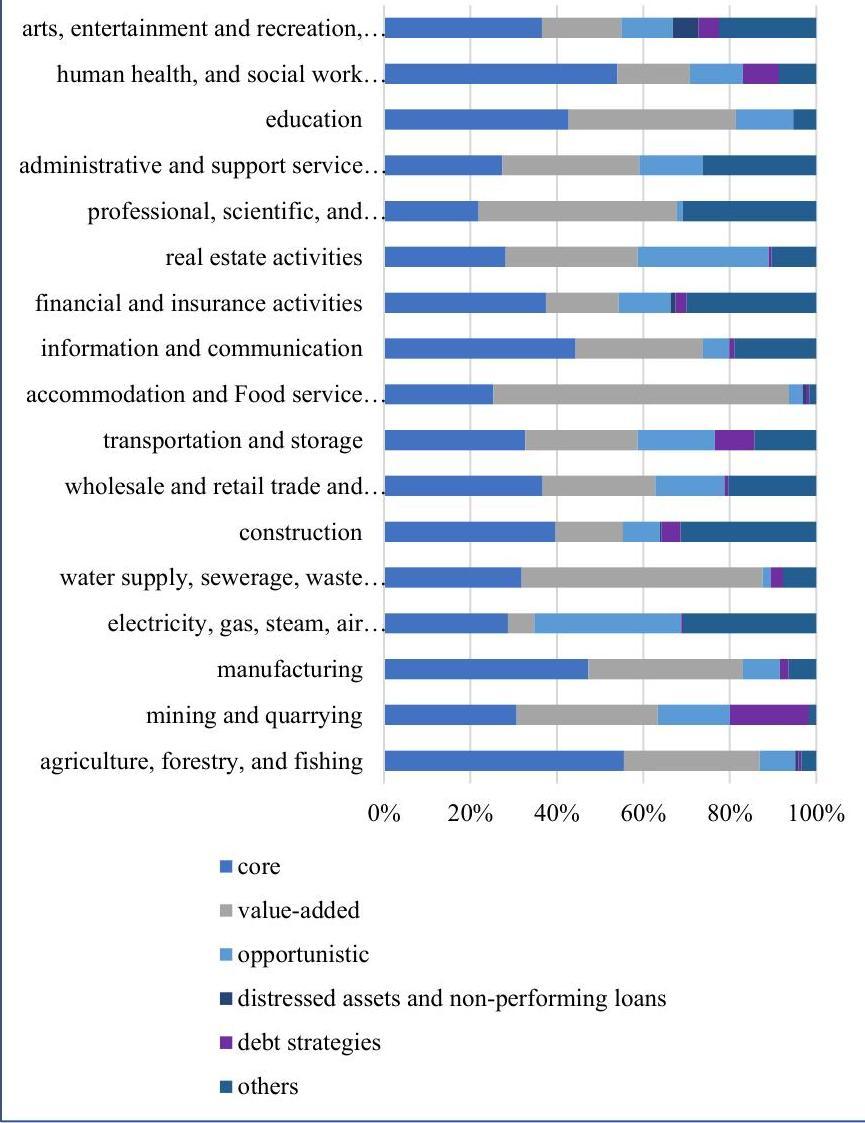
Table 8: Percentage distribution of enterprises by investment strategy in 2024-25 for each principal/ main activity category
| activity description | core | value added | opportu nistic | distressed assets and nonperforming loans | debt strategies | others | all |
|---|---|---|---|---|---|---|---|
| agriculture, forestry, and fishing | 55.53 | 31.34 | 8.29 | 0.69 | 0.69 | 3.45 | 100 |
| mining and quarrying | 30.68 | 32.64 | 16.75 | 0.00 | 18.23 | 1.71 | 100 |
| manufacturing | 47.28 | 35.77 | 8.56 | 0.02 | 2.01 | 6.36 | 100 |
| electricity, gas, steam, air conditioning supply | 28.70 | 6.07 | 34.01 | 0.00 | 0.38 | 30.84 | 100 |
| water supply, sewerage, waste management and remediation activities | 31.84 | 55.72 | 1.91 | 0.00 | 2.87 | 7.66 | 100 |
| construction | 39.72 | 15.60 | 8.57 | 0.26 | 4.52 | 31.33 | 100 |
| wholesale and retail trade and repair of motor vehicles and motorcycles | 36.73 | 26.06 | 15.95 | 0.05 | 0.84 | 20.38 | 100 |
| transportation and storage | 32.68 | 26.04 | 17.83 | 0.00 | 9.10 | 14.36 | 100 |
| accommodation and Food service activities | 25.32 | 68.34 | 3.17 | 0.79 | 0.79 | 1.58 | 100 |
| information and communication | 44.38 | 29.42 | 6.11 | 0.00 | 1.10 | 18.99 | 100 |
| financial and insurance activities | 37.45 | 16.83 | 12.06 | 1.04 | 2.53 | 30.09 | 100 |
Table 8: Percentage distribution of enterprises by investment strategy in 2024-25 for each principal/ main activity category
| activity description | core | value added | opportu nistic | distressed assets and nonperforming loans | debt strategies | others | all |
|---|---|---|---|---|---|---|---|
| real estate activities | 28.13 | 30.54 | 30.32 | 0.00 | 0.68 | 10.32 | 100 |
| professional, scientific, and technical activities | 21.93 | 45.87 | 1.33 | 0.00 | 0.00 | 30.87 | 100 |
| administrative and support service activities | 27.35 | 31.69 | 14.79 | 0.00 | 0.00 | 26.17 | 100 |
| education | 42.71 | 38.74 | 13.25 | 0.00 | 0.00 | 5.30 | 100 |
| human health, and social work activities | 53.97 | 16.85 | 12.20 | 0.00 | 8.33 | 8.66 | 100 |
| arts, entertainment and recreation, other service activities n.e.c. | 36.56 | 18.37 | 11.91 | 5.87 | 4.76 | 22.54 | 100 |
| all | 40.28 | 28.40 | 11.50 | 0.28 | 2.67 | 16.87 | 100 |
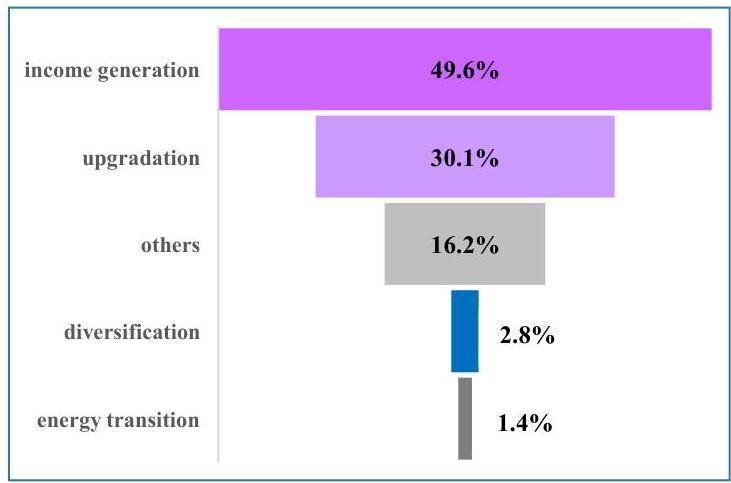
10.2.5 Main objective of CAPEX in 2024-25 for each principal/ main activity category
In the private corporate sector, the main ${ }^{10}$ objectives for making Capital Expenditure (CAPEX) as reported by enterprises are to enhance operational efficiency, increase revenue potential, and facilitate future growth, etc. In the survey, with regard to the provisional capital expenditure reported for the year 2024-25 (current year), additional information on the main objective for making CAPEX was also collected.
The survey estimated that nearly $49.6 \%$ of the enterprises in the private corporate sector made their CAPEX in the current year (2024-25) with the primary objective of income generation. Another $30.1 \%$ of the enterprises aimed their current year CAPEX for upgradation, about $2.8 \%$ used it for the purpose of diversification and less than $2 \%$ for green objectives like ‘energy transition/ conservation’. Nearly an estimated $16.2 \%$ of the enterprises used their CAPEX in the current year for ‘other reasons’ (Table 9).
The income generation objective for incurring CAPEX in the current year was highest among the enterprises engaged in ‘mining and quarrying’ (77.3\%) followed by ‘real estate activities’ (67.2\%) and ‘electricity, gas, steam, air conditioning supply’ (62.3\%)
Higher percentage share of enterprises engaged in ‘water supply, sewerage, waste management and remediation activities’ (51.9\%), ‘agriculture, forestry, and fishing’ (45.4\%) and ‘manufacturing’ (39.5\%) used their CAPEX for the primary aim for upgradation.
Diversification was the main objective for incurring CAPEX in 202425 for $17.3 \%$ enterprises in ‘agriculture, forestry, and fishing’, $14.1 \%$ enterprises in ‘administrative and support service activities’ and $5.3 \%$ enterprises engaged in ‘education’.
Figure 5: Percentage distribution of enterprises by main objective of investment in 2024-25 for each principal/ main activity category
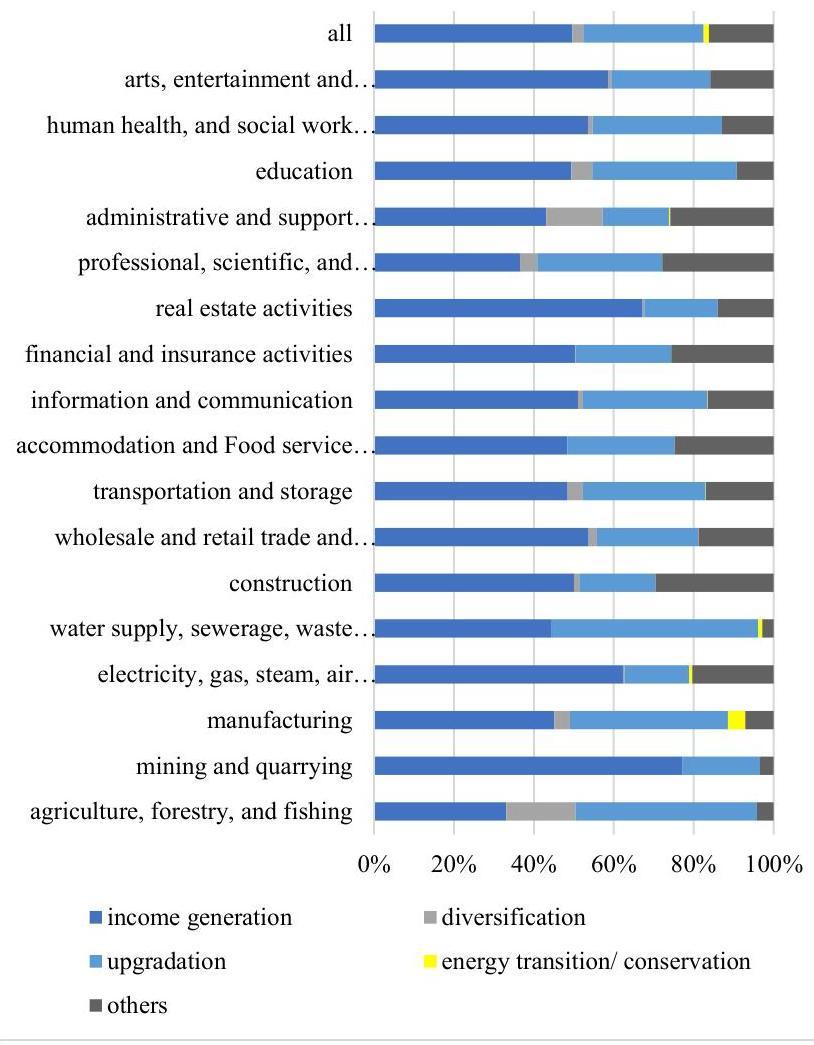
Table 9: Percentage distribution of enterprises by main objective of investment in 2024-25 for each principal/ main activity category
| activity description | income generation | diversifi cation | upgrad ation |
energy transiti on/ conserv ation | others | all |
|---|---|---|---|---|---|---|
| agriculture, forestry, and fishing | 33.14 | 17.31 | 45.41 | 0.00 | 4.15 | 100 |
| mining and quarrying | 77.26 | 0.00 | 19.32 | 0.00 | 3.43 | 100 |
| manufacturing | 45.11 | 3.96 | 39.49 | 4.36 | 7.08 | 100 |
| electricity, gas, steam, air conditioning supply | 62.33 | 0.38 | 16.18 | 0.76 | 20.35 | 100 |
| water supply, sewerage, waste management and remediation activities | 44.28 | 0.00 | 51.89 | 0.96 | 2.87 | 100 |
| construction | 50.04 | 1.34 | 19.12 | 0.00 | 29.50 | 100 |
| wholesale and retail trade and repair of motor vehicles and motorcycles | 53.69 | 2.13 | 25.39 | 0.05 | 18.74 | 100 |
| transportation and storage | 48.48 | 3.81 | 30.67 | 0.10 | 16.94 | 100 |
| accommodation and Food service activities | 48.34 | 0.00 | 26.90 | 0.00 | 24.76 | 100 |
| information and communication | 51.06 | 1.22 | 31.25 | 0.06 | 16.41 | 100 |
| financial and insurance activities | 50.26 | 0.18 | 23.96 | 0.00 | 25.61 | 100 |
| real estate activities | 67.22 | 0.46 | 18.33 | 0.00 | 14.00 | 100 |
| professional, scientific, and technical activities | 36.56 | 4.33 | 31.28 | 0.00 | 27.84 | 100 |
| administrative and support service activities | 43.13 | 14.11 | 16.58 | 0.36 | 25.81 | 100 |
| education | 49.34 | 5.30 | 36.09 | 0.00 | 9.27 | 100 |
| human health, and social work activities | 53.58 | 1.16 | 32.34 | 0.00 | 12.92 | 100 |
| arts, entertainment and recreation, other service activities n.e.c. | 58.53 | 0.88 | 24.78 | 0.00 | 15.81 | 100 |
| all | 49.61 | 2.75 | 30.10 | 1.38 | 16.16 | 100 |
Annexure-I: Enterprises
allotted, surveyed, casualties and non-response
A1: Number of enterprises allotted, surveyed, casualties and non-response for each principal/ main activity category
| strata description |
census sector | sample sector | ||||||||
|---|---|---|---|---|---|---|---|---|---|---|
| allotted | surveyed | casualty* | nonresponse | $\%$ surveyed |
allotted | surveyed | casualty* | non- response |
$\%$ surveyed |
|
| agriculture, forestry, and fishing | 91 | 55 | 1 | 35 | 60.4 | 11 | 2 | 0 | 9 | 18.2 |
| mining and quarrying | 67 | 38 | 1 | 28 | 56.7 | 16 | 11 | 0 | 5 | 68.8 |
| manufacturing | 949 | 590 | 10 | 349 | 62.2 | 360 | 219 | 3 | 138 | 60.8 |
| electricity, gas, steam, air conditioning supply | 166 | 67 | 1 | 98 | 40.4 | 18 | 6 | 1 | 11 | 33.3 |
| water supply, sewerage, waste management and remediation activities | 52 | 38 | 0 | 14 | 73.1 | 3 | 1 | 0 | 2 | 33.3 |
| construction | 639 | 333 | 20 | 286 | 52.1 | 140 | 66 | 2 | 72 | 47.1 |
| wholesale and retail trade and repair of motor vehicles and motorcycles | 304 | 179 | 3 | 122 | 58.9 | 169 | 93 | 1 | 75 | 55.0 |
| transportation and storage | 214 | 111 | 1 | 102 | 51.9 | 80 | 46 | 1 | 33 | 57.5 |
A1: Number of enterprises allotted, surveyed, casualties and non-response for each principal/ main activity category
| strata description |
census sector | sample sector | ||||||||
|---|---|---|---|---|---|---|---|---|---|---|
| allotted | surveyed | casualty* | nonresponse | $\%$ surveyed |
allotted | surveyed | casualty* | nonresponse | $\%$ surveyed |
|
| accommodation and Food service activities | 86 | 40 | 0 | 46 | 46.5 | 10 | 4 | 0 | 6 | 40.0 |
| information and communication | 337 | 198 | 4 | 135 | 58.8 | 151 | 86 | 1 | 64 | 57.0 |
| financial and insurance activities | 268 | 175 | 3 | 90 | 65.3 | 128 | 79 | 2 | 47 | 61.7 |
| real estate activities | 130 | 68 | 3 | 59 | 52.3 | 18 | 10 | 0 | 8 | 55.6 |
| professional, scientific, and technical activities | 22 | 13 | 0 | 9 | 59.1 | 6 | 3 | 0 | 3 | 50.0 |
| administrative and support service activities | 504 | 288 | 10 | 206 | 57.1 | 99 | 55 | 0 | 44 | 55.6 |
| education | 75 | 39 | 0 | 36 | 52.0 | 0 | 0 | 0 | 0 | 0.0 |
| human health, and social work activities | 148 | 84 | 3 | 61 | 56.8 | 9 | 8 | 0 | 1 | 88.9 |
A1: Number of enterprises allotted, surveyed, casualties and non-response for each principal/ main activity category
| strata description |
census sector | sample sector | ||||||||
|---|---|---|---|---|---|---|---|---|---|---|
| allotted | surveyed | casualty* | non- response |
$\%$ surveyed |
allotted | surveyed | casualty* | non- response |
$\%$ surveyed |
|
| arts, entertainment and recreation, other service activities n.e.c. |
93 | 52 | 1 | 40 | 55.9 | 17 | 7 | 0 | 10 | 41.2 |
| all | 4,145 | 2,368 | 61 | 1,716 | 57.1 | 1,235 | 696 | 11 | 528 | 56.4 |
*Ceased operations, sold or merged, not operational due to other reasons
A2: Number of enterprises allotted, surveyed, casualties and non-response for of state/ UT*
| State/UT | census frame | survey frame | ||||||||
|---|---|---|---|---|---|---|---|---|---|---|
| allotted | surveyed | casualty | nonresponse | $\%$ surveyed |
allotted | surveyed | casualty | non- response |
$\%$ surveyed |
|
| Andhra Pradesh |
58 | 49 | 1 | 8 | 84.5 | 16 | 13 | 0 | 3 | 81.2 |
| Assam | 3 | 2 | 1 | 0 | 66.7 | 5 | 4 | 0 | 1 | 80.0 |
| Bihar | 11 | 10 | 0 | 1 | 90.9 | 4 | 4 | 0 | 0 | 100.0 |
| Chandigarh | 8 | 5 | 0 | 3 | 62.5 | 6 | 5 | 0 | 1 | 83.3 |
| Chhattisgarh | 14 | 14 | 0 | 0 | 100.0 | 14 | 13 | 1 | 0 | 92.9 |
| Dadra \& Nagar Haveli and Daman \& Diu |
6 | 5 | 0 | 1 | 83.3 | 4 | 4 | 0 | 0 | 100.0 |
| Delhi | 630 | 359 | 2 | 269 | 57.0 | 193 | 105 | 0 | 88 | 54.4 |
| Goa | 16 | 14 | 0 | 2 | 87.5 | 2 | 1 | 0 | 1 | 50.0 |
| Gujarat | 316 | 152 | 8 | 156 | 48.1 | 119 | 61 | 2 | 56 | 51.3 |
| Haryana | 207 | 81 | 3 | 123 | 39.1 | 56 | 29 | 0 | 27 | 51.8 |
| Himachal Pradesh |
5 | 4 | 0 | 1 | 80.0 | 0 | 0 | 0 | 0 | 0.0 |
| Jammu \& Kashmir |
0 | 0 | 0 | 0 | 0.0 | 1 | 1 | 0 | 0 | 100.0 |
| Jharkhand | 5 | 4 | 0 | 1 | 80.0 | 3 | 3 | 0 | 0 | 100.0 |
| Karnataka | 427 | 227 | 4 | 196 | 53.2 | 106 | 51 | 1 | 54 | 48.1 |
| Kerala | 40 | 39 | 1 | 0 | 97.5 | 14 | 11 | 2 | 1 | 78.6 |
A2: Number of enterprises allotted, surveyed, casualties and non-response for of state/ UT*
| State/UT | census frame | survey frame | ||||||||
|---|---|---|---|---|---|---|---|---|---|---|
| allotted | surveyed | casualty | nonresponse | $\%$ surveyed |
allotted | surveyed | casualty | non- response |
$\%$ surveyed |
|
| Madhya Pradesh |
27 | 24 | 1 | 2 | 88.9 | 12 | 11 | 1 | 0 | 91.7 |
| Maharashtra | 1,317 | 819 | 20 | 478 | 62.2 | 330 | 197 | 3 | 130 | 59.7 |
| Meghalaya | 1 | 1 | 0 | 0 | 100.0 | 2 | 2 | 0 | 0 | 100.0 |
| Odisha | 29 | 7 | 2 | 20 | 24.1 | 11 | 5 | 0 | 6 | 45.5 |
| Puducherry | 2 | 0 | 0 | 2 | 0.0 | 0 | 0 | 0 | 0 | 0.0 |
| Punjab | 36 | 29 | 1 | 6 | 80.6 | 18 | 16 | 0 | 2 | 88.9 |
| Rajasthan | 48 | 45 | 1 | 2 | 93.8 | 27 | 21 | 0 | 6 | 77.8 |
| Tamil Nadu | 354 | 213 | 9 | 132 | 60.2 | 99 | 54 | 1 | 44 | 54.5 |
| Telangana | 293 | 118 | 0 | 175 | 40.3 | 78 | 24 | 0 | 54 | 30.8 |
| Uttar Pradesh | 77 | 40 | 5 | 32 | 52.0 | 29 | 16 | 0 | 13 | 55.2 |
| Uttarakhand | 5 | 5 | 0 | 0 | 100.0 | 2 | 2 | 0 | 0 | 100.0 |
| WestBengal | 210 | 102 | 2 | 106 | 48.6 | 84 | 43 | 0 | 41 | 51.2 |
| all | 4,145 | 2,368 | 61 | 1,716 | 57.1 | 1,235 | 696 | 11 | 528 | 56.4 |
*Location of registered office as per MCA database
Annexure-II: Concepts \&
Definitions
Capital Expenditure: – Capital expenditure (Capex) is the amount of expenditure incurred by the enterprise to purchase, maintain, or enhance long-term assets. This kind of spending is regarded as an investment that improves the economic value of operations by increasing effectiveness or capacities. The long-term assets are typically permanent in nature and not consumable. They can be tangible, for instance, land, machinery or vehicles, construction, equipment, etc., and even intangible, like software, patents or licenses, etc. In contrast to other expenditures reported on the income/profit and loss statements, capital expenditures are reflected on the balance sheet in the form of an asset.
The fixed assets purchased through capital expenditure are intended for use in the operations of own enterprise or for lease or rent to others. These fixed assets are also known as capital assets or property, plant and equipment. They are items with a shelf life of more than one year and are not purchased for resale but rather for use in the entity’s production of goods and services.
List of Assets/Items to be Included in Capex:
- Cost of all new buildings, engineering, machinery, and equipment, etc. which normally have a life of more than one year and are charged to fixed asset accounts.
- Cost for acquiring/developing computer software, database, licenses, contracts, and other intangible assets which are intended for increasing operational efficiency.
- Expenditure on plants/tree, livestock that produce output such as fruits, nuts, rubber, milk, wool, etc. repeatedly for more than one year.
- Modifications, additions, and major renovations which increase the shelf life of assets.
- Capital costs such as feasibility studies, architectural, legal, installation and engineering fees.
- Capitalized interest charges on loans with which capital projects are financed.
- Capital work in progress.
List of Assets/Items to be excluded from Capex:
- Transfers from capital work in progress (construction-inprogress) to fixed assets accounts.
- Assets associated with the acquisition of companies.
- Property developed for sale and machinery, or equipment acquired for sale.
Different types of assets considered under CAPEX:
(i) Land: It includes the cost involved in acquisition of land.
(ii) Dwellings, Other buildings, and Structures: Construction of Buildings (for both residential and nonresidential purpose), or designated parts of buildings, including any associated structures, such as garages, roads,
Annexure-II
bridges, sewers, etc. and all permanent fixtures, facilities and equipment that are integral parts of the structures are included. Besides, land improvements that lead to major improvements in the quantity, quality, or productivity of land, or prevent its deterioration and costs of ownership transfer on land are also considered.
(iii) Machinery and Equipment: It covers transport equipment, machinery for information, communication, and telecommunications (ICT) equipment, and other machinery and equipment including acquisition of weapons systems and any such products.
(iv) Computer software and databases: It consists of development of new computer programs, program descriptions and supporting materials for both systems and applications software or extension of existing software and development of database and clouds which permits resource-effective access and use of the data.
(v) Research and development: It consists of the value of expenditures on creative work undertaken on a systematic basis in order to increase the stock of knowledge, including knowledge of man, culture and society, and use of this stock of knowledge to devise new applications (except human capital) which is expected to provide benefits in the long run.
(vi) Intangible Assets / Intellectual property products: Example of intellectual property products are the results of mineral exploration and evaluation, entertainment, literary or artistic originals and any such products like Patents, Licenses, Rights, Goodwill, and marketing assets, etc. and other intangible assets that constitute fixed (intangible) assets but are not captured in one of the specific items above.
(vii) Cultivated biological resources: It cover animal resources yielding repeat products and tree, crop and plant resources yielding repeat products whose natural growth and regeneration are under the direct control, responsibility, and management of institutional units.
(viii) Non-Produced Assets (other than Land): It includes the acquisition cost for all tangible (excluding land) and intangible non-produced assets e.g. natural resources like mineral and energy reserves, water resources, radio spectra and others.
(ix) Capital Work in Progress (CWIP): It is the expenditure on fixed assets that are in the process of construction or completion and are not ready for intended use on the reporting date.
Financial year: According to Section 2(41) of The Companies Act, 2013, financial year, in relation to any company or body corporate, means the period ending on the 31st day of March every year. Where a company has been incorporated on or after 1st day of January of a year, the first financial year will end on 31st day of March of the following year. A Financial Year (FY) is the 12-month period between 1 April and 31 March e.g. FY 2024-25 means the period from 1 April 2024 to 31 March 2025.
Realisation Ratio (RR): The realization ratio of CAPEX (Capital Expenditure) measures the accuracy of capital expenditure expectations by comparing actual expenditure with the expected amount. It’s calculated by dividing actual expenditure by the expected expenditure.
Realisation Ratio
$=\frac{\text { actual capital expenditure in a financial year }}{\text { proposed capital expenditure in a financial year }} \times 100$
Second hand assets: Used/ second hand fixed assets may be defined as existing buildings, structures or machinery and equipment or any other fixed assets which have been previously used by another enterprise in India that the company has acquired during the time period being reported on this survey. However, imported assets should be treated as a new asset and reported in appropriate place in the survey.
Annexure-II
Major improvement of existing assets: These include outlays on major alterations in machinery, equipment, structure, or other fixed assets which significantly extend their expected life-time of use, productivity or the character or the volume of the service they render. However, outlay of recurring nature on fixed assets necessary to keep them in good working order and replacement of parts and attachments of fixed assets which are short-lived (having an expected lifetime use of up to one year) and / or of relatively small value are not included here.
Financial Lease: Lease Includes: Assets acquired as a lessee through either a capital or financial lease. Assets acquired for lease to others as an operating lease.
Lease Excludes: Operating leases acquired as a lessee and capitalized to right-of-use assets in accordance with Ind AS 116 (Indian Accounting Standard) Assets acquired for lease to others, either as a capital or financial lease.
Currently Operational Enterprises: An Operational Enterprise is a business enterprise that conducts economic activities by generating, trading, or selling a product(s) or service(s) as on date of survey.
Amalgamation with other enterprises: It means the enterprise is merged with another enterprise or group of enterprises. In case of
Annexure-II
amalgamation, the enterprise must not continue its business with its previous CIN. All the amalgamated enterprises either registered with a new CIN or continue with the CIN of the enterprise to which it is amalgamated.
Gross Fixed Asset (GFA): Assets held for the purpose of producing or providing goods or services and not for resale in the normal course of entrepreneurial activities are classified as fixed assets. These cover all tangible goods, new or used, that have a normal economic life of more than one year from the date of purchase. Fixed assets include not only structures, machinery and equipment but also intellectual property products such as software or artistic originals that are used in production.
Capital work in Progress (CWIP): These are expenses made by the enterprise on some fixed assets although the amount spent has not yet been capitalised. Building, machinery, etc. under construction are recorded here.
Investment Strategy: Different investment strategies which were considered for the survey are described below:
Core – investment on the business activity that is main source of a company’s profits and success
Value-added -investment on anything that improves company’s business, like increasing sales, growing customer base, providing better quality products or others.
Opportunistic -investment on new business activities which is expected to have more profitability or scope in future
Distressed assets and non-performing loans -investment to purchase distressed assets and non-performing loans
Debt strategies – strategy is to prioritize debt payments
Others – strategy of investment is different from any of the above options
Annexure-III: Questionnaire of Survey
FORWARD-LOOKING SURVEY ON PRIVATE SECTOR CAPEX INVESTMENT INTENTIONS
Identification Particulars:
- Provide the Identification particulars of the enterprise.
1.1 Corporate Identification Number (CIN) of the enterprise
1.2 Legal name of the enterprise
1.3 Operating name of the enterprise
1.4 Company address of the enterprise
1.5 Company email id
1.6 GSTN of the enterprise (GSTN of the Head Office is to be provided) - Provide the contact information of the designated enterprise contact person for this questionnaire.
2.1 First name
2.2 Last name
2.3 Designation
2.4 Email Address
2.5 Postal Address
2.6 Mobile number
2.7 Alternate Mobile number
- Provide the current operational status of the enterprise identified by the legal and operating name above (as on the date of the survey).
- Operational – 1
- Not currently operational – 2
3.1 Why is this enterprise not currently operational?
3.1.1 Seasonal operations – 21
(3.1.1.1) When did this enterprise close for the season? – Provide Date
(3.1.1.2) When does this enterprise expect to resume operations? – Provide Date
3.1.2 Ceased / Strike off operations – 22
(3.1.2.1) When did this enterprise cease operations? – Provide Date
(3.1.2.2) Why did this enterprise cease operations? - Bankruptcy – 221
- Liquidation – 222
- Dissolution – 223
- Other – 224
(3.1.2.3) Specify the other reasons why the operations ceased – Provide Details (textbox with 250 characters)
3.1.3 Sold operations – 23
(3.1.3.1) When was this enterprise sold? – Provide Date
(3.1.3.2) What is the CIN of the buyer? – Provide CIN
(3.1.3.3) What is the Legal name of the buyer? Provide name
3.1.4 Amalgamated with other enterprises – 24
(3.1.4.1) When did this enterprise amalgamate? Provide Date
(3.1.4.2) What is the CIN of the resulting or continuing enterprise?
(3.1.4.3) What is the Legal name of the resulting or continuing enterprise?
(3.1.4.4) What are the CINs of the other amalgamated enterprises?
(3.1.4.5) What are the Legal names of the other amalgamated enterprises?
3.1.5 Temporarily inactive but will re-open – 25
(3.1.5.1) When did this enterprise become temporarily inactive? – Provide Date
(3.1.5.2) When does this enterprise expect to resume operations? – Provide Date
(3.1.5.3) Why is this enterprise temporarily inactive? – Provide Details
3.1.6 No longer operating due to other reasons – 26
(3.1.6.1) When did this enterprise stop operations? Provide Date
(3.1.6.2) Why did this enterprise stop operations? –
Provide Details
If the reply in Question 3 is 1 or (2 and then 21) or (2 and then 25), then move to Question 4, otherwise submit.
- Provide the place of Business Operation of the EnterpriseList of States / UTs with multiple selection options.
- Provide the current Principal / Main activity of the enterprise mentioned above.
Select this enterprise’s activity sector in two steps. Step 1:
- Agriculture, forestry, and fishing – I01
- Mining and quarrying – I02
- Manufacturing – I03
- Electricity, gas, steam, air conditioning supply – I04
- Water supply, sewerage, waste management and remediation activities – I05
- Construction – I06
- Wholesale and retail trade and repair of motor vehicles and motorcycles – I07
- Transportation and storage – I08
- Accommodation and Food service activities – I09
- Information and communication – I10
- Financial and insurance activities – I11
- Real estate activities – I12
- Professional, scientific, and technical activities – I13
- Administrative and support service activities-I14
- Education – I15
- Human health, and social work activities – I16
- Arts, entertainment and recreation, other service activities n.e.c. I17
Step 2: Detailed list is available in Annexure-IV.
- Percentage of Total Turnover contributed by the Principal / Main activity of the enterprise mentioned above (selected NIC2008 2-digit level in Q. No. 5). – Provide Value in percentage (in whole number).
- Whether any enterprise is amalgamated or merged or acquired by this enterprise during the period 01.04 .2024 till the date of survey
- Yes – 1
If yes, Details of the enterprises which is amalgamated or merged or acquired
(7.1) Number of enterprises amalgamated or merged or acquired
(7.2) Name of the enterprises
(7.3) CIN of the enterprises
- No – 2
- Whether the enterprise was operational before the financial year 2021-22
8.1 Details of actual and proposed annual ‘Capital Expenditure’ incurred by the enterprise in last 3 financial years (Please report financial information in thousands (‘000’) upto three decimal places of Indian Rupees)
| FY Code | Gross Total Fixed Assets as on 31st March of the last FY |
Capital Expenditure proposed at the beginning of the FY |
Actual Capital Expenditure incurred |
|---|---|---|---|
| (1) | (2) | (3) | (4) |
| $2021-22$ | F01 | ||
| $2022-23$ | F02 | ||
| $2023-24$ | F03 |
- Details of asset wise Provisional ‘Capital Expenditure’ incurred or to be incurred by the enterprise in Current Financial Year i.e., 2024-25 (Provide latest information as on the date of the survey).
(Note: (i) All transactions of non-financial assets that are either part of or will be part of the balance sheet need to be reported, (ii) Please report financial information in thousands (‘000’) upto three decimal places of Indian Rupees)
| Asset groups | Asset Code |
Expenditure intended to be incurred during current FY on | Intended Sale of Fixed Assets during current FY |
Total Expenditure $=\mathrm{col} .3+\mathrm{col} .4$ $+\mathrm{col} .5$ |
||
|---|---|---|---|---|---|---|
| Purchase of New Assets including financial leases | Purchase of Secondhand Assets | Major Improvement of Existing Assets |
||||
| (1) | (2) | (3) | (4) | (5) | (6) | (7) |
| Dwellings, Other buildings, and Structures | A01 | |||||
| Machinery and Equipment (include plant \& equipment, office equipment, Furniture \& Fixtures, Transport equipment etc.) | A02 | |||||
| Cultivated biological resources | A03 |
Annexure-III
| Asset groups | Asset Code |
Expenditure intended to be incurred during current FY on | Intended Sale of Fixed Assets during current FY |
Total Expenditure $=\mathrm{col} .3+\mathrm{col} .4$ $+\mathrm{col} .5$ |
||
|---|---|---|---|---|---|---|
| Purchase of New Assets including financial leases | Purchase of Secondhand Assets | Major Improvement of Existing Assets |
||||
| (1) | (2) | (3) | (4) | (5) | (6) | (7) |
| Land | A04 | |||||
| Computer software and databases | A05 | |||||
| Research and development (include development expenditure meant for capitalization) | A06 | |||||
| Other Intangible Assets / Intellectual property products | A07 | |||||
| Non-Produced Assets (other than Land) | A08 | |||||
| Capital Work in progress | A09 | |||||
| Total | A10 |
9.1 Sector/Industry-Wise details of Provisional ‘Capital Expenditure’ incurred or to be incurred by the enterprise in current financial year i.e., 2024-25 (Provide latest information as on the date of the survey).
(Note: Please report financial information in percentage out of the Total Provisional Capital Expenditure incurred during 2024-25. All transactions of non-financial assets that are either part of or will be part of the balance sheet need to be considered.)
| Sector / Industry | Industry Code |
Percentage (in whole number) of Capital Expenditure to be incurred during 2024-25 |
|---|---|---|
| (1) | $(2)$ | $(3)$ |
| Agriculture, forestry, and fishing | 101 | |
| Mining and quarrying | 102 | |
| Manufacturing | 103 | |
| Electricity, gas, steam, air conditioning supply | 104 | |
| Water supply, sewerage, waste management and remediation activities |
105 | |
| Construction | 106 | |
| Wholesale and retail trade and repair of motor vehicles and motorcycles |
107 | |
| Transportation and storage | 108 | |
| Accommodation and Food service activities | 109 |
| Sector / Industry | Industry Code |
Percentage (in whole number) of Capital Expenditure to be incurred during 2024-25 |
|---|---|---|
| Information and communication | I10 | |
| Financial and insurance activities | I11 | |
| Real estate activities | I12 | |
| Professional, scientific, and technical activities | I13 | |
| Administrative and support service activities | I14 | |
| Education, | I15 | |
| Human health, and social work activities | I16 | |
| Arts, entertainment and recreation, other service activities n.e.c. |
I17 |
- Asset-Wise Details of “Capital Expenditure” intended to be incurred by the enterprise in next Financial Year i.e., 2025-26 (Provide latest information as on the date of the survey)
(Note: (i) All transactions of non-financial assets that are either part of or will be part of the balance sheet need to be reported. (ii) Please report financial information in thousands (000) upto three decimal places of Indian Rupees)
| Asset groups | Asset Code |
Expenditure intended to be incurred during current FY on | Intended Sale of Fixed Assets during current FY |
Total Expenditure $=\mathrm{col} .3+\mathrm{col} .4$ $+\mathrm{col} .5$ |
||
|---|---|---|---|---|---|---|
| Purchase of New Assets including financial leases | Purchase of Secondhand Assets | Major Improvement of Existing Assets |
||||
| (1) | (2) | (3) | (4) | (5) | (6) | (7) |
| Dwellings, Other buildings, and Structures | A01 | |||||
| Machinery and Equipment (include plant \& equipment, office equipment, Furniture \& Fixtures, Transport equipment etc.) | A02 | |||||
| Cultivated biological resources | A03 |
Annexure-III
| Asset groups | Asset Code |
Expenditure intended to be incurred during current FY on | Intended Sale of Fixed Assets during current FY |
Total Expenditure $=\mathrm{col} .3+\mathrm{col} .4$ $+\mathrm{col} .5$ |
||
|---|---|---|---|---|---|---|
| Purchase of New Assets including financial leases | Purchase of Secondhand Assets | Major Improvement of Existing Assets |
||||
| (1) | (2) | (3) | (4) | (5) | (6) | (7) |
| Land | A04 | |||||
| Computer software and databases | A05 | |||||
| Research and development (include development expenditure meant for capitalization) | A06 | |||||
| Other Intangible Assets / Intellectual property products | A07 | |||||
| Non-Produced Assets (other than Land) | A08 | |||||
| Capital Work in progress | A09 | |||||
| Total | A10 |
10.1 Sector/Industry-wise details of ‘Capital Expenditure’ intended to be incurred by the enterprise in next Financial Year i.e., 2025-26 (Provide latest information as on the date of the survey)
(Note: Please report financial information in percentage out of the Total Capital Expenditure intended to be incurred during 2025-26. All transactions of non-financial assets that are either part of or will be part of the balance sheet need to be considered.)
| Sector / Industry | Industry Code |
Percentage (in whole number) of Capital Expenditure to be incurred during 2025-26 |
|---|---|---|
| (1) | $(2)$ | $(3)$ |
| Agriculture, forestry, and fishing | 101 | |
| Mining and quarrying | 102 | |
| Manufacturing | 103 | |
| Electricity, gas, steam, air conditioning supply | 104 | |
| Water supply, sewerage, waste management and remediation activities |
105 | |
| Construction | 106 | |
| Wholesale and retail trade and repair of motor vehicles and motorcycles |
107 | |
| Transportation and storage | 108 | |
| Accommodation and Food service activities | 109 |
| Sector / Industry | Industry Code |
Percentage (in whole number) of Capital Expenditure to be incurred during 2025-26 |
|---|---|---|
| (1) | $(2)$ | $(3)$ |
| Information and communication | 110 | |
| Financial and insurance activities | 111 | |
| Real estate activities | 112 | |
| Professional, scientific, and technical activities | 113 | |
| Administrative and support service activities | 114 | |
| Education, | 115 | |
| Human health, and social work activities | 116 | |
| Arts, entertainment and recreation, other service activities n.e.c. |
117 |
10.2 You have not reported any capital expenditure intentions for the next Financial Year i.e. 2025-26.
Please indicate the reason.
- Zero capital expenditure intentions for FY2025-26 – 1
- Figures not available but plans are for no change in capital expenditures for FY2025-26 – 2
- Figures not available but plans are for an increase in capital expenditures for FY2025-26 – 3
- Figures not available but plans are for a decrease in capital expenditures for FY2025-26 – 4
- Assets Buying Activity Expectations related to nonfinancial assets in the next FY (e.g., 2025-26)
- Acquire/ increase by $10 \%$ or more (from existing gross fixed assets) -1
- Acquire/ increase upto $10 \%$ or more (from existing gross fixed assets) -2
- No intention to sell -3
- Assets Selling Activity Expectations in the next FY (e.g., 2025-26)
- sell/ decrease by $10 \%$ or more (from existing gross fixed assets) -1
- sell/ decrease upto $10 \%$ or more (from existing gross fixed assets) -1
- No intention to sell
- Preferred Investment Strategy in the current FY (e.g., 2024-25)
- Core – 1
- Value-added – 2
- Opportunistic – 3
- Distressed assets and non-performing loans – 4
- Debt strategies – 5
- Others, please specify – 9
- Objective of investment in the current FY (e.g., 2024-25)
- Income generation – 1
- Diversification – 2
- Upgradation – 3
- Energy transition/ conservation-4
- Others, please specify – 9
- Overall value of intended CAPEX expenditure for the next three financial year namely 2026-27 to 2028-29 (Provide latest information as on the date of the survey) (Please report financial information in thousands (‘000’) upto three decimal places of Indian Rupees)
Annexure-IV: List of NIC – 2008 included in the survey
List of NIC – 2008 activities included in the survey:
| Stratum | NIC 2008 Section | Composition ${ }^{11}$ |
|---|---|---|
| 1 | Agriculture, forestry and fishing (A) | – Crop and animal production, hunting and related service activities (01) – Forestry and logging (02) – Fishing and aquaculture (03) |
| 2 | Mining and quarrying(B) | – Mining of coal and lignite (05) – Extraction of crude petroleum and natural gas (06) – Mining of metal ores (07) – Other mining and quarrying (08) – Mining support service activities (09) |
| 3 | Manufacturing(C) | – Manufacture of food products, beverages, and tobacco products $(10,11,12)$ – Manufacture of textiles, wearing apparel and leather and related products $(13,14,15)$ – Manufacture of wood and products of wood and cork, except furniture; manufacture of articles of straw and plaiting materials, Manufacture of furniture $(16,31)$ – Manufacture of paper and paper products (17) – Printing and reproduction of recorded media (18) – Manufacture of coke and refined petroleum products (19) – Manufacture of chemicals and chemical products (20) – Manufacture of pharmaceuticals, medicinal, chemical and botanical products (21) – Manufacture of rubber, plastics products, other non-metallic mineral products $(22,23)$ – Manufacture of basic metals, fabricated metal products, except machinery and equipment (24, 25) – Manufacture of computer, electronic, optical products, electrical equipment, machinery, and equipment n.e.c. $(26,27,28)$ – Manufacture of motor vehicles, trailers, semi- |
| Stratum | NIC 2008 Section | Composition ${ }^{11}$ |
|---|---|---|
| trailers, other transport equipment $(29,30)$ – Other manufacturing, repair and installation of machinery and equipment $(32,33)$ |
||
| 4 | Electricity, gas, steam and air conditioning supply(D) | Electricity, gas, steam, and air conditioning supply (35) |
| 5 | Water supply, sewerage, waste management and remediation activities(E) | – Water collection, treatment, and supply (36) – Sewerage, waste collection, treatment, and disposal activities; materials recovery $(37,38)$ – Remediation activities and other waste management services (39) |
| 6 | Construction (F) | – Construction of buildings (41) – Civil engineering (42) – Specialized construction activities (43) |
| 7 | Wholesale and retail trade and repair of motor vehicles and motor cycles(G) | – Wholesale and retail trade and repair of motor vehicles and motor cycles (45) – Wholesale trade, except of motor vehicles and motor cycles (46) – Retail trade, except of motor vehicles and motor cycles (47) |
| 8 | Transportation and storage (H) | – Land transport and transport via pipelines (49) – Water transport (50) – Air transport (51) – Warehousing and support activities for transportation (52) – Postal and courier activities (53) |
| 9 | Accommodation and Food service activities (I) | – Accommodation (55) – Food and beverage service activities (56) |
| 10 | Information and communication(J) | – Publishing activities (58) – Motion picture, video and television programme production, sound recording and music publishing activities (59) – Broadcasting and programming activities (60) |
| Stratum | NIC 2008 Section | Composition ${ }^{11}$ |
|---|---|---|
| – Telecommunications (61) – Computer programming, consultancy, and related activities (62) – Information service activities (63) |
||
| 11 | Financial and insurance activities(K) | – Financial service activities, except insurance and pension funding (64) – Insurance, reinsurance, and pension funding, except compulsory social security (65) – Other financial activities (66) |
| 12 | Real estate activities (L) | Real estate activities (68) |
| 13 | Professional, scientific, and technical activities(M) | – Legal and accounting activities (69) – Activities of head offices; management consultancy activities (70) – Architecture and engineering activities; technical testing and analysis (71) – Scientific research and development (72) – Advertising and market research (73) – Other professional, scientific, and technical activities (74) – Veterinary activities (75) |
| 14 | Administrative and support service activities ( N ) | – Rental and leasing activities (77) – Employment activities (78) – Travel agency, tour operator and other reservation service activities (79) – Security and investigation activities (80) – Services to buildings and landscape activities (81) – Office administrative, office support and other business support activities (82) |
| 15 | Education (P) | – Education (85) |
| 16 | Human health, and social work activities(Q) | – Human health activities (86) – Residential care activities (87) – Social work activities without accommodation (88) |
| 17 | Arts, entertainment and recreation, other service activities (R,S) | – Creative, arts and entertainment activities (90) – Libraries, archives, museums, and other cultural activities (91) – Gambling and betting activities (92) |
D-3
| Stratum | NIC 2008 Section | Composition ${ }^{11}$ |
|---|---|---|
| – Sports activities and amusement and recreation activities (93) – Activities of membership organizations (94) – Repair of computers and personal and household goods (95) – Other personal service activities (96) |
Annexure-V: Estimation Procedure
Estimation Procedure
Notations:
$\mathrm{t}=$ subscript for $\mathrm{t}^{\text {th }}$ stratum.
$\mathrm{k}=$ subscript for $\mathrm{k}^{\text {th }}$ sample enterprise under a particular stratum.
$\mathrm{E}=$ total number of enterprises in the sample sector in a stratum.
$\mathrm{e}=$ number of enterprises surveyed out of total number of enterprises in the sample sector in a stratum.
$x, y=$ observed value of characteristics $x$, $y$ under estimation.
$\hat{X}, \hat{Y}=$ estimate of population total $X, Y$ for the characteristics $\mathrm{x}, \mathrm{y}$.
Under the above symbols,
$y_{t k}=$ observed value of the characteristic y for the $\mathrm{k}^{\text {th }}$ unit belonging to the $\mathrm{t}^{\text {th }}$ stratum
Estimation of aggregates (Y):
The estimate has two parts:
i) Census Sector aggregate ( $\left.{ }^{\mathrm{c}} \hat{\mathrm{Y}}\right)$
ii) Sample Sector estimate of aggregate $\left({ }^{\mathrm{S}} \hat{\mathrm{Y}}\right)$
The estimation formula for any characteristic of the unit in the sample sector in $\mathrm{t}^{\text {th }}$ strata is:
$$
{ }^{\mathrm{S}} \hat{\mathrm{Y}}{t}=\frac{E{t}}{e_{t}} \sum_{k=1}^{e_{t}} y_{t k}
$$
Thus, the estimator for any characteristic of the unit in the sample sector is:
$$
{ }^{S} \hat{Y}=\sum_{t}{ }^{S} \hat{Y} t
$$
The estimate for that characteristic of the unit as a whole is given by:
$$
\hat{Y}=c \hat{Y}+{ }^{S} \hat{Y}
$$
Estimates of Ratios (R):
Let $\hat{Y}$ and $\hat{X}$ be the overall estimate of the aggregates Y and X for two characteristics $y$ and $x$, respectively at all-India level.
Then the combined ratio estimates $(\hat{R})$ of the ratio $\left(R=\frac{Y}{X}\right)$ will be obtained as $\hat{R}=\frac{\hat{Y}}{\hat{X}}$.
Treatment of Casualty Cases and Non-Response
Sample Sector
Casualty may occur in cases where the unit is existing but data could not be collected due to different reasons like cease of operation (code 22 in Question 3.1), sold operation (code 23 in Question 3.1), amalgamation with other enterprises (code 24 for Question 3.1) or due to other reasons (code 29 in Question 3.1). While counting the number of units surveyed $\left(e_{i}\right)$ in the $\mathrm{t}^{\text {th }}$ stratum in sample sector, casualty cases will be excluded from the count.
Treatment in cases of void strata
A stratum may be void because of the casualty of all the units belonging to the stratum in sample sector. When a stratum is void, then in order to generate estimate pertaining to sample sector, the ‘void’ stratum may be merged with the nearest stratum looking into the description of the 2-digit NIC activity.
Census Sector
Estimates for the census sector are adjusted using direct calibration method with simple ratio adjustments as described below: –
Direct calibration method with simple ratio adjustments
This method utilizes auxiliary information for calibrated weighting adjustments to address survey non-response. Turnover data, available in the sample list, may serve as the auxiliary variable for this purpose.
$w_{t k}=$ calibrated weight of $\mathrm{k}^{\text {th }}$ unit in $\mathrm{t}^{\text {th }}$ stratum
$\hat{Y}=\sum_{t} \sum_{k \in R_{t}} w_{t k} y_{t k} \quad$ is the estimator of population total ${ }^{c} Y=$ $\sum_{k \in U} y_{k}$
$x_{t k}$ is the value of auxiliary variable (turnover) of $k^{\text {th }}$ unit in $t^{\text {th }}$ stratum
${ }^{c} X_{t}=\sum_{k} x_{t k}$
$R_{t}=$ subset comprising of responding units of $\mathrm{t}^{\text {th }}$ stratum in census sector
$w_{t k}$ should be chosen in such a way that
$$
{ }^{c} X_{t}=\sum_{k \in R_{t}} w_{t k} x_{t k}
$$
Using simple ratio adjustment, if $w_{t k}$ is taken as
$$
\begin{gathered}
w_{t k}=\frac{{ }^{c} x_{t}}{\sum_{k \in R_{t}} x_{t k}}, \text { equation (4) holds. } \
\hat{Y}=\sum_{t} \sum_{k \in R_{t}} w_{t k} y_{t k}=\sum_{t}{ }^{c} X_{t} \times \frac{\sum_{k \in R_{t}} y_{t k}}{\sum_{k \in R_{t}} x_{t k}}
\end{gathered}
$$

भारत सरकार
GOVERNMENT OF INDIA
सांख्यिकी और कार्यक्रम कायन्सियन मंत्रालय
MINISTRY OF STATISTICS AND PROGRAMME IMPLEMENTATION
राह्नीय सांख्यिकी कार्यालय
NATIONAL STATISTICS OFFICE