The National Statistical Office (NSO) conducted the Time Use Survey (TUS) in January-December 2024 to gather insights on how individuals allocate their time across various activities. This survey, the second of its kind in India, measures participation and time spent on paid work, unpaid caregiving, volunteering, domestic service, learning, socializing, and leisure. The results, presented in the “Time Use in India, 2024” report, provide data on time allocation across different activities, broken down by gender, age, and location. Key findings show how time is distributed among employment, self-care, domestic duties, and leisure, offering valuable information for policymakers, researchers, and planners to understand and address societal needs and disparities.
SOURCE PDF LINK :
Click to access TUS_Report_2024_28.03.2025F.pdf
Click to view full document content

सत्यमय जयते
भारत में समय का उपयोग,
भारत सरकार
Government of India
सांख्यिकी और कार्यक्रम कार्यान्वयन मंत्रालय
Ministry of Statistics and Programme Implementation
राष्ट्रीय सांख्यिकी कार्यालय
National Statistics Office

सत्यमेव जयते
भारत में समय का उपयोग, 2024
Time Use in India, 2024
समय के उपयोग का सर्वेक्षण
Time Use Survey
जनवरी – दिसम्बर, 2024
January – December, 2024
भारत सरकार
Government of India
सांख्यिकी और कार्यक्रम कार्यान्वयन मंत्रालय
Ministry of Statistics and Programme Implementation
राष्ट्रीय सांख्यिकी कार्यालय
National Statistics Office
प्रस्तावना
राष्ट्रीय सांख्यिकी कार्यालय (एनएसओ) ने जनसंख्या द्वारा की जाने वाली विभिन्न कार्यकतापों में भागीदारी और समय उपयोग के बारे में जानकारी एकत्र करने के लिए जनवरी 2024 में दूसरा अखिल भारतीय समय उपयोग सर्वेक्षण (स. उ. स.) किया। जनवरी-दिसंबर 2024 के दौरान 6 वर्ष और उससे अधिक आयु के व्यक्तियों के लिए समय उपयोग की जानकारी परिवारों से एकत्र की गई। इस सर्वेक्षण में लोगों द्वारा भुगतान किए गए कार्यकतापों, अवैतनिक देखभात कार्यकतापों, अवैतनिक स्वयंसेवी कार्यों, अवैतनिक घरेलू सेवा उत्पादन कार्यकतापों, सीखने, सामाजिक मेतजोल, मनोरंजन कार्यकतापों, स्व-देखभात कार्यकतापों आदि में की गई भागीदारी और बिताए गए समय को मापा गया है।
यह रिपोर्ट सर्वेक्षण का क्षेत्रीय कार्य पूरा होने के तीन महीने के भीतर प्रकाशित की जाती है। यह रिपोर्ट ग्रामीण और शहरी दोनों क्षेत्रों में लिंग, आयु आदि जैसे पृथक्करण के विभिन्र स्तरों पर समय के उपयोग के संकेतकों का अनुमान प्रदान करती है। इनका उपयोग नियोजन, नीति निर्माण, निर्णय समर्थन और विभिन्र विभागों, शिक्षाविदों और शोधकर्ताओं द्वारा आगे के सांख्यिकीय विश्लेषण के लिए इनपुट के रूप में किया जा सकता है।
एनएसओ के घरेलू सर्वेक्षण प्रभाग ने सर्वेक्षण पद्धति का विकास किया, आंकड़ों को संसाधित करके रिपोर्ट तैयार की। क्षेत्र कार्य क्षेत्र संकार्य प्रभाग द्वारा किया गया, जबकि समन्वय और गुणवत्ता नियंत्रण प्रभाग ने इस सर्वेक्षण से संबंधित विभिन्र कार्यकतापों का समन्वय किया।
मैं तकनीकी सताहकार समूह (टीएजी), राष्ट्रीय प्रतिदर्श सर्वेक्षण (NSS) की परिचालन समिति और राष्ट्रीय सांख्यिकी आयोग (एनएससी) के सदस्यों का सर्वेक्षण के विभिन् चरणों में उनके बहुमूल्य मार्गदर्शन के लिए अत्यंत आभारी हूं। मैं इस रिपोर्ट को तैयार करने में शामिल एनएसओ के विभिन्र प्रभागों के अधिकारियों द्वारा किए गए प्रयासों के लिए भी अपनी सराहना व्यक्त करना चाहूंगी। मुझे आशा है कि यह रिपोर्ट योजनाकारों, नीति निर्माताओं, शिक्षाविदों और शोधकर्ताओं के लिए उपयोगी साबित होगी।
$\mathcal{O}_{\text {refuee }}$
The National Statistics Office (NSO) took up the second all-India Time Use Survey (TUS) in January 2024 to collect information on the participation and time disposition in different activities performed by the population. The information on time use was collected for persons of age 6 years and above from the households during January – December 2024. The survey has measured participation and time spent by the persons in paid activities, unpaid caregiving activities, unpaid volunteer work, unpaid domestic service producing activities, learning, socializing, leisure activities, self-care activities, etc.
This report is brought out within a span of three months from the completion of the field work of the survey. This report provides estimates of indicators of time use in both rural and urban areas with different levels of disaggregation like gender, age, etc. These can be used for planning, policy formulation, decision support and as input for further statistical analysis by various Departments, academicians and researchers.
The Household Survey Division (HSD) of NSO undertook the development of survey methodology, processed the data and prepared the report. The field work was carried out by Field Operations Division (FOD) while the Coordination and Quality Control Division (CQCD) coordinated various activities pertaining to this survey.
I am highly thankful to the members of the Technical Advisory Group (TAG), Steering Committee for NSS surveys and the National Statistical Commission (NSC) for their valuable guidance at various stages of the survey. I would also like to place on record my appreciation for the efforts made by officers of different Divisions of the NSO involved in the preparation of this report. I hope this report will be found useful by planners, policy makers, academicians and researchers.
March, 2025

Geeta Singh Rathore
Director General
National Sample Survey
मृख्य बातें
सर्वेक्षण के बारे में
- जनवरी से दिसंबर, 2024 के दौरान समय के उपयोग का सर्वेक्षण (टीयूएस), 2024, दूसरा ऐसा अखिल भारतीय सर्वेक्षण है जिसने विभिन्न गतिविधियों पर लोगों के समय प्रबंधन पर जानकारी एकत्र की।
- कंप्युटर असिस्टेड पर्सनल इंटरव्यूइंग (सीएपीआई पद्धति) के माघ्यम से समय उपयोग पर आंकड़े एकत्र किये गये थे।
- साक्षात्कार की तारीख से एक दिन पूर्व सुबह 4:00 बजे से शुरु होकर साक्षात्कार के दिन सुबह 4:00 बजे तक 24 घंटे की अवधि को शामिल करते हुए समय उपयोग की जानकारी एकत्र की गई थी।
- 24 घंटे की संदर्भ अवधि को प्रत्येक 30 मिनटों के समय के स्लॉट में विभाजित किया गया। प्रत्येक टाइम स्लॉट में, कम से कम 10 मिनट के लिए की गई गतिविधियों को दर्ज किया गया, जो एक समय स्लॉट में अधिकतम 3 गतिविधियों के अधीन था।
- चयनित परिवारों से 6 वर्ष और उससे अधिक आयु के सभी परिवार के सदस्यों से समय उपयोग की जानकारी एकत्र की गई थी।
- सर्वेक्षण के परिणामों के आधार पर, ‘भारत में समय का उपयोग, 2024’ शीर्षक वाली रिपोर्ट प्रकाशित की गई है।
व्याप्टित: इस सर्वेक्षण में अंडमान और निकोबार द्वीप समूह के कुछ दुर्गम गांवों को छोड़कर संपूर्ण भारतीय संघ को शामिल किया गया।
9,969
सर्वेक्षण किया गया FSI
यामीण (गाँव): 5948
शहरी(यूएफएस ब्लॉक): 4020
$1,39,487$
सर्वेक्षण किए गए परिवार यामीण: 83,247
शहरी: 54,240
$4,54,192^{*}$
6 वर्ष और उससे अधिक आयु के व्यक्ति
पुरुष: $2,28,576$
महिला: $2,25,545$
*ट्रांसजेंडर शामिल हैं
भारत में समय का उपयोग, 2024
- विभिन्न गतिविधियों में प्रति दिन समय उपयोग के अनुमान विश्रिन्न गतिविधियों में प्रतिभागियों को घ्यान में रखते हुए प्रस्तुत किए जाते हैं।
- विश्रिन्न गतिविधियों में एक दिन में प्रत्येक व्यक्ति के लिए उपलब्ध 1440 मिनट के कुल समय के वितरण को समझने के लिए गतिविधियों में उनकी सहभागिता के बावजूद सभी व्यकितयों पर विचार करते हुए प्रति दिन समय उपयोग के कुछ अनुमान भी प्रस्तुत किए जाते हैं।
- मुख्य बातों में, समय स्लॉट में दर्ज की गई सभी गतिविधियों को घ्यान में रखते हुए परिणाम को अखिल भारतीय स्तर पर प्रस्तुत किए गए हैं।
- सर्वेक्षण से प्राप्त कुछ अनुमानों की परिभाषा इस प्रकार है:
| सहभागिता द्र | |
|---|---|
| संदर्भ अवधि के 24 घंटों के | दाँगान उस गतिविधि को करने |
| दौरान उस गतिविधि को करने | वाले विशिष्ट श्रेणियों (जैसे कि |
| वाले विशिष्ट श्रेणियों (जैसे कि | पुरुष, महिला आदि) के व्यकितयों |
| पुरुष, महिला आदि) के व्यकितयों | का प्रतिशत |
प्रति प्रतिभागी एक दिन में
लगाया गया औंसत समय
उन व्यक्तियों द्वारा किसी गतिविधि में एक दिन में लगाया गया औसत समय जो उस गतिविधि में भाग ले रहे हैं।
प्रति व्यक्ति एक दिन में लगाया गया औंसत समय
यह विशिष्ट श्रेणी के सभी व्यक्तियों पर विचार करके निकाला जाता है, भले ही उन्होंने गतिविधियों में हिस्सा लिया हो या नहीं।
विभिन्न गतिविधियों पर एक दिन में
लगए गए समय का वितर
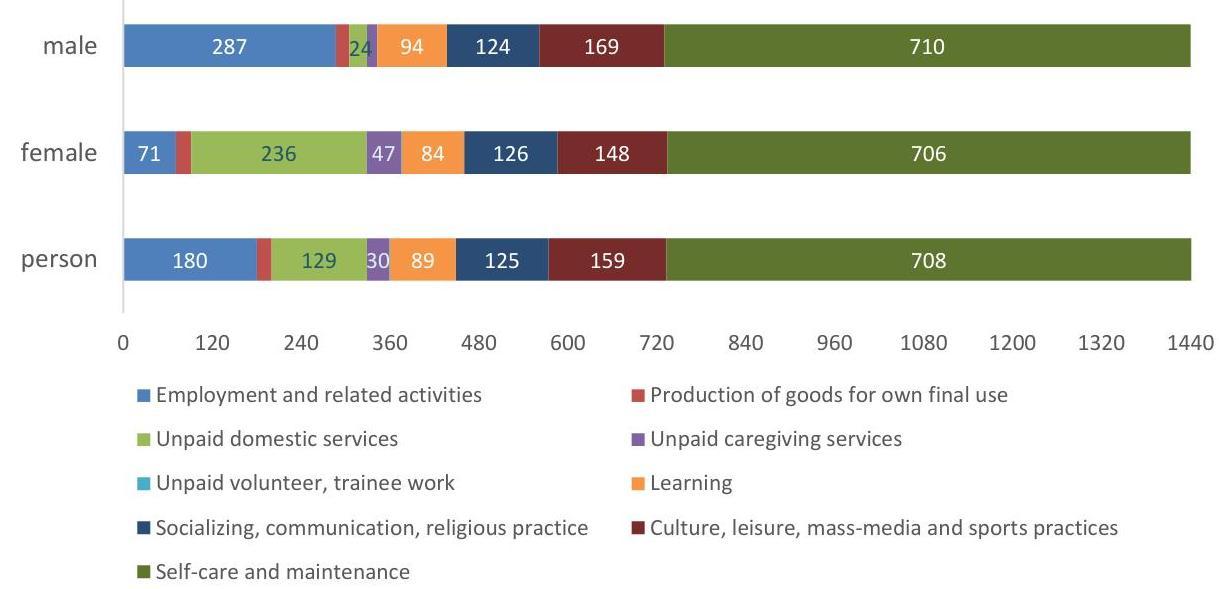
सभी व्यक्तियों को ध्यान में रखते हुए, गतिविधि में उनकी सहभागिता की परवाह किए बिना, विभिन्न गतिविधियों में एक दिन में लगाया गया औसत समय नोचे दिया गया है :
6 वर्ष और उससे अधिक आयु के प्रत्येक व्यक्ति द्वारा एक दिन में विभिन्न गतिविधियों में लगाया गया औसत
समय (मिनटों में)
| गतिविधि का विवरण | एक दिन में लगाया गया औसत समय | ||
|---|---|---|---|
| पुरुष | महिला | व्यक्ति | |
| रोजगार और संबंधित गतिविधियों | 287 | 71 | 180 |
| स्वयं के उपयोग के लिए माल का उत्पादन | 18 | 21 | 20 |
| परिवार के सदस्यों के लिए अप्रदत पारिवारिक सेवाएं | 24 | 236 | 129 |
| परिवार के सदस्यों के लिए अप्रदत देखभाल सेवाएं | 13 | 47 | 30 |
| अप्रदत स्वयंसेवक, प्रशिक्षु और अन्य अप्रदत कार्य | 1 | 1 | 1 |
| अधिगम | 94 | 84 | 89 |
| सामाजिककरण और संचार, सामुदायिक सहभागिता और धार्मिक अक्यास | 124 | 126 | 125 |
| संस्कृति,अवकाश, जन-संचार और खेल अभ्यास | 169 | 148 | 159 |
| स्वयं की देखभाल और रखरखाव | 710 | 706 | 708 |
| कुल (मिनट में) | 1440 | 1440 | 1440 |
उपर दी गई तालिका विभिन्न गतिविधियों पर एक दिन में 24 घंटे (1440 मिनट) का वितरण दिखाती है। निम्नलिखित तीन चार्ट 6 वर्ष और उससे अधिक आयु के व्यक्तियों के लिए विभिन्न गतिविधियों में एक दिन में बिताए गए समय की प्रतिशतता दर्शाती है।
विश्रिन्न गतिविधियों में सहभागिता एवं औसतन लगाए गए समय
01
रोजगार और संबंधित गतिविधियां
| आयु वर्ग: 15-59 वर्ष | 6 वर्ष और उससे अधिक |
|---|---|
| यामीण: $50.1 \%$ | पुरुष : $75.0 \%$ |
| शहरी: $49.6 \%$ | महिला: $25.0 \%$ |
| All: $49.9 \%$ | महिल: $20.7 \%$ |
| All: $40.9 \%$ |
| 15-59 वर्ष | 6 वर्ष और उससे अधिक |
|---|---|
| यामीण: 424 mins | पुरुष: 480 mins |
| शहरी: 494 mins | महिला: 344 mins |
| All: 446 mins |
| यामीण: 417 mins | पुरुष: 60.8\% |
|---|---|
| शहरी: 490 mins | महिला: 341 mins |
| All: 440 mins |
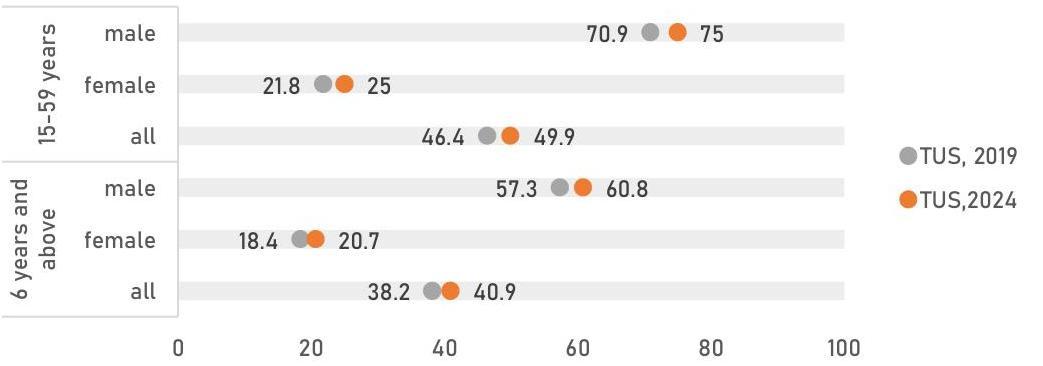
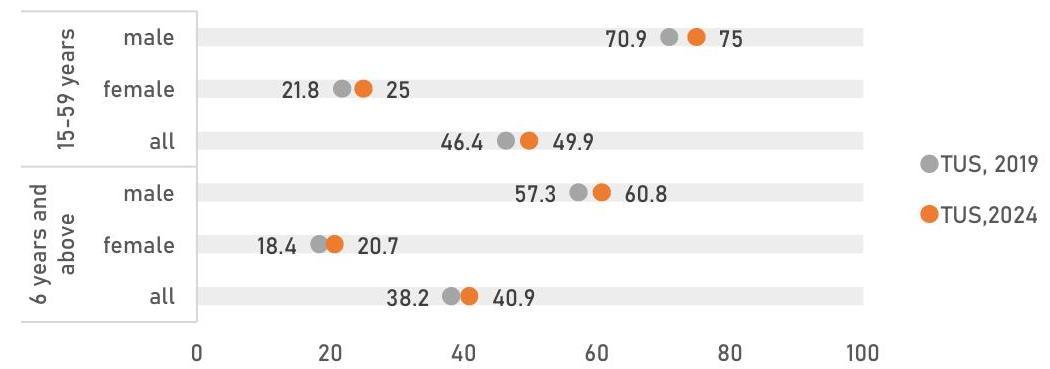
टीयूएस, 2019 और टीयूएस, 2024 के दौरान रोजगार और संबंधित गतिविधियों में सहभागिता दर (\%)
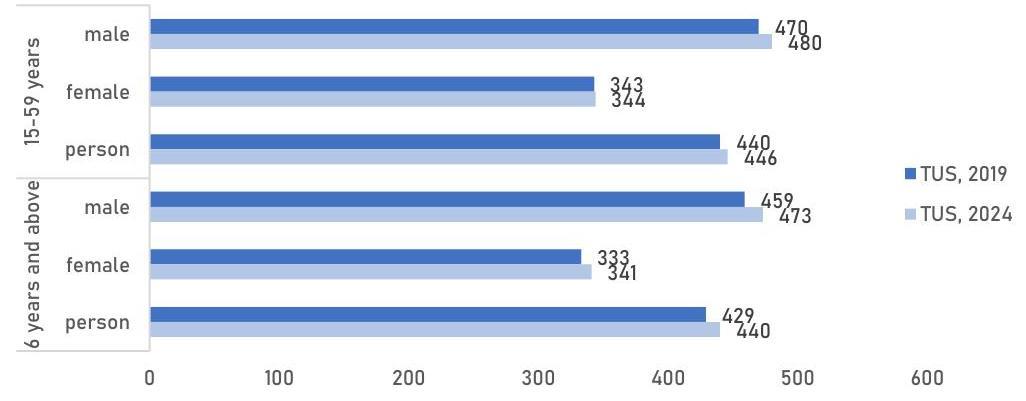
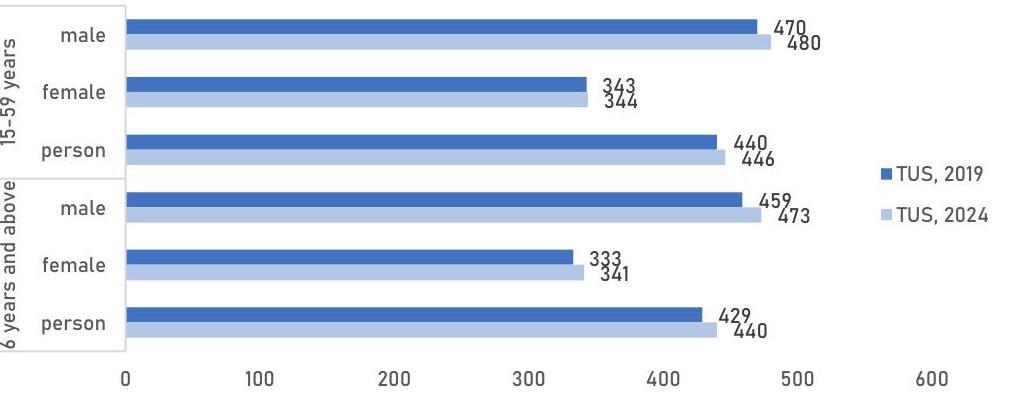
टीयूएस, 2019 \& टीयूएस, 2024 के दौरान रोजगार और संबंधित गतिविधियों में प्रत्येक प्रतिभागी द्वारा एक दिन में लगाया गया समय
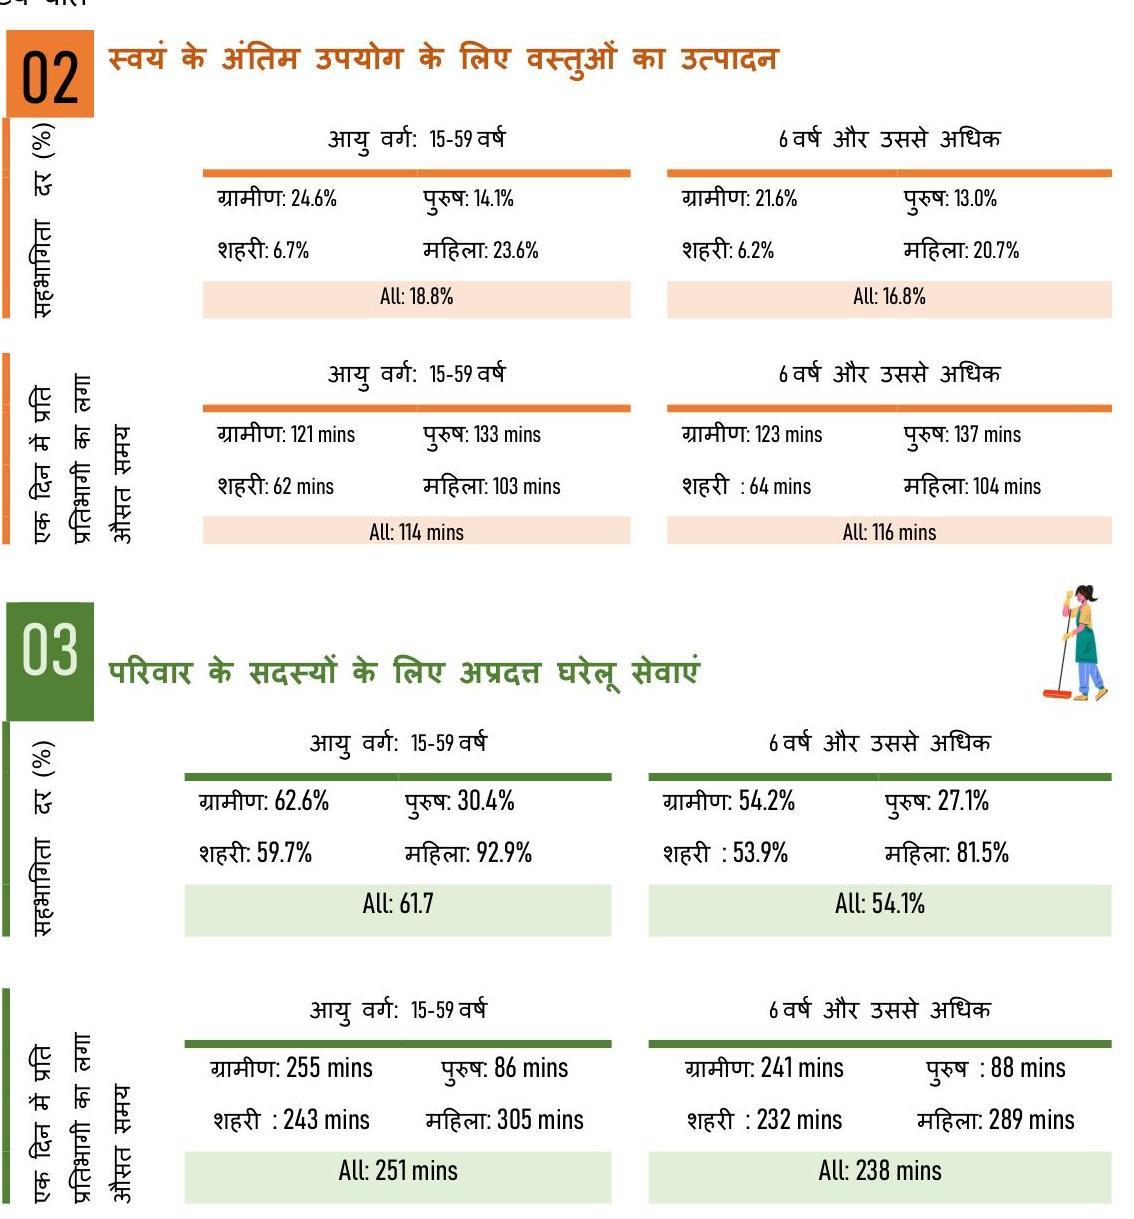
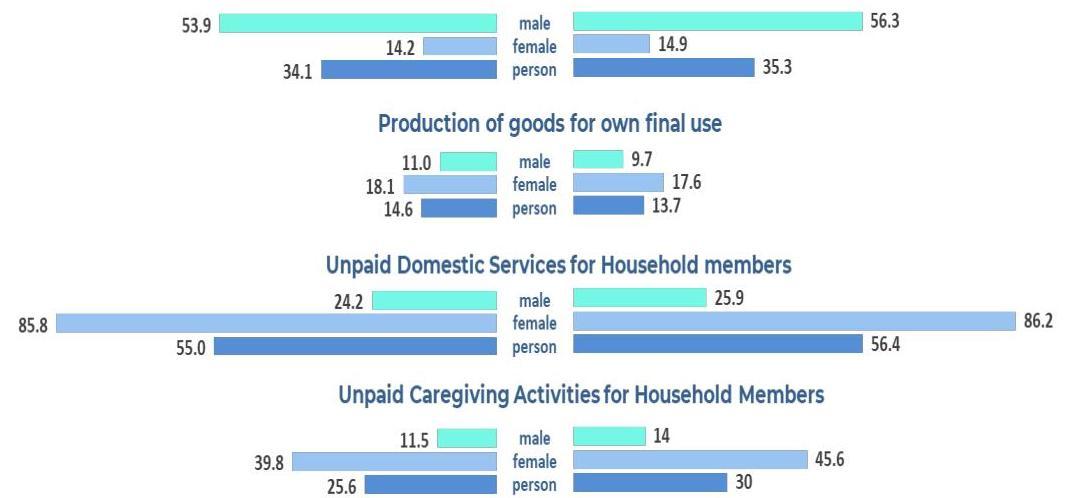
- सामान्य दिनों में परिवार के सदस्यों के लिए घरेलू सेवाओं में $26.4 \%$ पुरुष तथा $83.1 \%$ महिलाओं ने भाग लिया। ‘अन्य दिवस’ (अर्थात् साप्ताहिक छुट्टी के दिन, अवकाश) में, ऐसे गतिविधियों में पुरुष और महिलाएं की सहभागिता क्रमशः $32.2 \%$ व $67.5 \%$ थी।
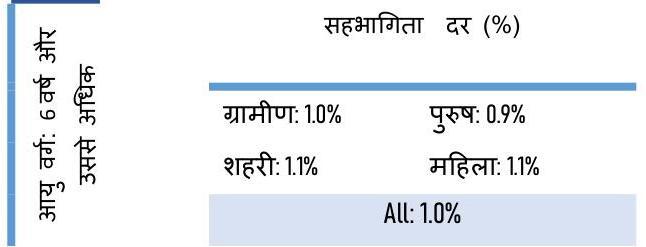
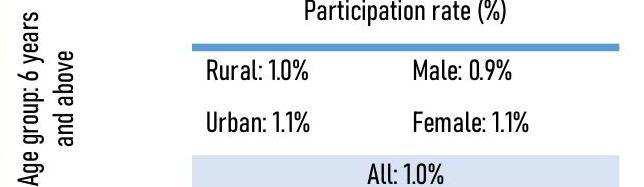
अप्रदत्त स्वयंसेवक, प्रशिक्षु और अन्य अप्रदत्त कार्य
एक दिन में प्रति प्रतिभागी का लगा औसत समय
| यामीण: $10 \%$ | पुरुष: $0.9 \%$ |
|---|---|
| शहरी: $11 \%$ | महिला: $11 \%$ |
| All: $1.0 \%$ |
| यामीण: 411 mins | पुरुष: 411 mins |
|---|---|
| शहरी: 417 mins | महिला: 415 mins |
| All: 413 mins |
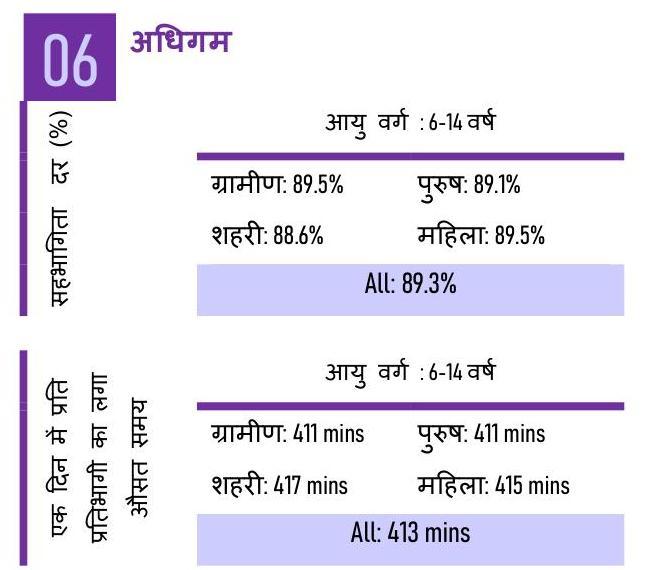
6-14 वर्ष के बच्चों के मध्य सीखने की गतिविधियों में सहभागिता वर्ष 2019 के दौरान $85.9 \%$ से बढ़कर वर्ष 2024 के दौरान $89.3 \%$ हो गई। इस आयु वर्ग में महिलाओं की सहभागिता $85.6 \%$ से बढ़कर $89.5 \%$ हो गई।
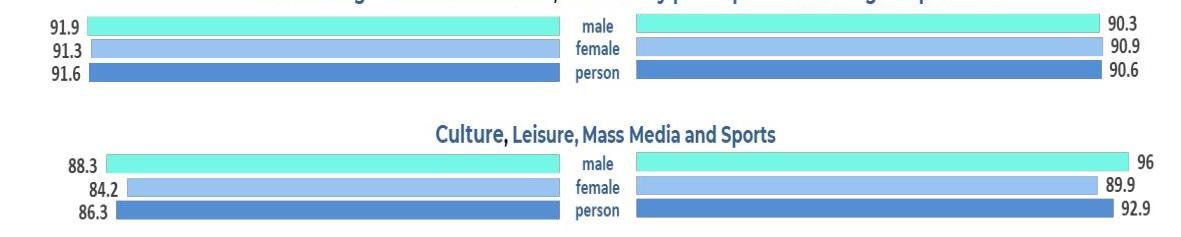
सामाजीकरण व संचार, सामुदायिक सहभागिता तथा धार्मिक प्रथाएं
| 6 वर्ष और उससे अधिक | |
|---|---|
| यामीण: $90.1 \%$ | पुरुष : $89.8 \%$ |
| शहरी: $90.8 \%$ | महिला : $90.7 \%$ |
| All: $90.3 \%$ |
6 वर्ष और उससे अधिक
यामीण : 142 mins पुरुष : 138 mins
शहरी : 131 mins महिला : 139 mins
All: 138 mins
6 वर्ष और उससे अधिक
यामीण: 90.1\% पुरुष : 89.8\%
शहरी: 90.8\% महिला : 90.7\%
All: $90.3 \%$
6 वर्ष और उससे अधिक
यामीण : 142 mins पुरुष : 138 mins
शहरी : 131 mins महिला : 139 mins
All: 138 mins
6-14 वर्ष के बच्चों के मध्य सीखने की गतिविधियों में सहभागिता वर्ष 2019 के दौरान $85.9 \%$ से बढ़कर वर्ष 2024 के दौरान $89.3 \%$ हो गई। इस आयु वर्ग में महिलाओं की सहभागिता $85.6 \%$ से बढ़कर $89.5 \%$ हो गई।
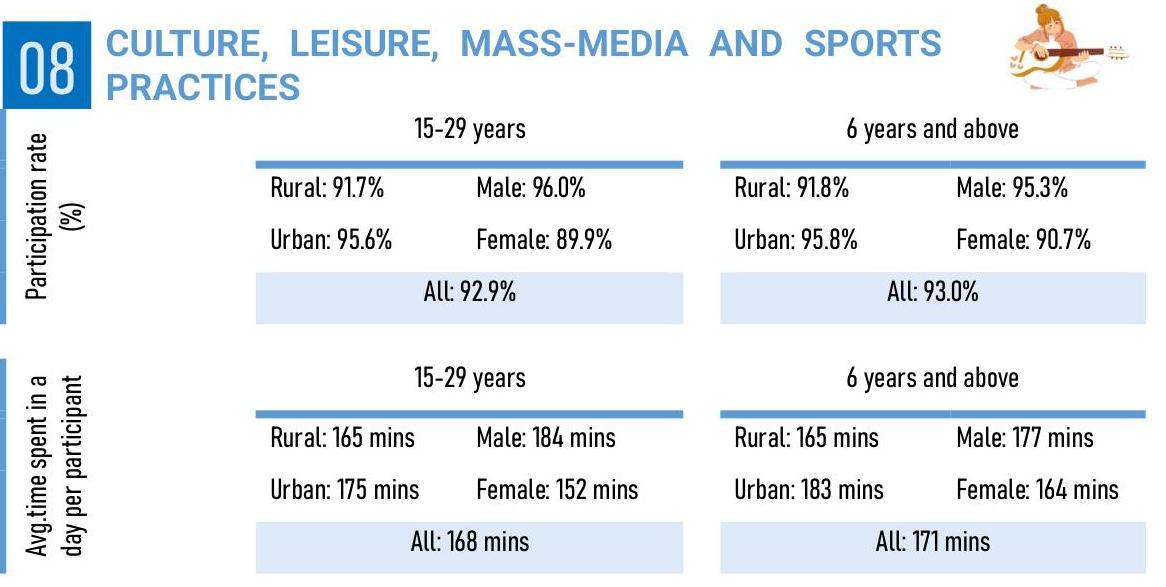
| 6 वर्ष और उससे अधिक | |
|---|---|
| यामीण: 91.7\% | पुरुष: 96.0\% |
| शहरी: 95.6\% | महिला: 89.9\% |
| All: 92.9\% | |
| 6 वर्ष और उससे अधिक | |
| यामीण: 165 mins | पुरुष: 184 mins |
| शहरी: 175 mins | महिला: 152 mins |
| All: 168 mins |
| 6 वर्ष और उससे अधिक | |
|---|---|
| यामीण: 91.8\% | पुरुष: 95.3\% |
| शहरी: 95.8\% | महिला: 90.7\% |
| All: 93.0\% | |
| 6 वर्ष और उससे अधिक | |
| यामीण: 165 mins | पुरुष: 177 mins |
| शहरी: 183 mins | महिला: 164 mins |
| All: 171 mins |
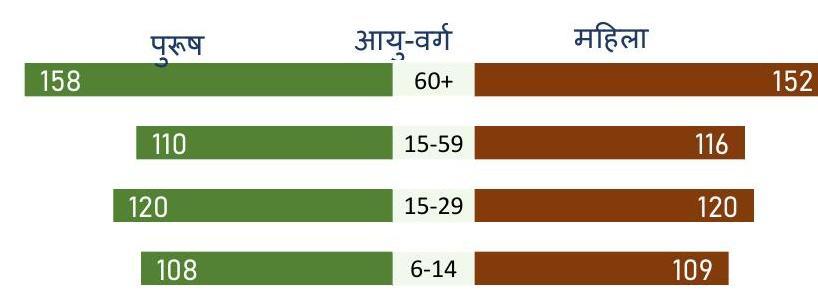
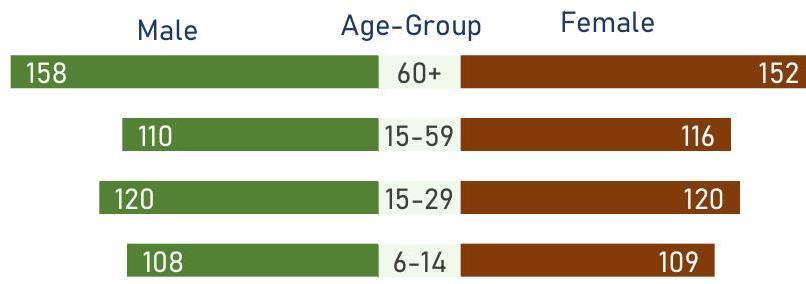
प्रति प्रतिभागी का जन-संचार माघ्यम प्रयोग में लगा औसत समय (मिनट में)
09
स्व-देखभाल और रखरखाव
6 वर्ष और उससे अधिक उम के एक दिन में प्रति प्रतिभागी का लगा औसत समय
| यामीण: 711 mins | पुरुष: 718 mins |
|---|---|
| शहरी: 701 mins | महिला: 706 mins |
| All: 708 mins |
- स्व-देखभाल और रखरखाव में मानव की आवश्यक गतिविधियों जैसे कि खाना, सोना आदि शामिल हैं ।
- ऐसी गतिविधियों में सहभागिता दर $100 \%$ है ।
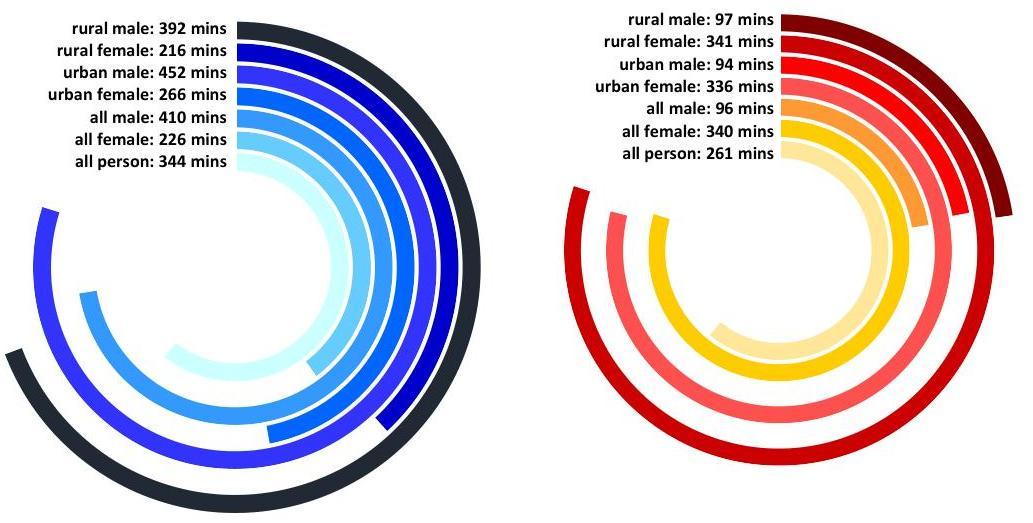
अप्रदत्त एवं प्रदत्त में लगाया औसत समय तथा सहभागिता
प्रदत्त एवं अप्रदत्त गतिविधियों में 6 वर्ष और उससे अधिक आयु के व्यक्तियों का सहभागिता दर (\%)
प्रदत्त गतिविधियों में 6 वर्ष और उससे अधिक आयु के एक दिन में प्रति प्रतिभागी का लगा औसत समय (मिनटों में)
अप्रदत्त गतिविधियों में 6 वर्ष और उससे अधिक आयु के एक दिन में प्रति प्रतिभागी का लगा औसत समय
(मिनटों में)
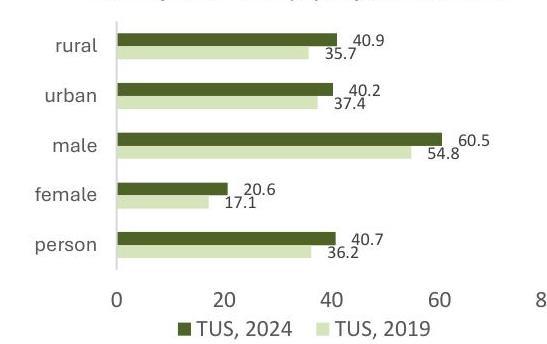
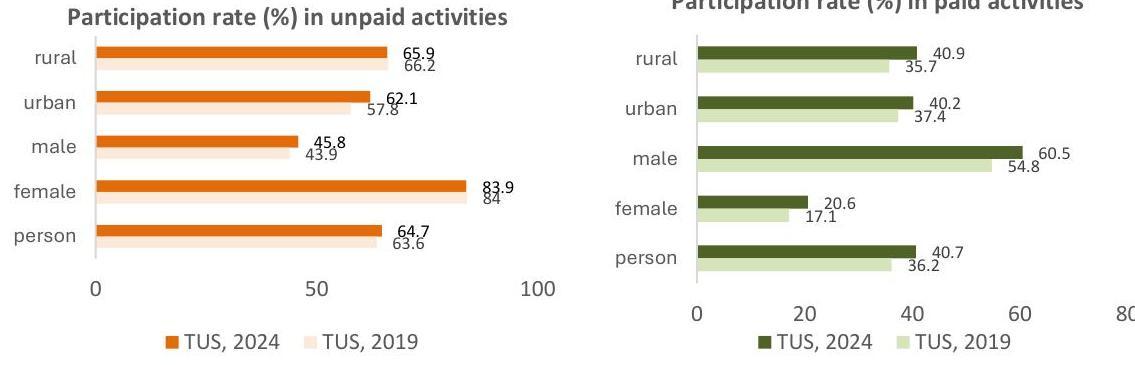
टी यू एस, 2019 और टी यू एस, 2024 के दौरान 6 वर्ष और उससे अधिक आयु के व्यक्तियों द्वारा अप्रदत्त और भुगतान गतिविधियों में सहभागिता
Participation rate (\%) in unpaid activities
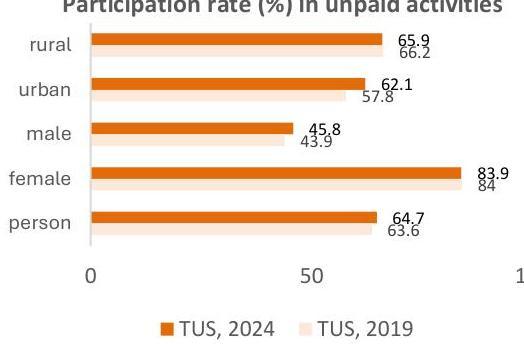
Participation rate (\%) in paid activities
एसएनए और गैर-एसएनए में सहभागिता
और लगाया गया समय
एसएनए उत्पादन और गैर-एसएनए उत्पादन गतिविधियों में 6 वर्ष और उससे अधिक आयु के व्यक्तियों का सहभागिता दर (\%)
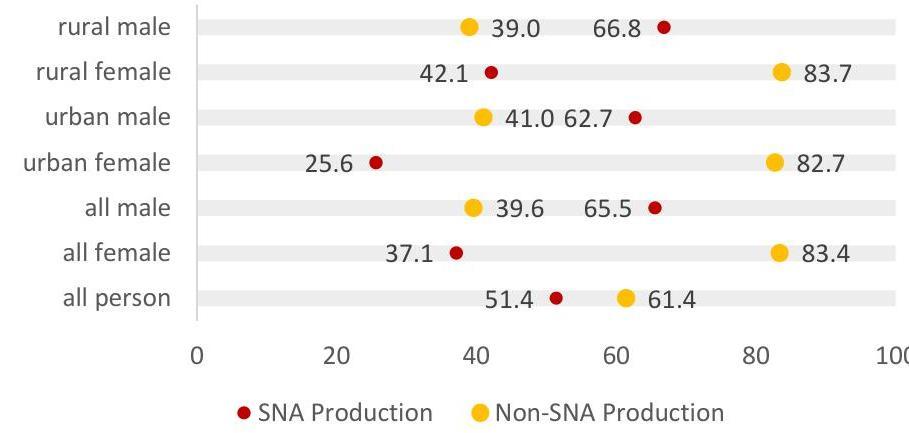
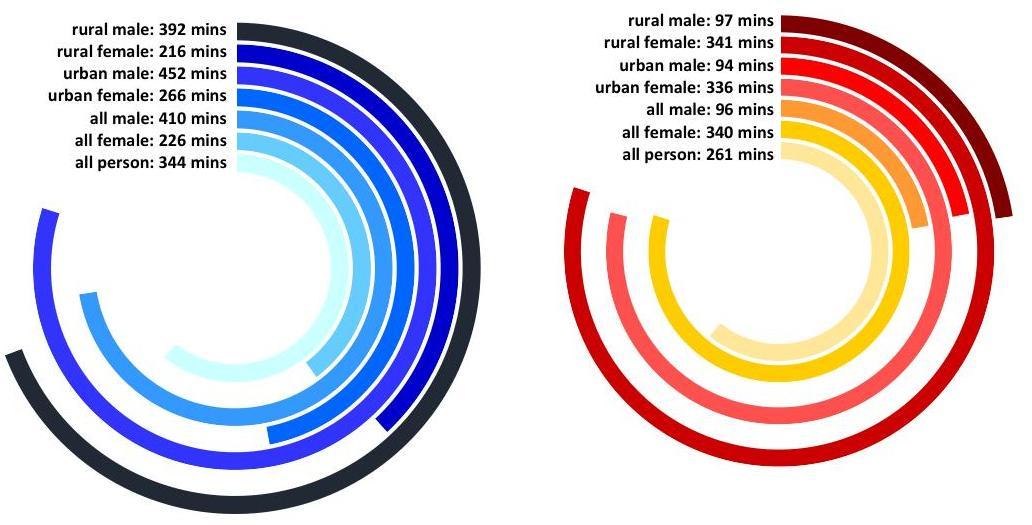
एसएनए उत्पादन गतिविधियों में 6 वर्ष और उससे अधिक आयु के एक दिन में प्रति प्रतिभागी का लगा औसत समय (मिनटों में)
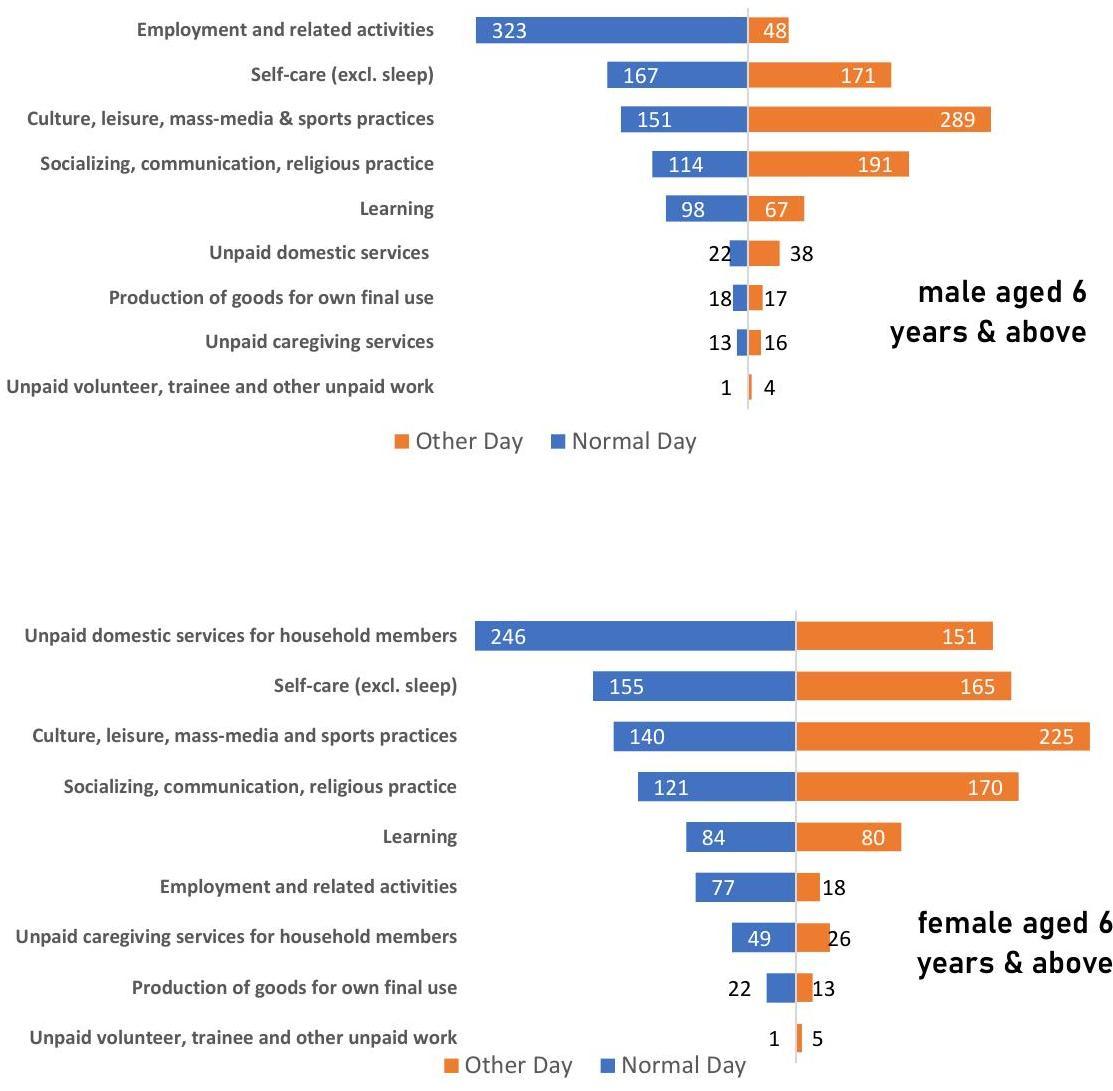
सामान्य दिवस तथा अन्य दिवस के दौरान लगाए
गए समय
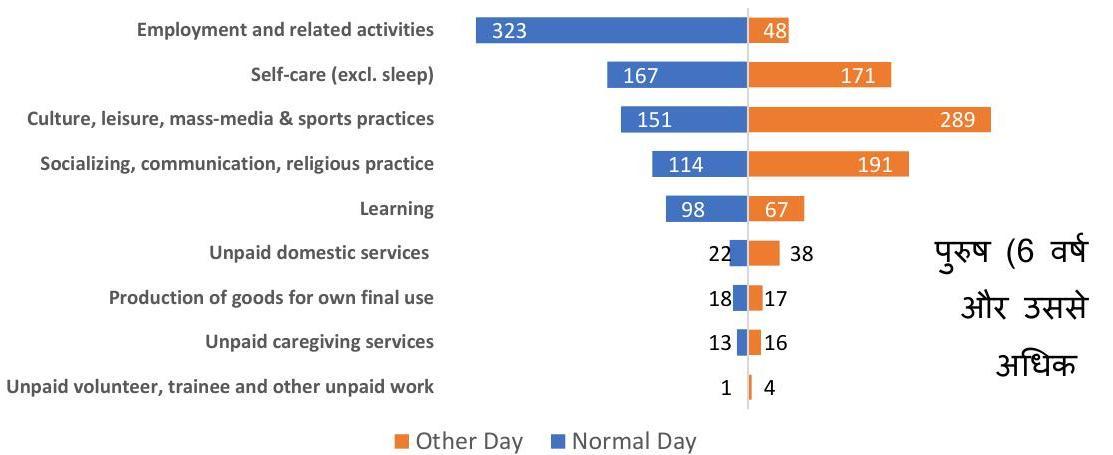
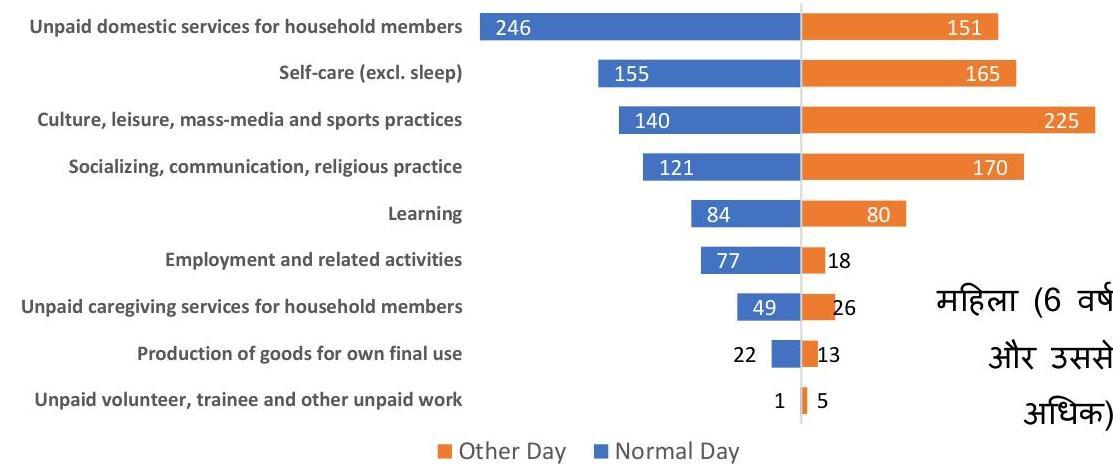
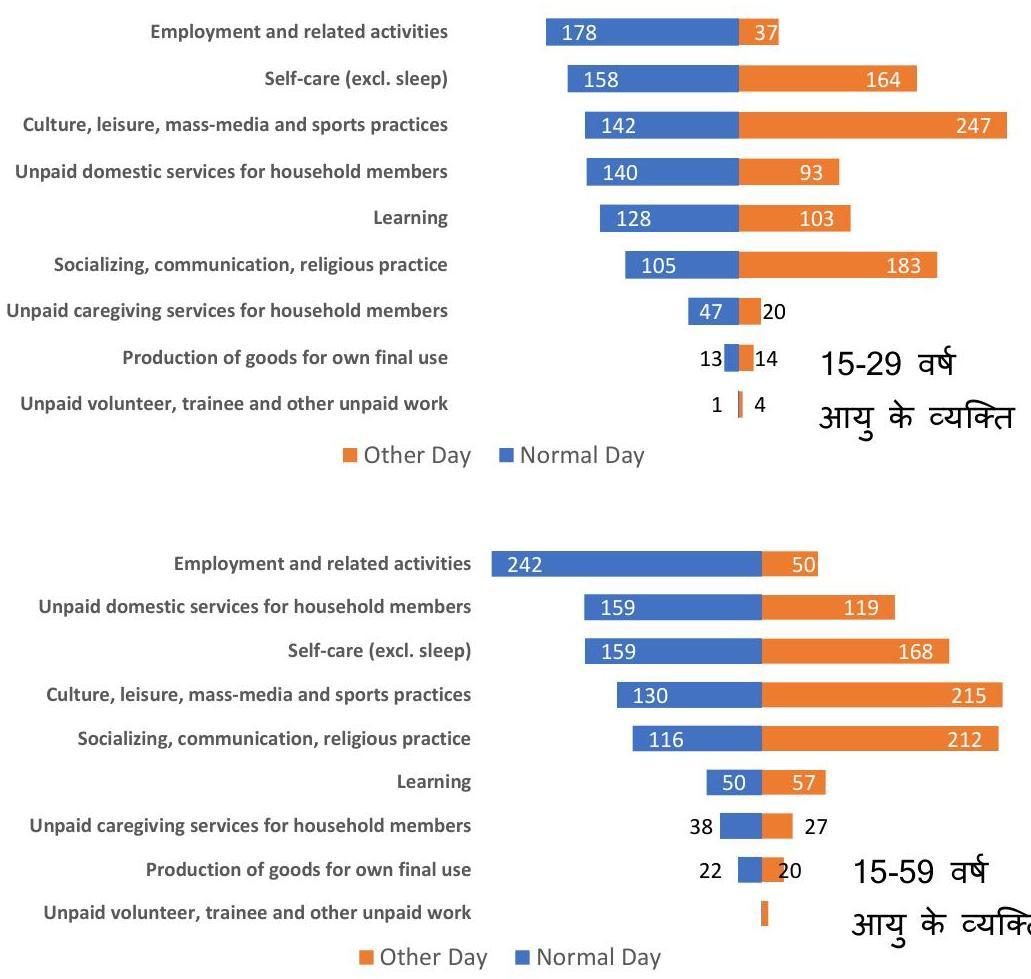
सामान्य दिन वे दिन होते हैं जिन पर किसी परिवार का सदस्य ज्यादातर अपना/अपनी नियमित गतिविधियों का पालन करता है, जबकि जिस दिन किसी भी कारण से परिवार के सदस्य की नियमित गतिविधियों को बदल दिया जाता है, उसे ‘अन्य दिन’ (साप्ताहिक छुट्टी, छुट्टियां, छुट्टी के दिन, आदि) के रूप में माना जाता है।
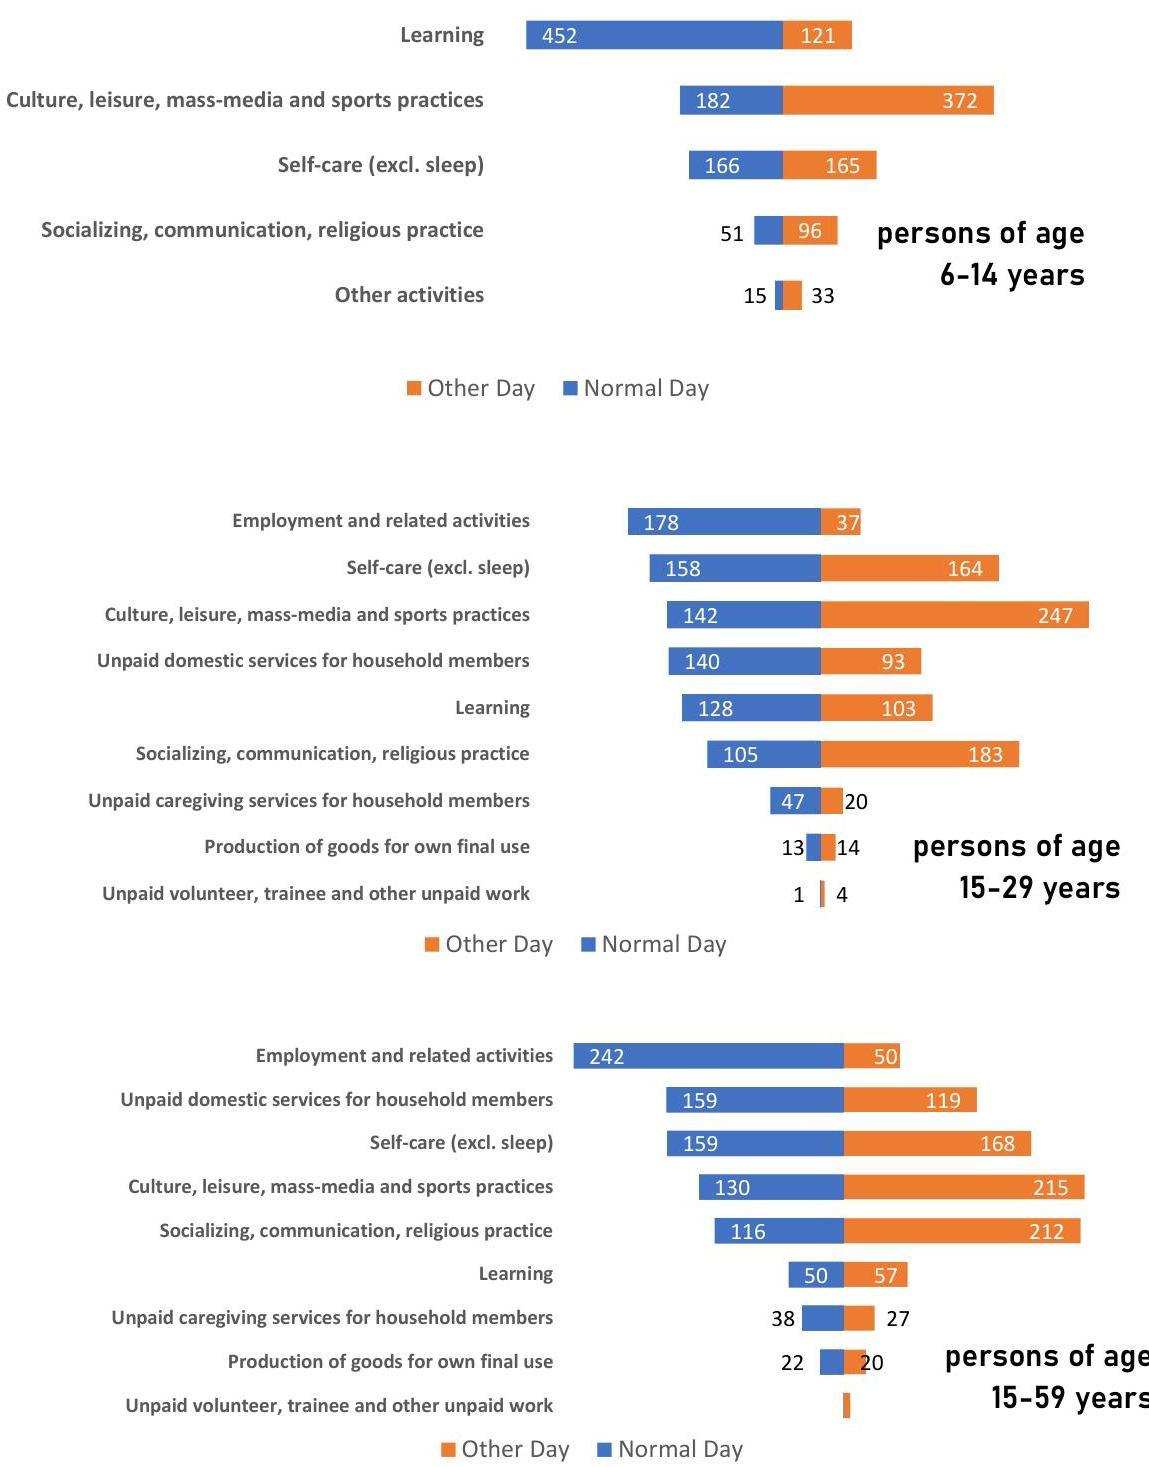
जनसंख्या के विभिन्न वर्गों के लिए सामान्य दिनों और अन्य प्रकार के दिनों में प्रति व्यक्ति समय का प्रबंधन को निम्नलिखित चार्ट में दर्शाया गया है। बाईं ओर दिखाई गई गतिविधियों को एक सामान्य दिन में प्रति व्यक्ति बिताए गए समय के घटे हुए क्रम में व्यवस्थित किया जाता है।
सामान्य दिन और अन्य प्रकार के दिन के दौरान प्रति व्यक्ति एक दिन में लगाया गया औसत समय (मिनट)
Learning
182
Culture, leisure, mass-media and sports practices
Self-care (excl. sleep)
Socializing, communication, religious practice
Other activities
182
160
165
$51 \begin{array}{ll}56 & 6-14 \ 15 & 33\end{array}$ and
54
51
56
51
100
105
13
14
11
15-29 वर्ष
आयु के व्यक्ति
- Other Day Normal Day
भारतीय जनसंख्या द्वारा समय के उपयोग में कुछ अंतर्दृष्टि
15-59 वर्षो के आयु वर्ग के पुरुष यात्री (रोज़गार संबंधी गतिविधियों के लिए)एक दिन में औसतन 77 मिनट यात्रा में लगाते हैं, जबकि इसकी तुलना में महिला समकक्षों द्वारा 67 मिनट ही लगाई जाती है।

6-14 वर्षो के आयु वर्ग के बच्चों ने ऐसी गतिविधियों में भाग लेते हुए पाठ्येतर गतिविधियों में 61 मिनट लगाये। 15-29 वर्ष के आयु वर्ग के युवा प्रतिभागियों ने औसतन 74 मिनट पाठ्येतर गतिविधियों लगाये।
15-29 वर्षो के आयु वर्ग के लगभग $14.9 \%$ पुरुष तथा $3.9 \%$ महिलाओं ने एक दिन में खेलकूद एवं व्यायाम गतिविधियों में भाग लिया, जो औसतन क्रमशः 64 मिनट और 46 मिनट थे। यामीण और शहरी क्षेत्रों में खेलकूद एवं व्यायाम गतिविधियों में भाग लेने वाले 6-14 वर्ष की
उम्र के बच्चों ने औसतन क्रमशः 83 मिनट तथा 68 मिनट लगाये।

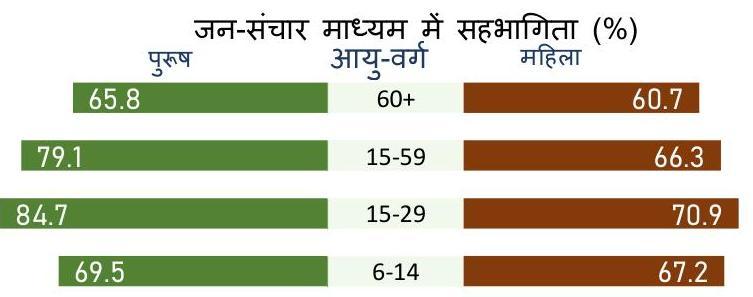
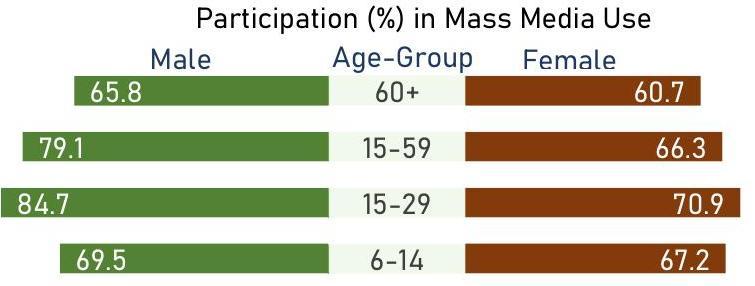
शहरी क्षेत्रों में 15-29 वर्षो के आयु वर्ग के $87.4 \%$ युवा लोगों और यामीण क्षेत्रों में $73.4 \%$ ने एक दिन में जनसंचार माध्यम का उपयोग करने की सूचना प्रदान की। उन्होंने जनसंचार माध्यम का उपयोग करने में क्रमशः 126 मिनट तथा 116 मिनट लगाये।
6 वर्ष तथा उससे अधिक आयु के लोग अपने आशित वयस्क घरेलू सदस्यों की देखभाल करते हुए एक दिन में लगभग 89 मिनट लगाते हैं। पुरुष प्रतिभागियों ने ऐसी देखभाल गतिविधियों में औसतन 85 मिनट लगाये, जबकि महिला प्रतिभागियों ने 91 मिनट लगाये।

6 वर्ष तथा उससे अधिक आयु के यामीण लोगों ने एक दिन में सामाजिकता एवं संचार में लगभग 123 मिनट लगाए, जबकि उनके शहरी समकक्षों ने 110 मिनट लगाये। पुरुष प्रतिभागियों ने एक दिन में 121 मिनट लगाये, जबकि महिला प्रतिभागियों ने 117 मिनट लगाये।
6-14 वर्ष की आयु के लगभग $71.6 \%$ यामीण बच्चों और $68.8 \%$ शहरी बच्चों ने संदर्भ दिवस में औपचारिक शिक्षा से संबंधित अधिगम गतिविधियों में भाग लेने की सूचना दी, प्रत्येक श्रेणी द्वारा एक दिन में लगभग 312 मिनट लगाए। औपचारिक शिक्षा से संबंधित सीखने की गतिविधियों में युवा प्रतिभागियों (15-29 वर्ष की आयु) ने औसतन एक दिन में लगभग

308 मिनट लगाए।
76.3 \% महिलाएं खाद्य और भोजन प्रबंधन तथा उसकी तैयारी की गतिविधियों में शामिल रही और दिनभर में लगभग 209 मिनट लगाये। ऐसी गतिविधि में पुरुषों की सहभागिता 6.2\% थी, जो एक दिन में लगभग 87 मिनट लगाए।
संदर्भ दिवस में अपने परिवार के लिए बच्चों की देखभाल और निर्देश से संबंधित गतिविधियों में $32.8 \%$ महिलाएं और $17 \%$ पुरुष दर्ज किए गये। ऐसी गतिविधियों में प्रतिभागियों द्वारा लगाए गए समय महिला और पुरुष के लिए क्रमशः 136 मिनट और 73 मिनट था।

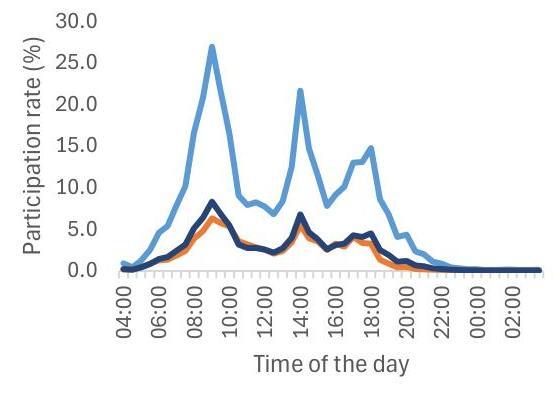
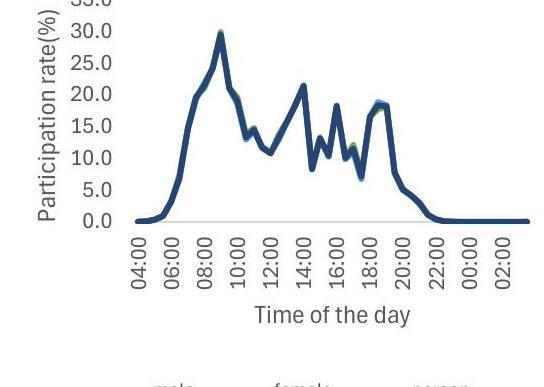
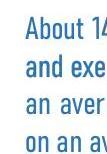
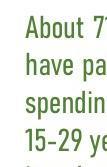
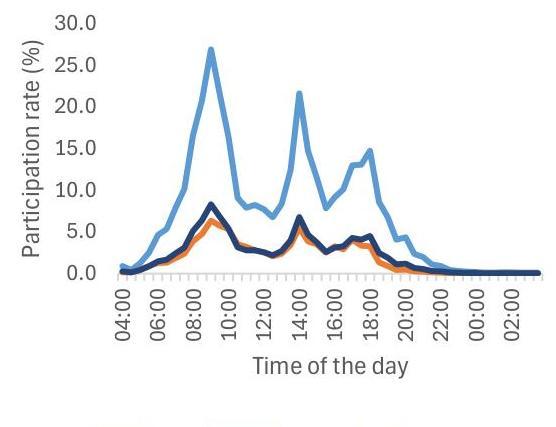
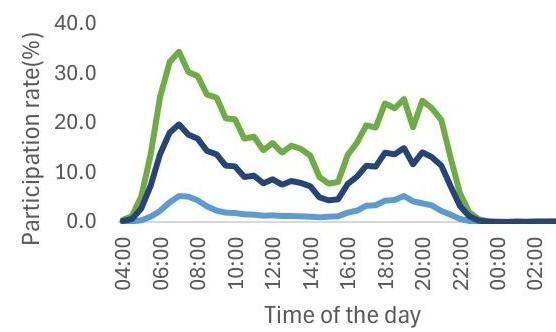
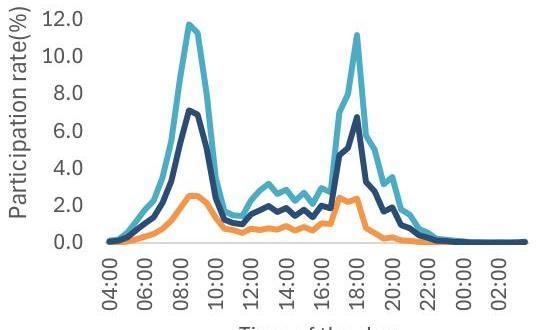
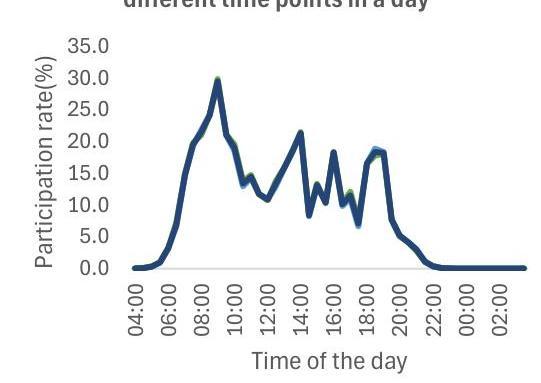
एक दिन के भिन्न-भिन्न समय अवधि के गतिविधियों में सहभागिता
समय उपयोग सर्वेक्षण से दिन की विभिन्न अवधि के दौरान विभिन्न गतिविधियों में लोगों की सहभागिता देखी जा सकती है। निम्नलिखित आंकड़े दिन के विभिन्न समय अवधि के दौरान जनसंख्या की कुछ श्रेणियों के बीच कुछ विशिष्ट गतिविधियों में सहभागिता दर का एक सचित्र दृश्य प्रस्तुत करते हैं।
Percentage of persons of age 15-59 years participating in employment and related activities at different time points in a day
Percentage of persons of age 6 years and above participating in unpaid domestic and caregiving activities for household members at different time points in a day
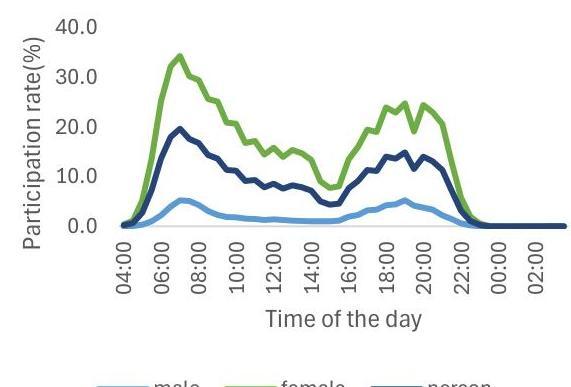
Percentage of persons of age 15-59 years commuting (for employment) at different time points in a day
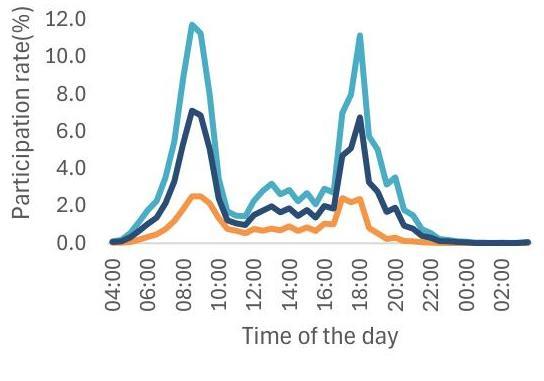
Percentage of persons of age 6-14 years participating in Learning activities at different time points in a day
HIGHLIGHTS
About the Survey
The Time Use Survey (TUS), 2024, conducted during January to December 2024, is the second such allIndia survey that collected information on time disposition of Indian people on different activities.
Data on time use was collected through computer assisted personal interviewing (CAPI) method.
Information on time use was collected covering a period of 24 hours starting from 4:00 A.M. on the day before the date of interview to 4:00 A.M. on the day of interview.
- The reference period of 24 hours was divided into time slots of 30 minutes each. In each time slot, activities performed for at least 10 minutes were recorded, subject to maximum 3 activities in a time slot.
- Time use information was collected from all household members of age 6 years and above from the selected households.
Based on the results of the survey, the Report titled ‘Time Use in India, 2024’ is brought out.
Coverage: The survey covered the whole of the Indian Union except some inaccessible villages in A\&N Islands
9,969
Surveyed FSU
Rural (villages): 5949
Urban (UFS Blocks): 4020
$1,39,487$
Surveyed Households
Rural: 83,247
Urban: 56,240
$4,54,192^{*}$
persons of age 6 years and above
Male: 2,28,576
Female: 2,25,565
*Includes transgender
Time Use in India, 2024
Estimates of time use per day in different activities are presented considering the participants in different activities.
- Some estimates of time use per day are also presented considering all persons irrespective of their participation in activities to understand the distribution of total time of 1440 minutes available for each person in a day in different activities.
- In the Highlights, the results have been presented at all-India level considering all the activities reported in the time slots.
- Definition of some estimates obtained from the survey are:
PARTICIPATION RATE
percentage of persons of specific categories (say male, female etc) performing that activity during the 24 hours of the reference period
AVERAGE TIME SPENT IN A DAY PER PARTICIPANT
average time spent in a day in an activity by those persons who are participating in that activity.
AVERAGE TIME SPENT IN A DAY PER PERSON
this is derived by considering all the persons of the specific category irrespective of whether they performed the activities or not.
DISTRIBUTION OF TIME SPENT IN A DAY OVER DIFFERENT ACTIVITIES
Average time spent in a day in different activities considering all the person, irrespective of their participation in the activity, is given below.
| Average time (in minutes) spent in different activities in a day per person of age 6 years and above | |||
|---|---|---|---|
| Description of the activity | average time spent in a day | ||
| male | female | person | |
| Employment and related activities | 287 | 71 | 180 |
| Production of goods for own final use | 18 | 21 | 20 |
| Unpaid domestic services for household members | 24 | 236 | 129 |
| Unpaid caregiving services for household members | 13 | 47 | 30 |
| Unpaid volunteer, trainee and other unpaid work | 1 | 1 | 1 |
| Learning | 94 | 84 | 89 |
| Socializing and communication, community participation and religious | 124 | 126 | 125 |
| practice | |||
| Culture, leisure, mass-media and sports practices | 169 | 148 | 159 |
| Self-care and maintenance | 710 | 706 | 708 |
| Total (in minutes) | 1440 | 1440 | 1440 |
The table above shows the distribution of 24 hours ( 14.40 minutes) in a day over different activities. Following three charts give the percentage of time spent in a day in different activities for persons of age 6 years and above.
PARTICIPATION AND AVERAGE TIME SPENT IN DIFFERENT ACTIVITIES
01 EMPLOYMENT AND RELATED ACTIVITIES
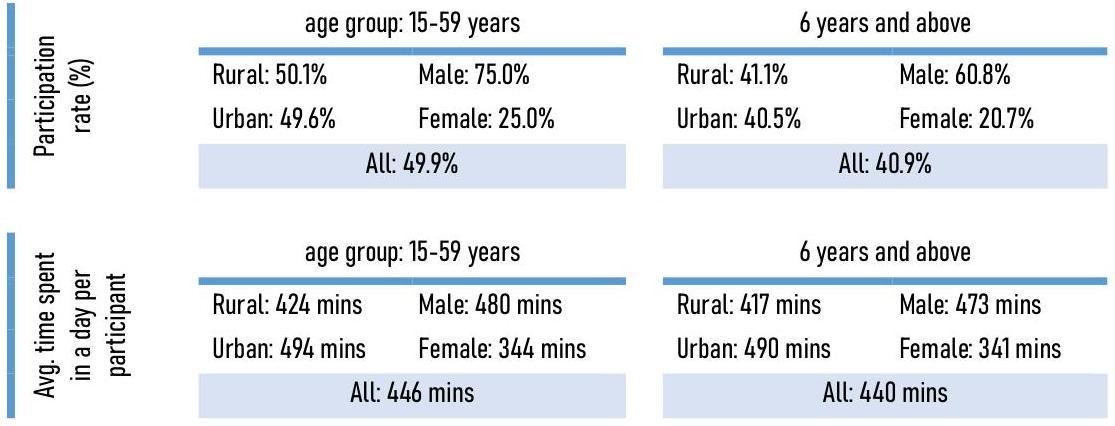
Participation rate (\%) in employment and related activities during TUS, 2019 \& TUS, 2024
Time spent in a day per participant in employment and related activities during TUS, 2019
\& TUS, 2024
– 26.4\% male and $83.1 \%$ females participated in domestic services for household members in normal days. In ‘other days’ (i.e, weekly off-days, holidays etc.), male and female participation in such activities were $32.2 \%$ and $67.5 \%$ respectively.
UNPAID CAREGIVING FOR HOUSEHOLD MEMBERS
Participation rate (\%)

| Rural: $26.5 \%$ | Male: $17.9 \%$ |
|---|---|
| Urban: $24.5 \%$ | Female: $34.0 \%$ |
| All: $25.9 \%$ |
Avg. time spent in a day per participant
Rural: 115 mins Male: 75 mins
Urban: 117 mins Female: 137 mins
All: $116 \mathrm{mins}$
UNPAID VOLUNTEER, TRAINEE AND OTHER UNPAID WORK
Participation rate (\%)
Avg. time spent in a day per participant
| Rural: $121 \mathrm{mins}$ | Male: $139 \mathrm{mins}$ |
|---|---|
| Urban: $123 \mathrm{mins}$ | Female: $108 \mathrm{mins}$ |
All: $122 \mathrm{mins}$
6 years and above
| Rural: $89.5 \%$ | Male: $89.1 \%$ |
|---|---|
| Urban: $88.6 \%$ | Female: $89.5 \%$ |
| All: $89.3 \%$ |
| Rural: $121 \%$ | Male: $22.6 \%$ |
|---|---|
| Urban: $20.7 \%$ | Female: $20.2 \%$ |
| All: $21.4 \%$ |
age group: 6-14 years
| Rural: 411 mins | Male: 411 mins |
|---|---|
| Urban: 417 mins | Female: 415 mins |
| All: 413 mins |
6 years and above
| Rural: 413 mins | Male: 415 mins |
|---|---|
| Urban: 419 mins | Female: 413 mins |
| All: 414 mins |
Participation in learning activities increased among children of age 6-14 years from $85.9 \%$ during 2019 to $89.3 \%$ during 2024. Female participation in the age group increased from $85.6 \%$ to $89.5 \%$.
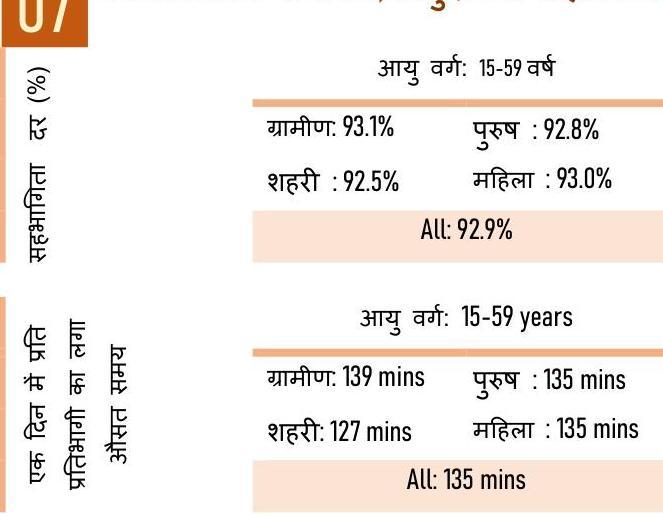
SOCIALIZING AND COMMUNICATION, COMMUNITY PARTICIPATION AND RELIGIOUS PRACTICE
age group: 15-59 years
| Rural: $93.1 \%$ | Male: $92.8 \%$ |
|---|---|
| Urban: $92.5 \%$ | Female: $93.0 \%$ |
| All: $92.9 \%$ |
age group: 15-59 years
| Rural: 139 mins | Male: 135 mins |
|---|---|
| Urban: 127 mins | Female: 135 mins |
| All: 135 mins |
6 years and above
| Rural: 90.1\% | Male: 89.8\% |
|---|---|
| Urban: 90.8\% | Female: 90.7\% |
| All: 90.3\% |
6 years and above
| Rural: 142 mins | Male: 138 mins |
|---|---|
| Urban: 131 mins | Female: 139 mins |
| All: 138 mins |
97\% of persons age 60 years and above participated in such activities
| 6 years and above | |
|---|---|
| Rural: $91.8 \%$ | Male: $95.3 \%$ |
| Urban: $95.8 \%$ | Female: $90.7 \%$ |
| All: $93.0 \%$ |
| 6 years and above | ||
|---|---|---|
| Rural: 165 mins | Male: 177 mins | |
| Urban: 183 mins | Female: 164 mins | |
| All: 171 mins |
Participation (\%) in Mass Media Use
Average time (minutes) spent per participant in Mass Media Use
19
SELF-CARE AND MAINTENANCE
Avg. time spent in a day per participant of age 6 years and above
| Rural: 711 mins | Male: 710 mins |
|---|---|
| Urban: 701 mins | Female: 706 mins |
All: 708 mins
- Self-care and maintenance involve essential activities of human being such as eating, sleeping etc.
- Participation rate in such activities is $100 \%$
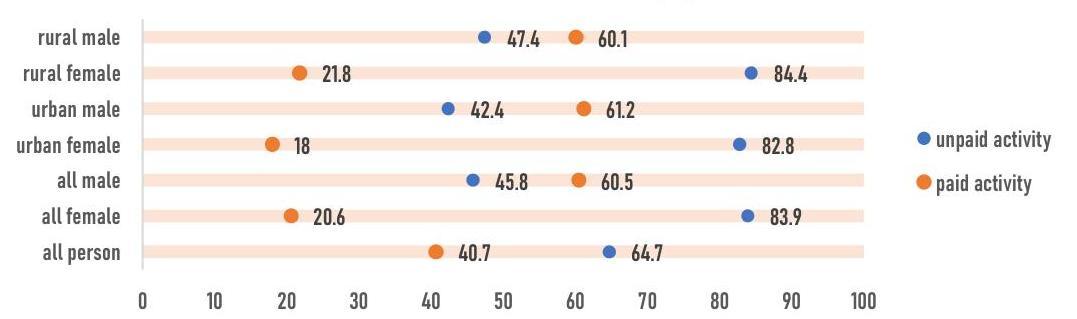
PARTICIPATION AND AVERAGE TIME SPENT IN UNPAID AND PAID ACTIVITIES
Participation rate (\%) among persons of age 6 years and above in unpaid and paid
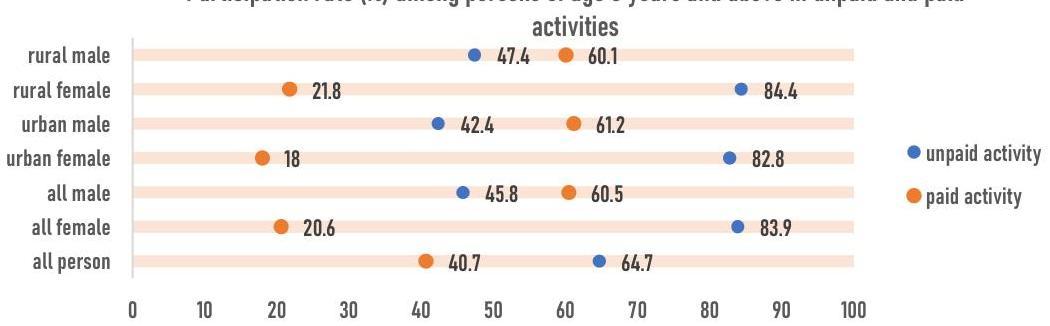
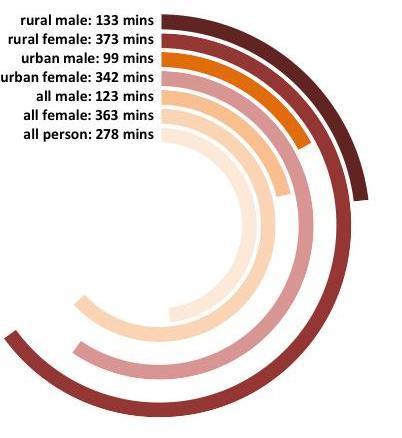
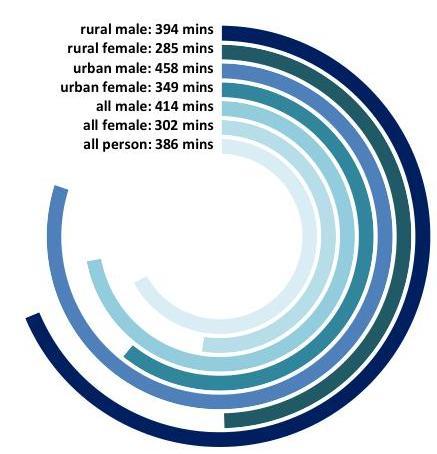
Average time spent (in minutes) in a day per participant of age 6 years and above in PAID activities
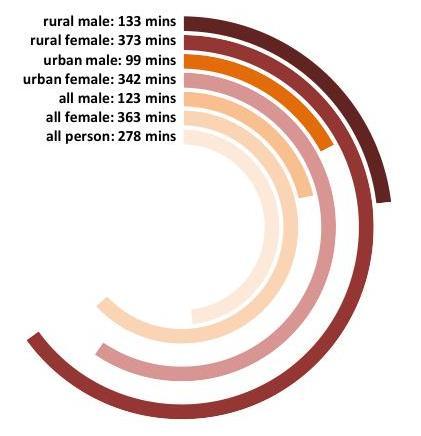
Average time spent (in minutes) in a day per participant of age 6 years and above in UNPAID activities
Participation in unpaid and paid activities by persons of age 6 years and above during TUS,2019 and TUS,2024
Participation rate (\%) among persons of age 6 years and above in SNA Production and Non-SNA Production activities
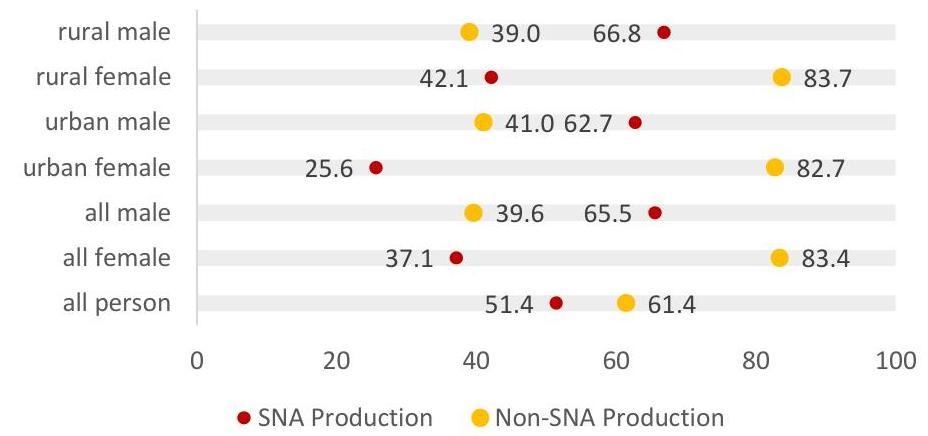
Average time spent (in minutes) in a day per participant of age 6 years and above in SNA Production activities
Average time spent (in minutes) in a day per participant of age 6 years and above in Non-SNA Production activities
TIME SPENT DURING NORMAL DAY AND OTHER DAY
The normal days are the days on which a household member pursues mostly his/her routine activities whereas the day on which the routine activities of a household member are altered due to any reason, it is treated as ‘other day’ (weekly off-days, holidays, days of leave, etc.).
Disposition of time per person in normal days and other type of days, for different section of the population, are shown in the following charts. Activities shown on the left hand side are arranged in decreased order of time spent per person in a normal day.
Average time (minutes) spent in a day per person during normal day and other type of day
SOME INSIGHTS INTO TIME USE BY INDIAN POPULATION
Male commuters (for employment related activities) in the age group 15-59 years, spent 77 minutes on average in a day in commuting compared to 67 minutes spent by their female counterparts.

Children in the age group 6-14 years, spent 61 minutes in extracurricular activities while participating in such activities. Younger participants in the age group 15-29 years spent 74 minutes in a day on an average in extracurricular activities.
About $14.8 \%$ male and $3.9 \%$ females in the age group 15-29 years participated in sports and exercise activities during a day spending 64 minutes and 46 minutes respectively on an average. Children aged 6-14 years participating sports and exercise activities, spent on an average 83 minutes and 68 minutes in rural and urban areas respectively.
$87.4 \%$ of younger people in the age group 15-29 years in urban areas and $73.4 \%$ in rural areas reported to have used mass media in a day. They spent 126 minutes and 116 minutes respectively in using mass-media.
People aged 6 years and above spent about 89 minutes in a day while taking care of their dependent adult household members. Male participants spent 85 minutes while female participants spent 91 minutes on an average in such caring activities.

Rural people aged 6 years and above, spent about 123 minutes in a day in Socializing and communication compared to 110 minutes spent by their urban counterparts. Male participants spent 121 minutes in a day compared to 117 minutes spent by female participants.
About $71.6 \%$ of rural children and $68.8 \%$ of urban children aged 6-14 years reported to have participated in learning activities related to formal education in the reference day, spending about 312 minutes in a day by each of the category. Younger participants (aged 15-29 years) in learning activities related to formal education spent around 308 minutes in a day on an average.
$76.3 \%$ females participated in activities of food and meals management and preparation, spending about 209 minutes in the day. Male participation in such activity was $6.2 \%$ spending about 87 minutes in a day.
Activities related to childcare and instruction for own household in the reference day was reported by $32.8 \%$ females and $17 \%$ males. Time spent by the participants in such activities was 136 minutes and 73 minutes for female and male respectively.

PARTICIPATION IN ACTIVITIES AT DIFFERENT TIME PERIODS OF A DAY
Participation of people in different activities during different period of the day can be observed from Time Use Survey. Following figures present a pictorial view of participation rate in some specific activites among certain categories of population during different time periods of the day.
Percentage of persons of age 15-59 years participating in employment and related activities at different time points in a day
Percentage of persons of age 6 years and above participating in unpaid domestic and caregiving activities for household members at different time points in a day
Time of the day
Percentage of persons of age 6-14 years participating in Learning activities at different time points in a day
Time of the day

CONTENTS
| Content | Page no. | |
|---|---|---|
| 01 | Introduction | $1-4$ |
| 02 | Summary of Findings | |
| Section | Introduction | $5-6$ |
| Section 2.1 | Household and Population | 7 |
| Section 2.2 | Participation and time spent in different activities (nine Major divisions of the TUS activity classification) | $8-29$ |
| Section 2.3 | Unpaid caregiving services for household members | $30-31$ |
| Section2.4 | Unpaid domestic services for household member | $32-34$ |
| Section 2.5 | Learning activities | 35 |
| Section 2.6 | Unpaid activities and paid activities | $36-42$ |
| Section 2.7 | SNA production activities and non-SNA production activities | $43-52$ |
| Section 2.8 | Travel time | 53 |
| Section 2.9 | Self-care and maintenance activities | 54 |
| Section 2.10 | Respondent type in TUS, 2024 | $55-56$ |
| Estimates for State/UT | $57-230$ | |
| Appendix A | List of Detailed Tables (with Hyperlink) | A1 – A4 |
| Appendix B | List of RSE Tables (with Hyperlink) | B1 – B2 |
| Appendix C | Concepts and Definitions | C1 – C17 |
| Appendix D | Sampling Design and Estimation Procedure | D1-D11 |
| Appendix E | Schedule 10.6: Time Use | E1 – E9 |
National Statistics Office (NSO) in India conducted the first Time Use Survey during January – December 2019. The second all-India Time Use Survey was taken up by the NSO during the period January – December, 2024.

Time Use Survey (TUS) provides a framework for measuring time dispositions by the population on different activities. It provides detailed insights into the duration and frequency of both paid and unpaid activities performed by the population. One of the key features that sets TUS apart from other household surveys is its ability to capture detailed data on a wide range of human activities, whether they are paid, unpaid, or other, which is often not possible in other types of surveys. These are activities within the Production Boundary of the System of National Accounts (SNA) as well as outside that parameter but within the General Production Boundary and those that are personal and non-delegable.
The National Statistics Office (NSO) under Ministry of Statistics and Programme Implementation (MoSPI), conducted first all-India Time Use Survey (TUS) from January to December 2019. This survey aimed to measure how much time individuals in India spent on various activities, including paid work, unpaid work and care activities. The Time Use Survey, 2024 is the second in the series and was conducted over the same 12-month period (January to December 2024). This survey continues to track participation rates and the amount of time spent on different activities, providing valuable data on the distribution of time across various activities in a day, such as paid employment work and unpaid domestic and care work.
1.1 OBJECTIVES OF THE TIME USE SURVEY, 2024
The primary objective of Time Use Survey (TUS) is to measure participation of men and women in paid and unpaid activities. TUS is an important source of information on the time spent in unpaid caregiving activities, volunteer work, unpaid domestic service producing activities of the household members. It also provides information on time spent on learning, socializing, leisure activities, self-care activities, etc., by the household members.
1.2 FEATURES OF TIME USE SURVEY, 2024
The Time Use Survey, 2024, has the following features:
i. In this survey, information on activity particulars was collected for each household member of age 6 years and above, with a reference period of 24 hours starting from 4:00 AM on the day before the date of interview to 4:00 AM on the day of the interview. The reference period of 24 hours was split into 48 time slots, each of duration of 30 minutes.
ii. The Information on time use for the reference period was collected through personal interview from the persons of age 6 years and above of the selected households.
iii. Respondents were asked about their activities performed in the designated time slots and the same was recorded against the corresponding slot. In case of multiple activities in a time slot the activities which were performed for 10 minutes or more were recorded, subject to a maximum three activities in a time slot.
iv. If more than one activity was performed in a time slot, one of the activities was treated as a major activity and all other activities in that time slot was considered as minor activity. The major activity was the one which was considered most important activity by the informant performed during a time slot. If in a time slot only one activity was performed, that activity was always considered as a major activity.
v. Simultaneous activity: If in a time slot multiple activities were recorded, it was enquired whether some of these activities were performed simultaneously or not. Simultaneous activities are those that have an overlap of some duration of time in the same time slot of 30-minute duration, irrespective of their starting or ending time.
vi. The activities reported by the respondents, were codified (3-digit code) following the International Classification of Activities for Time Use Statistics 2016 (ICATUS 2016). The classification is referred to as TUS activity classification in this Report. The code structure and description of the 3digit code of the TUS activity classification are given in Appendix C.
vii. Determination of activity performed in a day and time spent in a day in that activity have been done in the following ways:
a. Considering only the major activity in a time slot: While considering only the major activity in a time slot, the entire duration of the time in that time slot has been allotted to the major activity and the major activity was considered as the activity performed in that time slot.
b. Considering all the activities in a time slot: While considering all the activities performed in a time slot, the entire duration of time in a time slot has been assigned among the activities in a time slot in the following ways:
- If in a time slot only one activity was performed, the entire duration of that time slot was allotted against that activity.
- If in a time slot more than one activity was performed, the entire duration of that time slot was allotted equally among the activities performed in that time slot.
In the Highlights of this Report, estimates have been presented considering all the activities in a time slot. All-India level estimates in Chapter Two have also been presented considering all the activities in the time slot.
In the title of the Tables given in Appendix A of this Report as well as in the title of the Statements presented for the State/UT in Chapter Two of this Report, it has been mentioned specifically whether the estimates are presented considering only the major activity or considering all the activities.
1.3 GEOGRAPHICAL COVERAGE
The survey covered the whole of the Indian Union except the villages in Andaman and Nicobar Islands which are difficult to access.
1.4 SAMPLE DESIGN
A stratified two stage design was adopted for the TUS. The first stage units (FSU) were villages/UFS blocks/sub-units (SUs) as per the situation. The ultimate stage units (USU) were households in both the sectors.
For TUS, it was planned that for each FSU, a total number of 14 households would be surveyed during a period of 7 days, with 2 households on each of the 7 days of the survey period in that FSU. The sample households from each FSU were selected by SRSWOR. It may be noted that in TUS, no second stage stratification of households was made. Sample size for TUS is given below:
| Table 1: Sample size | ||
|---|---|---|
| FSU/Households/persons | rural | urban |
| FSU allotted | 5,996 | 4,028 |
| FSU surveyed | 5,949 | 4.020 |
| households surveyed | 83,247 | 56,240 |
| total persons of age 6 years and above | $2,85,389$ | $1,68,803$ |
| surveyed | ||
| total persons of age 6 years and above | $2,83,015$ | $1,67,442$ |
| excluding the non-reporting cases * | ||
| * The difference is due to the number $(3,735)$ of persons in respect of | ||
| whom information on time use could not be collected |
1.5 CONTENTS OF THE REPORT
This report is organized in Two chapters, including the present introductory chapter (Chapter One), and five appendices. The Summary of Findings is presented in Chapter Two. In Chapter Two, some estimates for each State/UT are also provided in Statement 1.1 to Statement 17.1. The detailed tables forming the basis of this report are presented in Appendix A. The RSEs of some of the key indicators have been presented in Appendix B. If RSE of an estimate for any category appear as zero, it indicates that the RSE is zero when rounded off or in case of participation rate, the estimate of participation rate
is $100 \%$ and hence the corresponding RSE is zero (0). RSE is blank in case there is no sample observation or a single sample observation. Appendix C describes the concepts and definitions of those terms used in the survey in connection with the various items covered in this report. Appendix D gives a detailed description of the sample design and estimation procedure used for the survey. Appendix E gives a facsimile of the schedule (Schedule 10.6) canvassed.
1.5.2 While using the State/UT level estimates, it may be noted that the sample sizes for the smaller State or UTs may not be adequate for getting sufficiently reliable estimates for some of the indicators. If there is no sample observation for any particular category, the estimate corresponding to that category is marked as a dash (-). If the estimate for any category appear as zero, it indicates that sample observation corresponding to that category is greater than zero but the estimates are zero when rounded off. In this report, no separate estimate for transgender has been provided considering the constraints of sample size and transgender has been included in persons.

In Time Use Survey (TUS) (January 2024-December 2024) information on time use was collected for each member of age 6 years and above of the selected households, covering a reference period of 24 hours starting from 4:00 AM on the day before the date of interview to 4:00 AM on the day of the interview.
2.0 Introduction
The estimates of participation rates in different activities in a day and average time spent in those activities in a day presented in this report are for persons of age 6 years and above. In this context the term day indicates the reference period of 24 hours on which information on time use was collected.
The International Classification of Activities for Time Use Statistics 2016 (3-digit code) (ICATUS 2016) was used in TUS to record 3-digit codes of the activities of the household members. The code structure and description of the 3-digit code of the TUS activity classification are given in Appendix C.
KEY INDICATORS AND THEIR ESTIMATES
(i) Participation rate: Participation rate in a day in any activity is defined as the percentage of persons of specific categories (say rural male of age 6 years and above, urban female of age 15-29 years, etc) performing that activity during the 24 hours of the reference period for which information on time use was collected in the survey.
(ii) Estimates of average time spent in a day: Estimates of average time spent in a day can be derived by the following approaches:
(a) Per participant: This provides estimates of average time spent in a day in an activity by those persons who are participating in that activity. Estimates of average time spent in a day in different activities derived by considering only the participants for those activities will not add up to 1440 minutes of the day. These estimates are referred to as average time spent in a day per participant.
(b) Per person: Average time spent in a day for any activity can be calculated by considering all the persons of a specific category (say, rural male, urban male of age 60 years and above, persons of age 6 years and above, etc.) irrespective of whether they performed the activities or not. By this approach, distribution of total time of 1440 minutes of a day per person belonging to that
specific category in different activities can be derived and percentage share of the different activities in the total time of 1440 minutes of a day can be calculated. These estimates are referred to as average time spent in a day per person.
| Participation rate in an activity | $=\frac{\text { number of persons participating in the activity }}{\text { total number of persons }} \times 100$ |
|---|---|
| Average time spent per participant in an activity |
total time spent by the participants in the activity total number of persons participating in the activity |
|---|---|
| Average time spent per person in an activity |
$=\frac{\text { total time spent by the participants in the activity }}{\text { total number of persons }}$ |
|---|---|
In the titles of the Statements in this Chapter as well as in the titles of the Tables in Appendix A, it has been mentioned whether the estimates of time spent in a day are presented per participant or per person.
This report mainly provides the average time (in minutes) spent in activities considering those who participated in the specific activity. However, to understand the distribution of total time of 1440 minutes in different activities in a day per person in the population of a specific category (say by males in rural areas of age 15-29 years), for some of the estimates, average time spent in a day per person has also been derived.
(iii) Estimates considering all the activities performed in a time slot and considering only the major activity in a time slot: In the Statements in Chapter Two, estimates of participation rate and average time spent per person in a day have been presented considering all the activities in the time slot. A note regarding this has been provided in the Statements. However, in the Statements for State/UT and in the Tables in Appendix A, estimates of participation rate have also been provided considering only the major activity in a time slot and the corresponding estimates of average time has also been presented considering the major activity by assigning all the time in the time slot against that major activity.
Structure of the Chapter
This Chapter is arranged in the following Sections:
| 2.1 | Household and Population | 2.6 | Unpaid activities and paid activities |
|---|---|---|---|
| 2.2 | Participation and time spent in different activities (nine Major divisions of the TUS activity classification) | 2.7 | SNA production activities and non-SNA production activities |
| 2.3 | Unpaid caregiving services for household members | 2.8 | Travel time |
| 2.4 | Unpaid domestic services for household member | 2.9 | Self-care and maintenance activities |
| 2.5 | Learning activities | 2.10 | Respondent type in TUS, 2024 |
2.1 Household and Population
This Section presents the percentage distribution of households and persons in rural and urban areas, obtained from TUS 2024. Since information on time use was collected for persons of age 6 years and above, percentage of persons of age 6 years and above in the population, as obtained from the survey, is also given.
The design of Time Use Survey was not aimed at estimating population. It may be noted that in this report, no separate estimate for transgender has been provided considering the constraints of sample size and transgender has been included in persons.
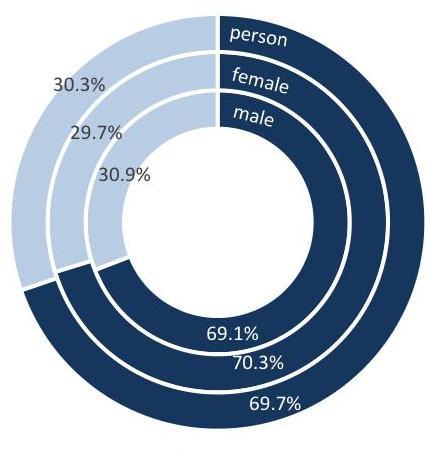
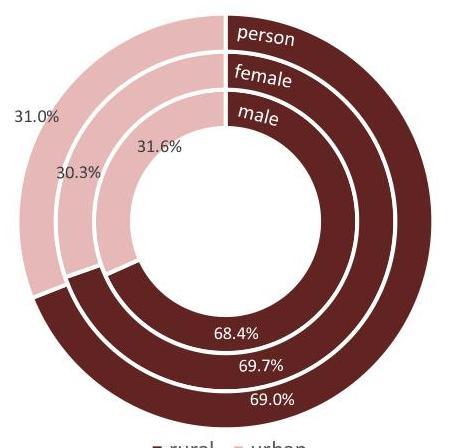
Figure 1 presents the percentage distribution of persons of all ages between rural and urban areas. Figure 2 shows the estimated percentage distribution of persons of age 6 years and above. Thus, estimated distribution of persons presented in Figure 2 excludes persons aged 5 years or less. Number of villages/ blocks, households surveyed and persons enumerated for each State/ UT are given in Table 1 of the Appendix A. Percentage distribution of households and persons for each State/UT is given in Table 2 of Appendix A.
Figure 1: Percentage distribution of all person among rural and urban areas
- rural = urban
Figure 2: Percentage distribution of persons of age 6 years and above among rural and urban areas
2.2 Participation and time spent in nine different activities
Participation rates of the persons of age 6 years and above in different activities described as nine (9) Major Divisions of the TUS activity classification (ICATUS-2016) and average time spent in those activities in a day are presented in this Section.
In Time Use Survey, the activities reported by the respondents were codified following the International Classification of Activities for Time Use Statistics (ICATUS 2016). The nine (9) major divisions of the TUS activity classification used in collection of information on time use in this survey are as follows:
| Major Division | Description |
|---|---|
| $\mathbf{1}$ | Employment and related activities |
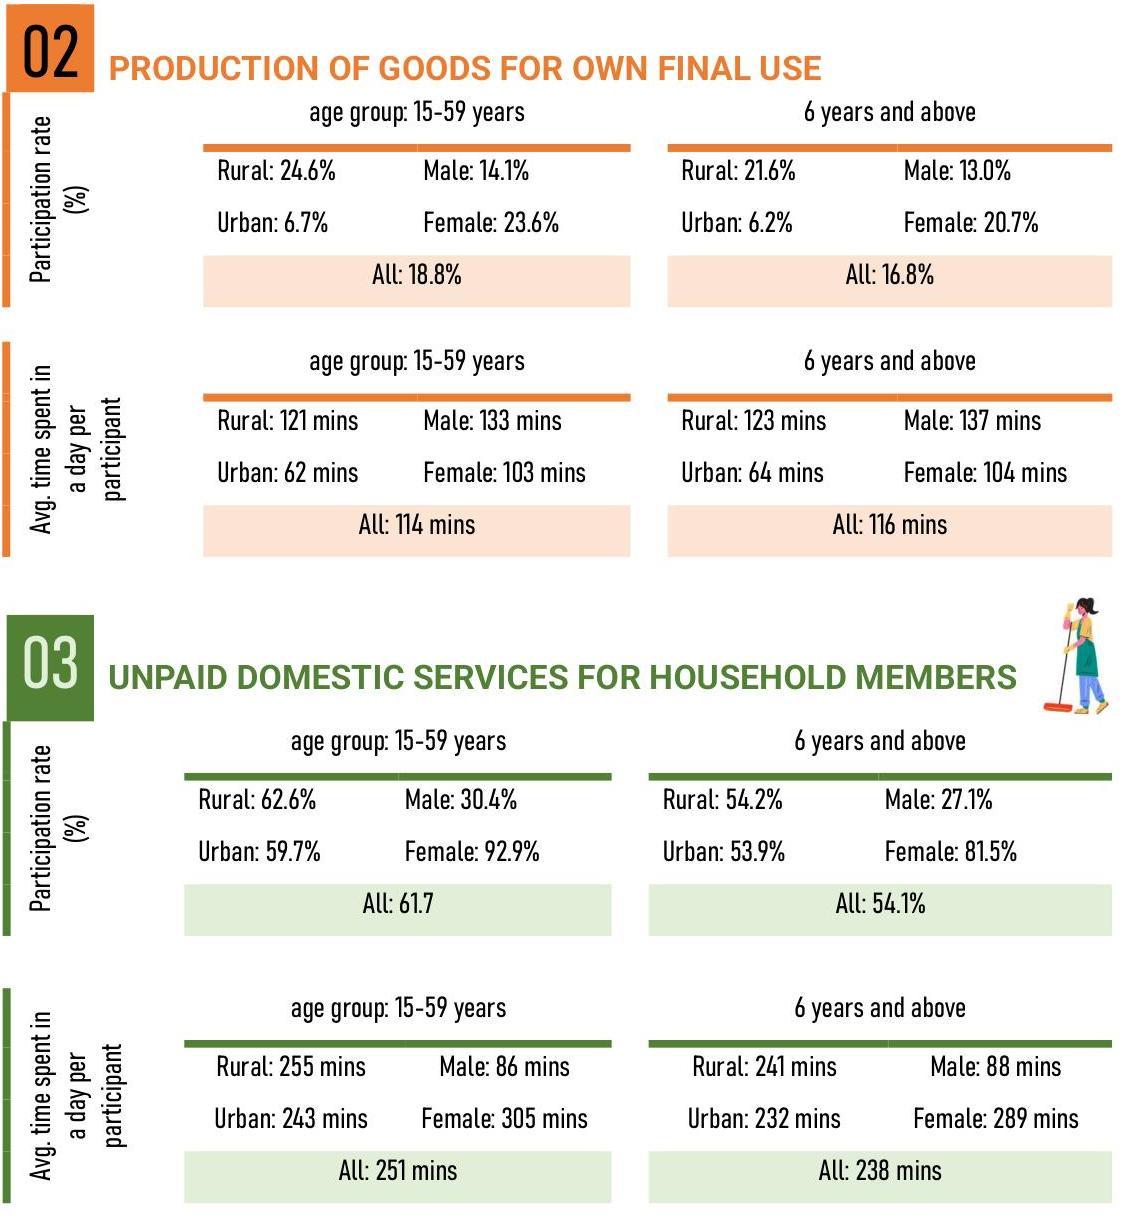
| $\mathbf{2}$ | Production of goods for own final use |
| $\mathbf{3}$ | Unpaid domestic services for household members |
| $\mathbf{4}$ | Unpaid caregiving services for household members |
| $\mathbf{5}$ | Unpaid volunteer, trainee and other unpaid work |
| $\mathbf{6}$ | Learning |
| $\mathbf{7}$ | Socializing and communication, community participation and religious practice |
| $\mathbf{8}$ | Culture, leisure, mass-media and sports practices |
| $\mathbf{9}$ | Self-care and maintenance |
2.2.1 Participation and Time Spent by persons of age 6 years and above
In this Section, participation rate of the persons of age 6 years and above in different activities described as major divisions (1-digit code) of the TUS activity classification and average time spent in those activities in a day are given.
Participation rate in the activities for persons of age 6 years and above
In Statement 1, participation rate (i.e., percentage of persons who participated) in different activities during the reference period of 24 hours is given. Estimates of percentage of persons who participated in different activities for each State/UT is given in Statement 5.1 at the end of this Chapter.
Statement 1: Participation rate (\%) in different activities in a day
| Description of the activity | rural | urban | rural+urban | ||||||
|---|---|---|---|---|---|---|---|---|---|
| male | female | person | male | female | person | male | female | person | |
| Employment and related activities | 60.4 | 21.9 | 41.1 | 61.7 | 18.2 | 40.5 | 60.8 | 20.7 | 40.9 |
| Production of goods for own final use | 17.4 | 25.8 | 21.6 | 3.4 | 9.1 | 6.2 | 13.0 | 20.7 | 16.8 |
| Unpaid domestic services for household members | 26.5 | 81.8 | 54.2 | 28.4 | 80.9 | 53.9 | 27.1 | 81.5 | 54.1 |
| Unpaid caregiving services for household members | 18.2 | 34.8 | 26.5 | 17.5 | 32.0 | 24.5 | 17.9 | 34.0 | 25.9 |
| Unpaid volunteer, trainee and other unpaid work | 0.9 | 1.1 | 1.0 | 0.9 | 1.2 | 1.1 | 0.9 | 1.1 | 1.0 |
| Learning | 23.2 | 20.3 | 21.7 | 21.3 | 20.1 | 20.7 | 22.6 | 20.2 | 21.4 |
| Socializing and communication, community participation and religious practice | 89.7 | 90.4 | 90.1 | 90.1 | 91.5 | 90.8 | 89.8 | 90.7 | 90.3 |
| Culture, leisure, massmedia and sports practices | 94.8 | 88.8 | 91.8 | 96.4 | 95.1 | 95.8 | 95.3 | 90.7 | 93.0 |
| Self-care and maintenance | 100.0 | 100.0 | 100.0 | 100.0 | 100.0 | 100.0 | 100.0 | 100.0 | 100.0 |
Reference: Appendix Table 6
Note: The estimates have been calculated considering all the activities in a time slot
Time spent in a day by persons of age 6 years and above participating in different activities
In Statement 2, average amount of time (in minutes) spent in a day per participant in different activities are given and the corresponding estimates for each State/UT are given in Statement 6.1.
| Description of the activity | rural | urban | rural+urban | ||||||
|---|---|---|---|---|---|---|---|---|---|
| male | female | person | male | female | person | male | female | person | |
| Employment and related activities | 451 | 322 | 417 | 518 | 391 | 490 | 473 | 341 | 440 |
| Production of goods for own final use | 142 | 111 | 123 | 81 | 57 | 64 | 137 | 104 | 116 |
| Unpaid domestic services for household members | 88 | 291 | 241 | 88 | 285 | 232 | 88 | 289 | 238 |
| Unpaid caregiving services for household members | 76 | 135 | 115 | 74 | 142 | 117 | 75 | 137 | 116 |
| Unpaid volunteer, trainee and other unpaid work | 140 | 107 | 121 | 139 | 110 | 123 | 139 | 108 | 122 |
| Learning | 413 | 412 | 413 | 421 | 417 | 419 | 415 | 413 | 414 |
| Socializing and communication, community participation and religious practice | 143 | 140 | 142 | 128 | 135 | 131 | 138 | 139 | 138 |
| Culture, leisure, massmedia and sports practices | 174 | 155 | 165 | 184 | 183 | 183 | 177 | 164 | 171 |
| Self-care and maintenance | 715 | 707 | 711 | 697 | 705 | 701 | 710 | 706 | 708 |
| Reference: Appendix Table 7 Note: The estimates have been calculated considering all the activities in a time slot |
Average time spent in a day per person (considering all the persons irrespective of whether they participated in the activities or not)
Statement 2 gives the average amount of time spent in a day by persons participating in different activities. However, Statement 2 does not give the distribution of the total time (i.e., 1440 minutes) available in a day over different activities by the persons.
To derive the distribution of the total time in a day (i.e., 1440 minutes) in different activities per person, the estimates of average time have been obtained by considering all the persons irrespective of whether they performed the activities or not.
In Statement 3, distribution of total time of 1440 minutes in a day per person in different activities are presented considering all the persons irrespective of whether they performed the activities or not and the corresponding estimates for each State/UT are given in Statement 7.1. In Statement 4, percentage share of the total time of a day in different activities are presented considering all the
persons irrespective of whether they performed the activity or not. Figures 3 gives a pictorial representation of the distribution of 1440 minutes in a day over different activities for male and female.
Statement 3: Average time (in minutes) spent in different activities in a day per person
| Description of the activity | rural | urban | rural+urban | |||||
|---|---|---|---|---|---|---|---|---|
| male | female | person | male | female | person | male | female | person | |
| Employment and related activities | 273 | 70 | 171 | 320 | 71 | 199 | 287 | 71 | 180 |
| Production of goods for own final use | 25 | 29 | 27 | 3 | 5 | 4 | 18 | 21 | 20 |
| Unpaid domestic services for household members | 23 | 238 | 131 | 25 | 231 | 125 | 24 | 236 | 129 |
| Unpaid caregiving services for household members | 14 | 47 | 30 | 13 | 46 | 29 | 13 | 47 | 30 |
| Unpaid volunteer, trainee and other unpaid work | 1 | 1 | 1 | 1 | 1 | 1 | 1 | 1 | 1 |
| Learning | 96 | 84 | 90 | 89 | 84 | 87 | 94 | 84 | 89 |
| Socializing and communication, community participation and religious practice | 128 | 127 | 128 | 115 | 124 | 119 | 124 | 126 | 125 |
| Culture, leisure, massmedia and sports practices | 165 | 137 | 151 | 177 | 174 | 176 | 169 | 148 | 159 |
| Self-care and maintenance | 715 | 707 | 711 | 697 | 705 | 701 | 710 | 706 | 708 |
| Total (in minutes) | 1440 | 1440 | 1440 | 1440 | 1440 | 1440 | 1440 | 1440 | 1440 |
Reference: Appendix Table 8
Note: (i) The estimates have been calculated considering all the activities in a time slot
(ii) Figures may not add up to 1440 due to rounding off
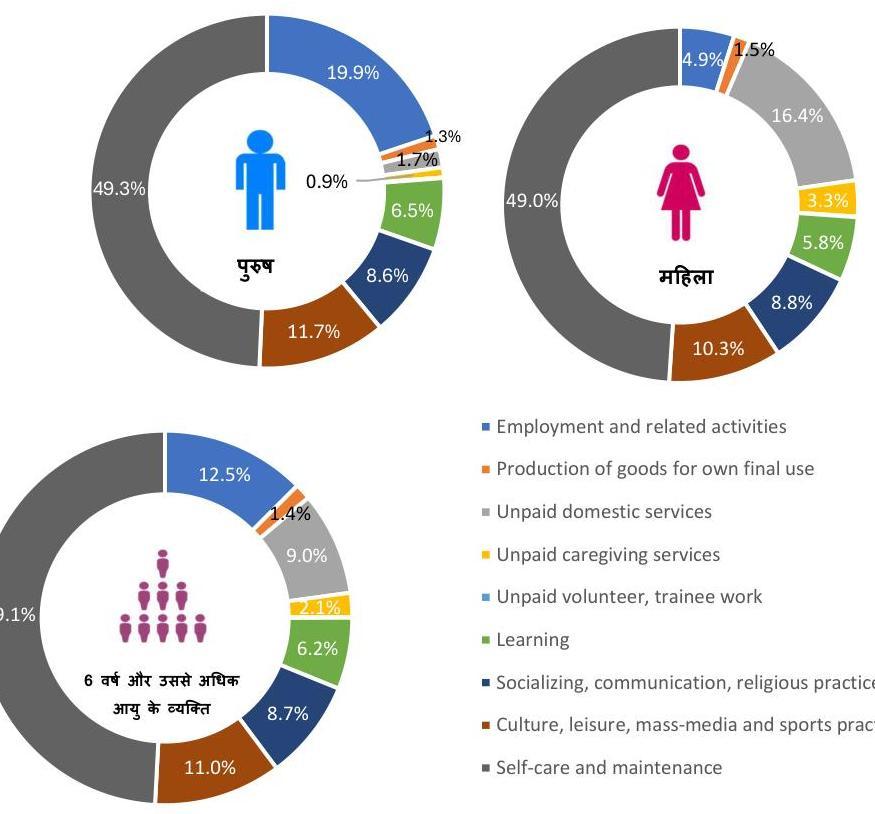
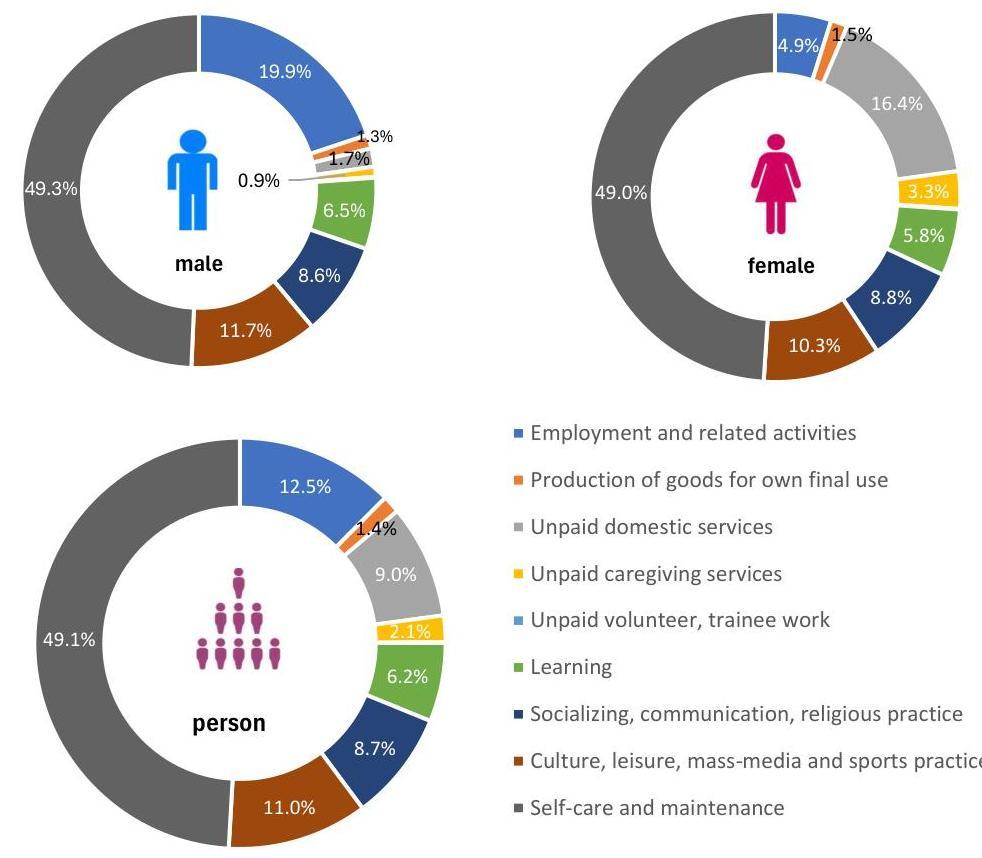
Statement 4: Percentage share of total time in different activities in a day per person
| Description of the activity | rural | urban | rural+urban | |||||
|---|---|---|---|---|---|---|---|---|
| male | female | person | male | female | person | male | female | person | |
| Employment and related activities | 19.0 | 4.9 | 11.9 | 22.2 | 4.9 | 13.8 | 19.9 | 4.9 | 12.5 |
| Production of goods for own final use | 1.7 | 2.0 | 1.9 | 0.2 | 0.3 | 0.3 | 1.3 | 1.5 | 1.4 |
| Unpaid domestic services for household members | 1.6 | 16.5 | 9.1 | 1.7 | 16.0 | 8.7 | 1.7 | 16.4 | 9.0 |
| Unpaid caregiving services for household members | 1.0 | 3.3 | 2.1 | 0.9 | 3.2 | 2.0 | 0.9 | 3.3 | 2.1 |
| Unpaid volunteer, trainee | 0.1 | 0.1 | 0.1 | 0.1 | 0.1 | 0.1 | 0.1 | 0.1 | 0.1 |
Statement 4: Percentage share of total time in different activities in a day per person
| Description of the activity | rural | urban | rural+urban | ||||||
|---|---|---|---|---|---|---|---|---|---|
| male | female | person | male | female | person | male | female | person | |
| and other unpaid work | |||||||||
| Learning | 6.7 | 5.8 | 6.3 | 6.2 | 5.8 | 6.0 | 6.5 | 5.8 | 6.2 |
| Socializing and communication, community participation and religious practice | 8.9 | 8.8 | 8.9 | 8.0 | 8.6 | 8.3 | 8.6 | 8.8 | 8.7 |
| Culture, leisure, massmedia and sports practices | 11.5 | 9.5 | 10.5 | 12.3 | 12.1 | 12.2 | 11.7 | 10.3 | 11.0 |
| Self-care and maintenance | 49.7 | 49.1 | 49.4 | 48.4 | 49.0 | 48.7 | 49.3 | 49.0 | 49.2 |
| Total | 100.0 | 100.0 | 100.0 | 100.0 | 100.0 | 100.0 | 100.0 | 100.0 | 100.0 |
Reference: Appendix Table 8
Note: (i) The estimates have been calculated considering all the activities in a time slot
(ii) Figures may not add up to 100 due to rounding off
Figure 3: Average time (in minutes) spent in a day per person in different activities
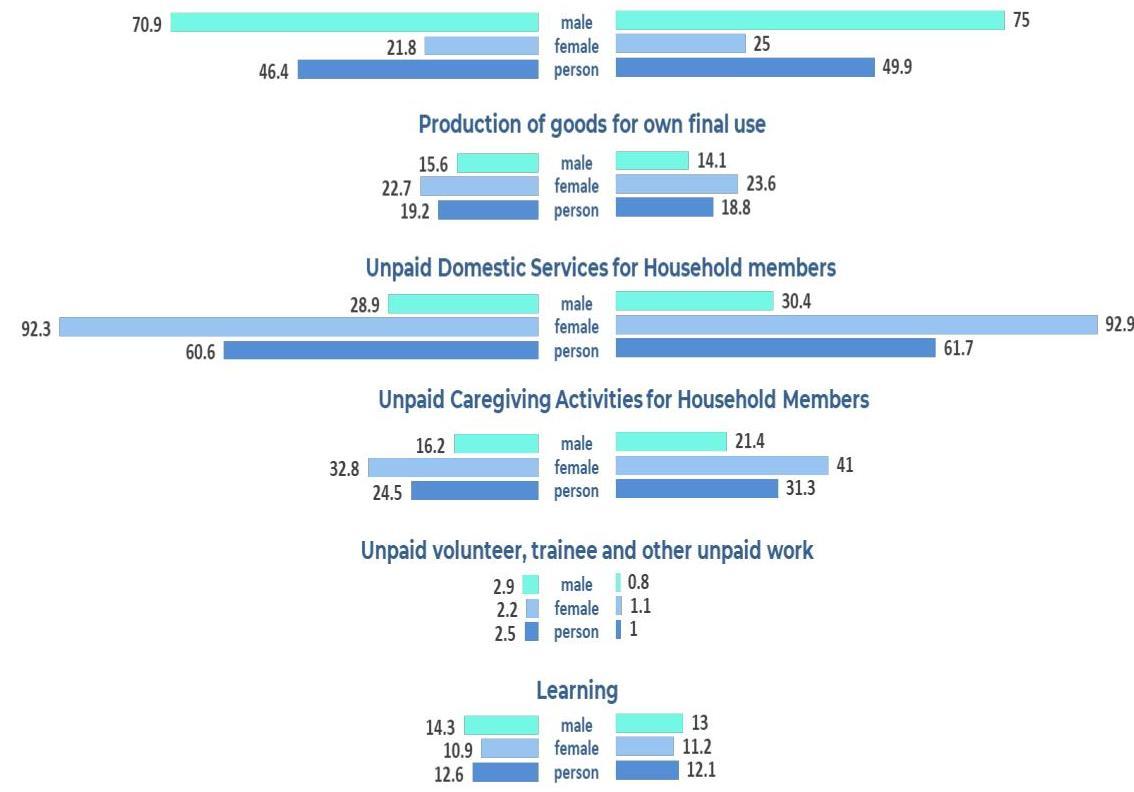
2.2.2 Participation and Time Spent by persons in different age groups
Participation rates in the activities by persons in different age groups
Participation rates in a day for persons of age groups 15-29 years, 15-59 years and 60 years and above in different activities are presented in Statement 5.
Statement 5: Participation rate (\%) among different age groups in the activities in a day
| all-India | |||
|---|---|---|---|
| Description of the activity | 15-29 years | 15-59 years | 60 years and above |
| male | |||
| Employment and related activities | 56.3 | 75.0 | 48.1 |
| Production of goods for own final use | 9.7 | 14.1 | 19.5 |
| Unpaid domestic services for household members | 25.9 | 30.4 | 34.0 |
| Unpaid caregiving services for household members | 14.0 | 21.4 | 14.1 |
| Unpaid volunteer, trainee and other unpaid work | 0.8 | 0.8 | 2.1 |
| Learning | 31.9 | 13.0 | 0.1 |
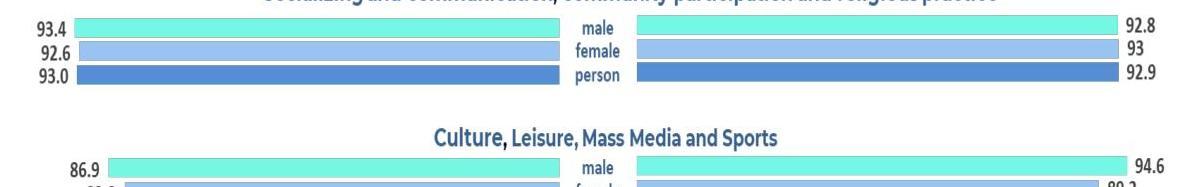
| Socializing and communication, community participation and religious practice | 90.3 | 92.8 | 96.8 |
| Culture, leisure, mass-media and sports practices | 96.0 | 94.6 | 94.8 |
| Self-care and maintenance | 100.0 | 100.0 | 100.0 |
| female | |||
| Employment and related activities | 14.9 | 25.0 | 16.4 |
| Production of goods for own final use | 17.6 | 23.6 | 22.1 |
| Unpaid domestic services for household members | 86.2 | 92.9 | 80.6 |
| Unpaid caregiving services for household members | 45.6 | 41.0 | 21.7 |
| Unpaid volunteer, trainee and other unpaid work | 0.8 | 1.1 | 2.2 |
| Learning | 27.1 | 11.2 | 0.1 |
| Socializing and communication, community participation and religious practice | 90.9 | 93.0 | 97.2 |
| Culture, leisure, mass-media and sports practices | 89.9 | 89.2 | 92.3 |
| Self-care and maintenance | 100.0 | 100.0 | 100.0 |
| person | |||
| Employment and related activities | 35.3 | 49.9 | 32.3 |
| Production of goods for own final use | 13.7 | 18.8 | 20.8 |
| Unpaid domestic services for household members | 56.4 | 61.7 | 57.2 |
| Unpaid caregiving services for household members | 30.0 | 31.3 | 17.9 |
| Unpaid volunteer, trainee and other unpaid work | 0.8 | 1.0 | 2.1 |
| Learning | 29.5 | 12.1 | 0.1 |
| Socializing and communication, community participation and religious practice | 90.6 | 92.9 | 97.0 |
| Culture, leisure, mass-media and sports practices | 92.9 | 91.9 | 93.6 |
| Self-care and maintenance | 100.0 | 100.0 | 100.0 |
| Reference: Appendix Table 6 | |||
| Note: The estimates have been calculated considering all the activities in a time slot |
In Statement 6, average amount of time spent in a day in different activities per participant of age groups 15-29 years, 15-59 years and 60 years and above in those activities are presented.
Statement 6: Average time (in minutes) spent in a day per participant of different age groups
| all-India | |||
|---|---|---|---|
| Description of the activity | 15-29 years | 15-59 years | 60 years and above |
| male | |||
| Employment and related activities | 477 | 480 | 408 |
| Production of goods for own final use | 118 | 133 | 159 |
| Unpaid domestic services for household members | 87 | 86 | 100 |
| Unpaid caregiving services for household members | 77 | 74 | 84 |
| Unpaid volunteer, trainee and other unpaid work | 167 | 150 | 119 |
| Learning | 427 | 422 | 78 |
| Socializing and communication, community participation and religious practice | 131 | 135 | 199 |
| Culture, leisure, mass-media and sports practices | 184 | 156 | 220 |
| Self-care and maintenance | 694 | 690 | 764 |
| female | |||
| Employment and related activities | 338 | 344 | 317 |
| Production of goods for own final use | 87 | 103 | 111 |
| Unpaid domestic services for household members | 280 | 305 | 227 |
| Unpaid caregiving services for household members | 164 | 140 | 117 |
| Unpaid volunteer, trainee and other unpaid work | 113 | 111 | 104 |
| Learning | 417 | 412 | 63 |
| Socializing and communication, community participation and religious practice | 124 | 135 | 198 |
| Culture, leisure, mass-media and sports practices | 152 | 145 | 206 |
| Self-care and maintenance | 695 | 686 | 771 |
| person | |||
| Employment and related activities | 448 | 446 | 385 |
| Production of goods for own final use | 98 | 114 | 133 |
| Unpaid domestic services for household members | 237 | 251 | 189 |
| Unpaid caregiving services for household members | 144 | 118 | 104 |
| Unpaid volunteer, trainee and other unpaid work | 138 | 127 | 111 |
| Learning | 422 | 417 | 72 |
| Socializing and communication, community participation and religious practice | 127 | 135 | 198 |
| Culture, leisure, mass-media and sports practices | 168 | 151 | 213 |
| Self-care and maintenance | 694 | 688 | 767 |
| Reference: Appendix Table 7 Note: The estimates have been calculated considering all the activities in a time slot |
Participation in different activities during TUS, 2019 and TUS, 2024
This section presents some comparative figures stating participation rate in different activities obtained from the first TUS conducted during January – December, 2019 and those obtained from the current TUS conducted during January – December, 2024.
In Figure 4 to Figure 6, a graphical comparative statement has been presented for participation rate in different activities reported during TUS, 2019 and TUS, 2024 separately for different age groups.
Figure 4: Participation rate (\%) in different activities in a day among persons of age group 15-29 years during TUS, 2019 and TUS, 2024
TUS 2019
TUS 2024
Employment and related activities
Unpaid Caregiving Activities for Household Members

Socializing and communication, community participation and religious practice
Self-care and maintenance

Figure 5: Participation rate (\%) in different activities in a day among persons of age group 15-59 years during TUS, 2019 and TUS, 2024
TUS 2019
TUS 2024
Emolovment and related activities
Socializing and communication, community participation and religious practice
Self-care and maintenance

Figure 6: Participation rate(%) in different activities in a day among persons of age 6 years and above during TUS, 2019 and TUS, 2024
| TUS 2019 | TUS 2024 | |
|---|---|---|
| Employment and related activities | ||
| 57.3 | ||
| 38.2 | 18.4 | |
| | | | | | | | | | | | | | | | | | | | | | | | | | | | | | | | | | | | | | | | | | | | | | | | | | | | | | | | | | | | | | | | | | | | | | | | | | | | | | | | | | | | | | | | | | | | | | | | | | |
Average time spent in different activities during TUS, 2019 and TUS, 2024
Graphical presentation of average time spent in different activities are presented here. Figure 7 to Figure 9 presents average time spent per participant in a day in different activities obtained from TUS, 2024 in comparison to TUS, 2019 for different age groups of persons.
Figure 7: Average time (in minutes) spent in a day per participant in different activities for persons of age group 15-29 years during TUS, 2019 and TUS, 2024
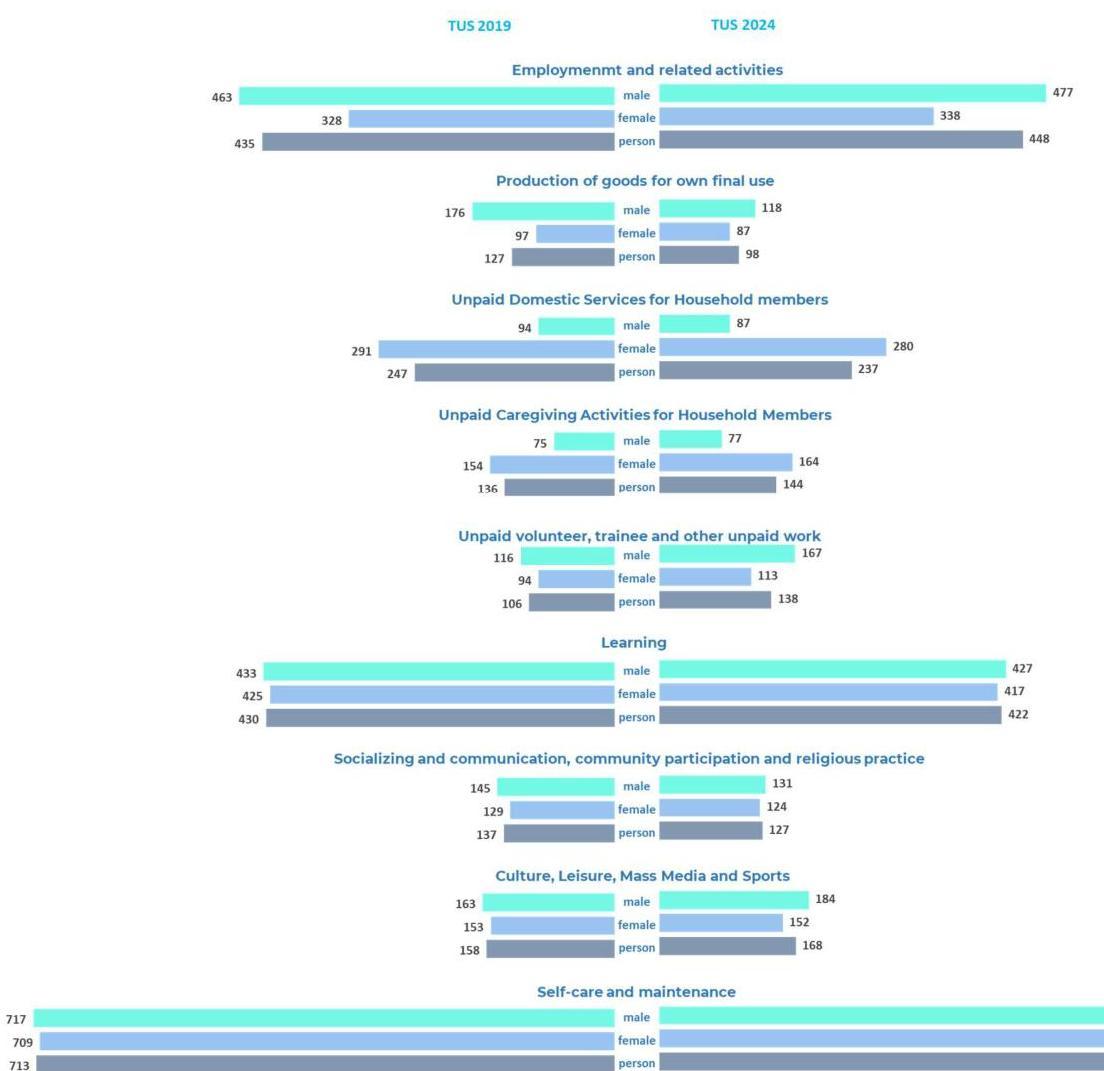
Figure 8: Average time (in minutes) spent in a day per participant in different activities for persons of age group 15-59 years during TUS, 2019 and TUS, 2024
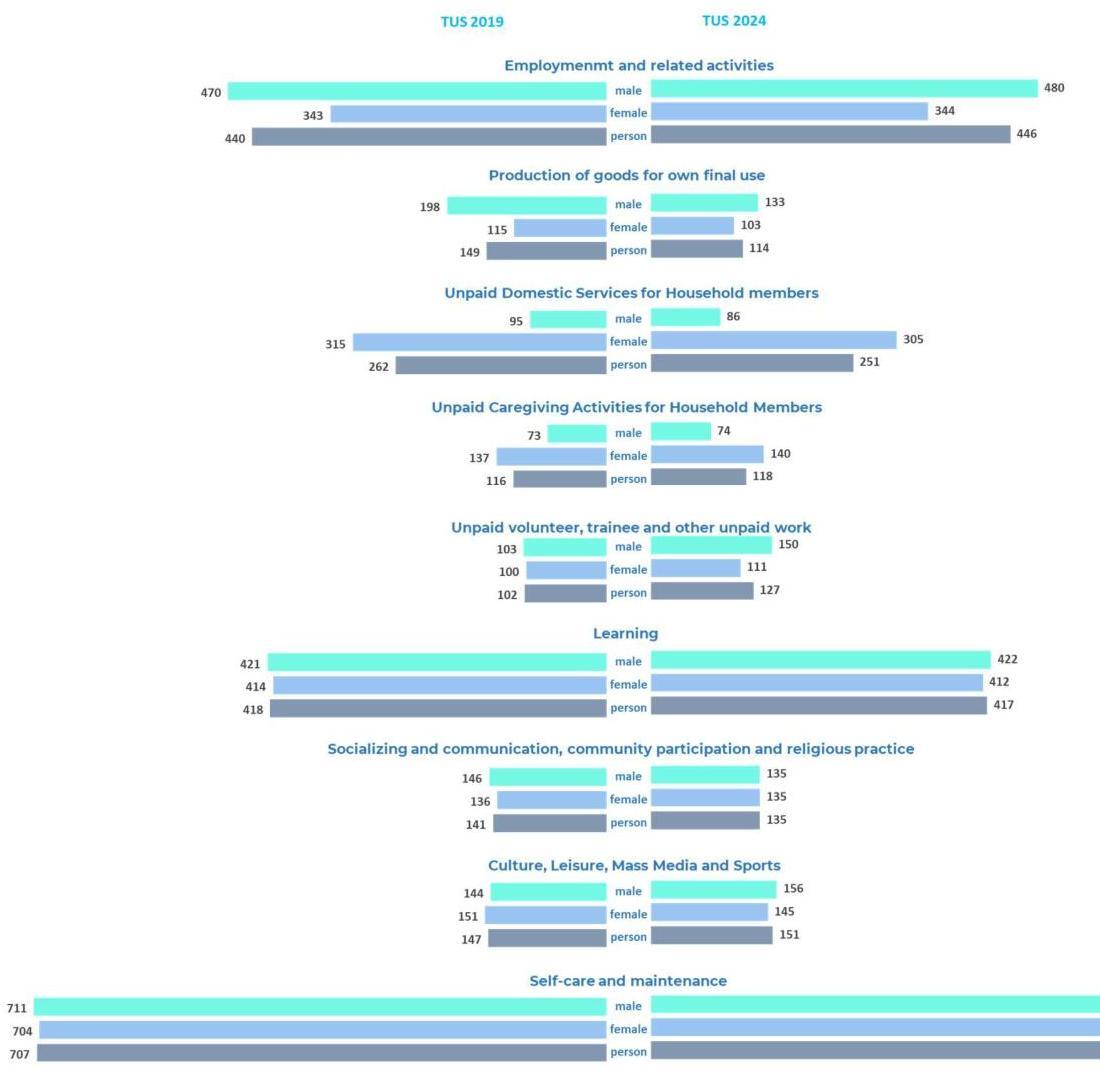
Figure 9: Average time (in minutes) spent in a day per participant in different activities for persons of age 6 years and above during TUS, 2019 and TUS, 2024
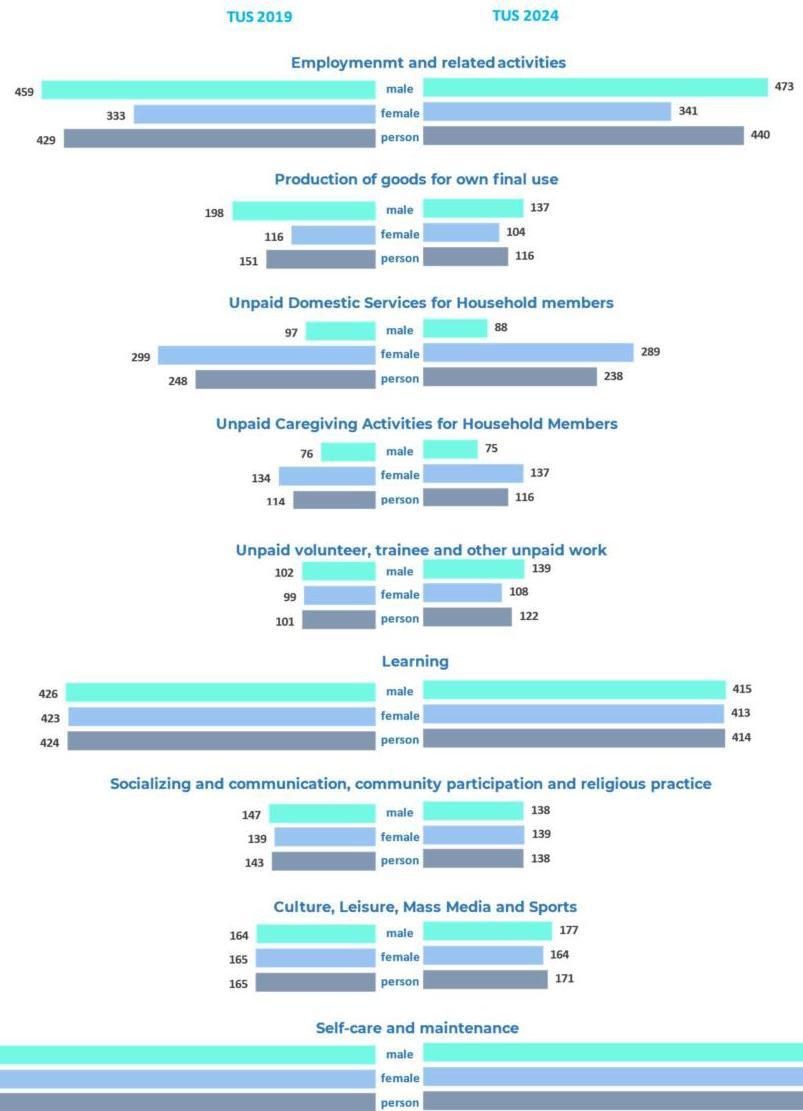
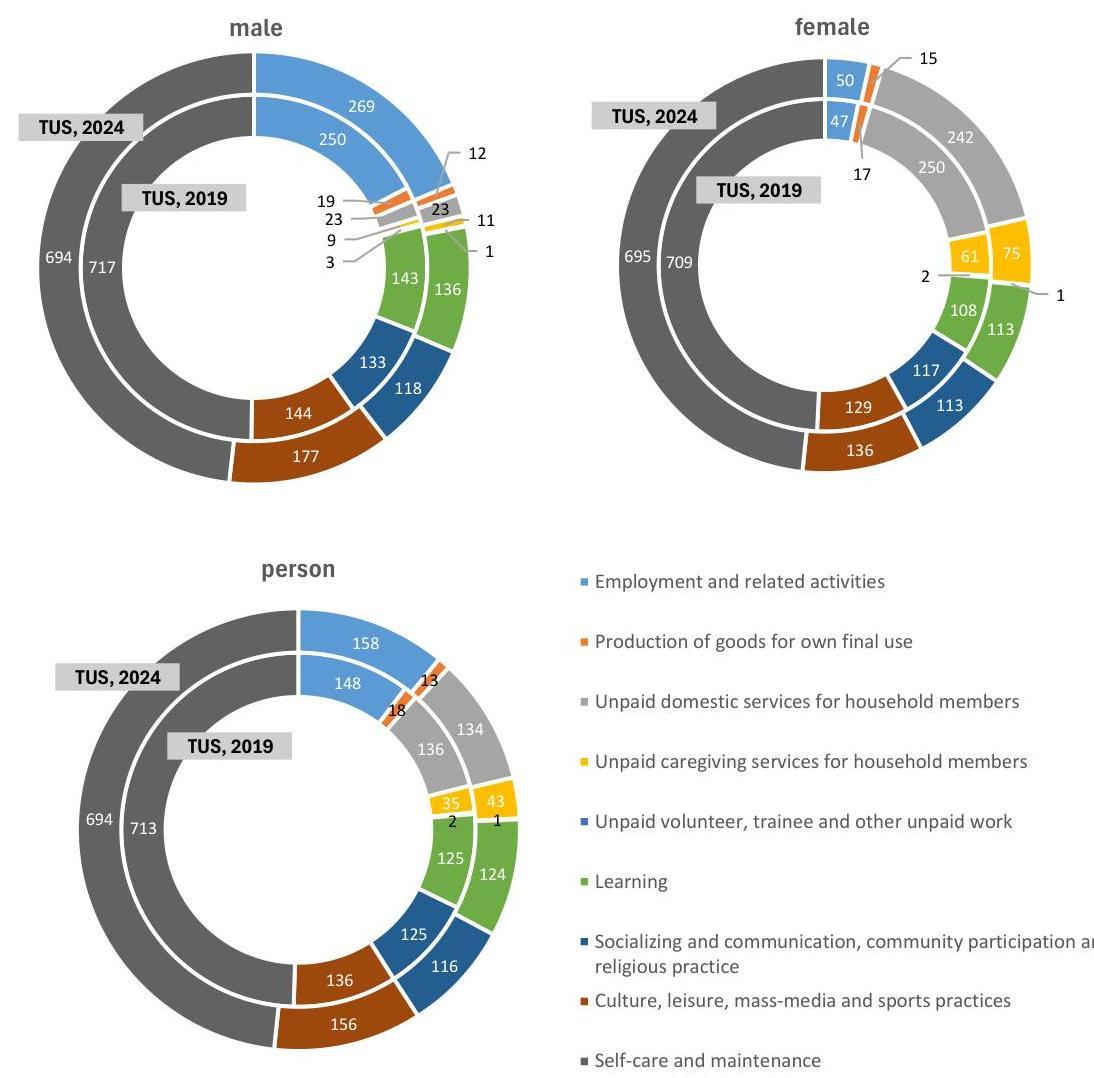
Figure 10 to Figure 12 below shows the distribution of 24 hours ( 1440 minutes) in different activities as estimated from TUS, 2019 and TUS, 2024. As mentioned earlier, this distribution is derived from average time spent per person in a day in different activities.
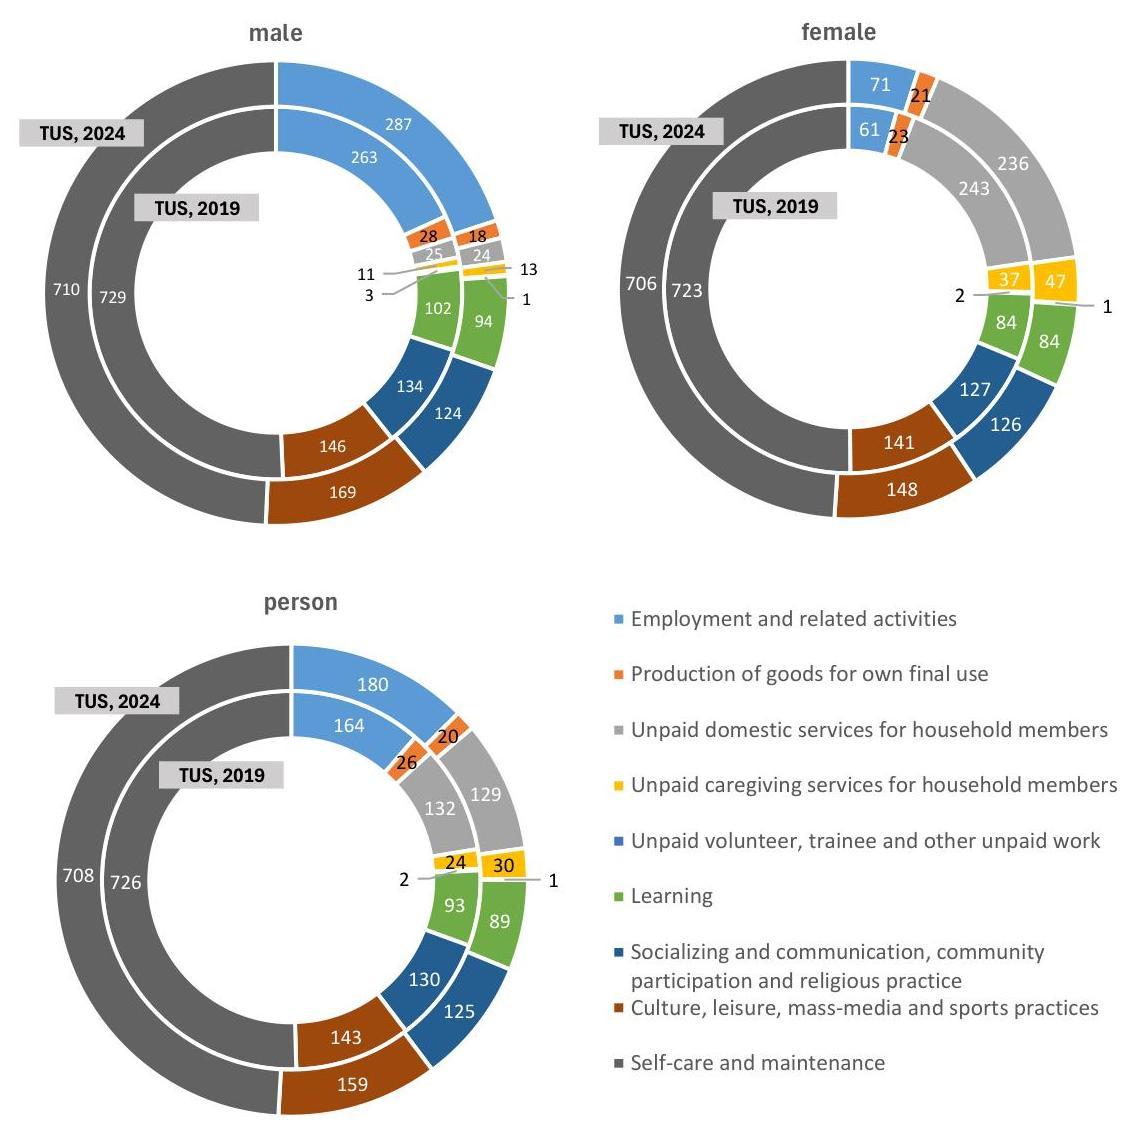
Figure 10: Distribution of time (minutes) in a day in different activities among persons of age group 15-29 years during TUS, 2019 and TUS, 2024
– Employment and related activities
– Production of goods for own final use
– Unpaid domestic services for household members
– Unpaid caregiving services for household members
– Unpaid volunteer, trainee and other unpaid work
– Learning
– Socializing and communication, community participation and religious practice
– Culture, leisure, mass-media and sports practices
– Self-care and maintenance
Figure 11: Distribution of time (minutes) in a day in different activities among persons of age group 15-59 years during TUS, 2019 and TUS, 2024
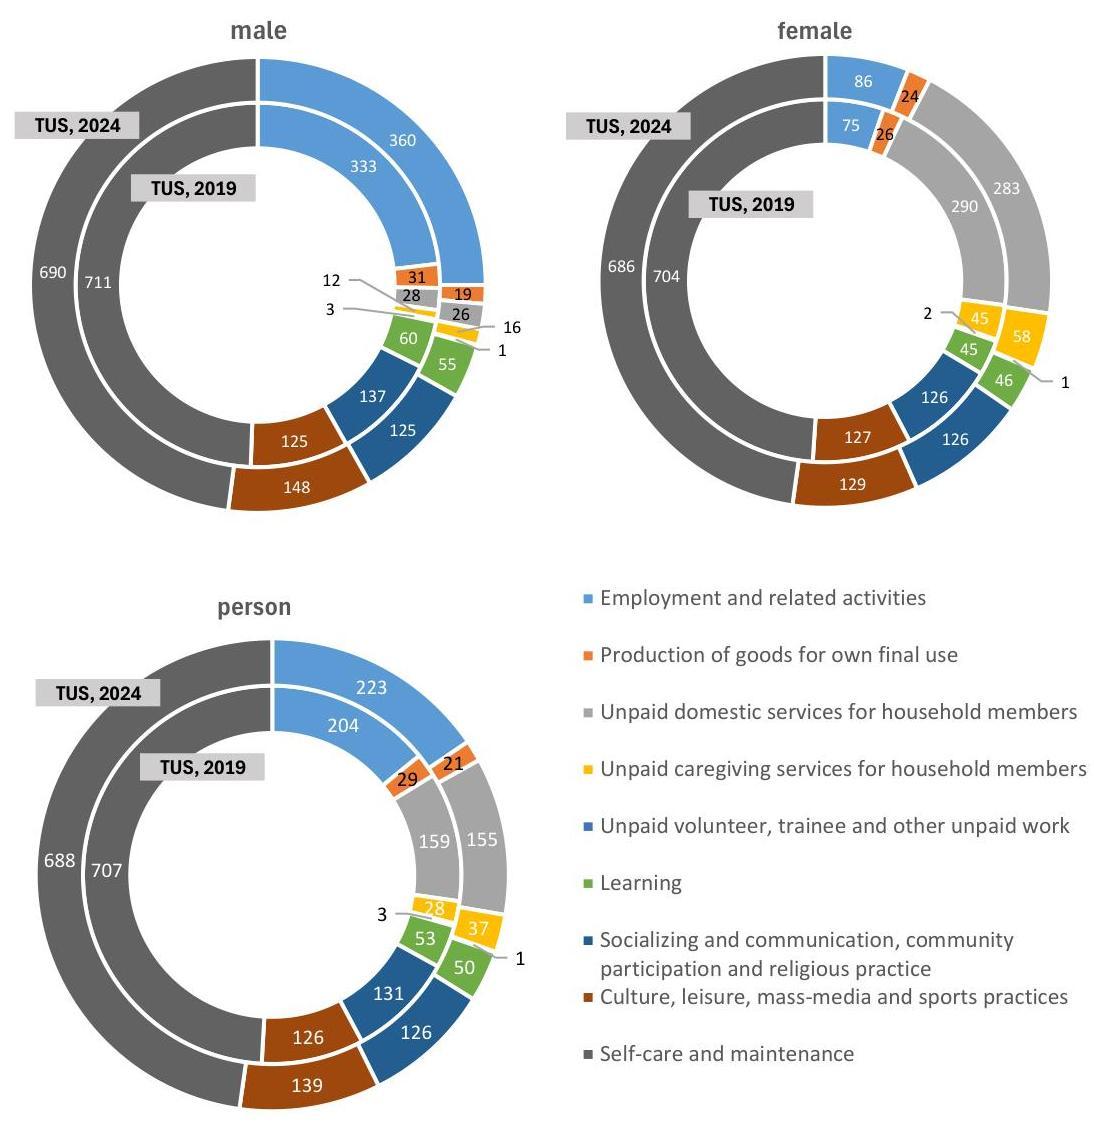
– Employment and related activities
– Production of goods for own final use
– Unpaid domestic services for household members
– Unpaid caregiving services for household members
– Unpaid volunteer, trainee and other unpaid work
– Learning
– Socializing and communication, community participation and religious practice
– Culture, leisure, mass-media and sports practices
– Self-care and maintenance
Figure 12: Distribution of time (minutes) in a day in different activities among persons of age 6 years and above during TUS, 2019 and TUS, 2024
– Employment and related activities
– Production of goods for own final use
– Unpaid domestic services for household members
– Unpaid caregiving services for household members
– Unpaid volunteer, trainee and other unpaid work
– Learning
– Socializing and communication, community participation and religious practice
– Culture, leisure, mass-media and sports practices
– Self-care and maintenance
2.2.3 Participation and Time Spent by persons in different broad usual principal activity statuses
Persons have been classified in different broad usual principal activity status following the major time criteria considering the activities pursued by the persons during the last 365 days. The broad usual principal activity statuses are worker, unemployed, and not in labour force. Worker and unemployed constitutes the labour force.
In Statement 7, participation rate in different activities of the TUS activity classification is given for each broad usual principal activity status.
| Description of the activity | ated usual principal activity status | ||||
|---|---|---|---|---|---|
| worker | unemployed | labour force | not in labour force | all | |
| male | |||||
| Employment and related activities | 89.4 | 19.1 | 87.1 | 2.8 | 60.8 |
| Production of goods for own final use | 16.4 | 12.6 | 16.3 | 5.8 | 13.0 |
| Unpaid domestic services for household members | 31.7 | 37.4 | 31.9 | 16.6 | 27.1 |
| Unpaid caregiving services for household members | 23.9 | 9.4 | 23.4 | 5.9 | 17.9 |
| Unpaid volunteer, trainee and other unpaid work | 0.8 | 2.5 | 0.8 | 0.9 | 0.9 |
| Learning | 0.6 | 33.7 | 1.7 | 68.5 | 22.6 |
| Socializing and communication, community participation and religious practice | 94.0 | 94.2 | 94.0 | 80.6 | 89.8 |
| Culture, leisure, mass-media and sports practices | 93.8 | 98.6 | 93.9 | 98.2 | 95.3 |
| Self-care and maintenance | 100.0 | 100.0 | 100.0 | 100.0 | 100.0 |
| female | |||||
| Employment and related activities | 80.2 | 11.4 | 77.7 | 4.0 | 20.7 |
| Production of goods for own final use | 25.5 | 12.0 | 25.0 | 19.5 | 20.7 |
| Unpaid domestic services for household members | 93.9 | 87.2 | 93.6 | 78.0 | 81.5 |
| Unpaid caregiving services for household members | 32.0 | 17.1 | 31.5 | 34.7 | 34.0 |
| Unpaid volunteer, trainee and other unpaid work | 1.3 | 2.8 | 1.3 | 1.1 | 1.1 |
| Learning | 0.9 | 52.8 | 2.8 | 25.4 | 20.2 |
| Socializing and communication, community participation and religious practice | 92.5 | 92.5 | 92.5 | 90.2 | 90.7 |
| Culture, leisure, mass-media and sports practices | 85.5 | 96.7 | 85.9 | 92.1 | 90.7 |
| Self-care and maintenance | 100.0 | 100.0 | 100.0 | 100.0 | 100.0 |
| person | |||||
| Employment and related activities | 87.1 | 17.0 | 84.8 | 3.6 | 40.9 |
| Production of goods for own final use | 18.6 | 12.5 | 18.4 | 15.5 | 16.8 |
| Unpaid domestic services for household members | 46.9 | 50.5 | 47.1 | 60.2 | 54.1 |
| Unpaid caregiving services for household members | 25.9 | 11.4 | 25.4 | 26.3 | 25.9 |
| Unpaid volunteer, trainee and other unpaid work | 0.9 | 2.6 | 1.0 | 1.0 | 1.0 |
| Learning | 0.7 | 38.7 | 2.0 | 37.9 | 21.4 |
| Socializing and communication, community participation and religious practice | 93.7 | 93.8 | 93.7 | 87.4 | 90.3 |
| Culture, leisure, mass-media and sports practices | 91.8 | 98.1 | 92.0 | 93.9 | 93.0 |
| Self-care and maintenance | 100.0 | 100.0 | 100.0 | 100.0 | 100.0 |
| Reference: Appendix Table 17 Note: The estimates have been calculated considering all the activities in a time slot |
Time spent in a day by persons with different broad usual principal activity status participating in the activities
In Statement 8, average amount of time spent in a day per participant in different activities for each broad usual principal activity status has been presented.
Statement 8: Average time (in minutes) spent in a day per participant of different broad usual principal activity status
all-India
| Description of the activity | activity status | ||||
|---|---|---|---|---|---|
| worker | unemployed | labour force | not in force |
labour | all | |
| male | |||||
| Employment and related activities | 478 | 218 | 476 | 247 | 473 |
| Production of goods for own final use | 140 | 120 | 139 | 122 | 137 |
| Unpaid domestic services for household members | 83 | 112 | 84 | 104 | 88 |
| Unpaid caregiving services for household members | 72 | 101 | 73 | 96 | 75 |
| Unpaid volunteer, trainee and other unpaid work | 129 | 223 | 138 | 141 | 139 |
| Learning | 166 | 355 | 288 | 423 | 415 |
| Socializing and communication, community participation and religious practice | 136 | 194 | 138 | 138 | 138 |
| Culture, leisure, mass-media and sports practices | 138 | 292 | 144 | 249 | 177 |
| Self-care and maintenance | 687 | 737 | 688 | 756 | 710 |
| female | |||||
| Employment and related activities | 368 | 178 | 367 | 192 | 341 |
| Production of goods for own final use | 116 | 72 | 115 | 99 | 104 |
| Unpaid domestic services for household members | 234 | 210 | 233 | 309 | 289 |
| Unpaid caregiving services for household members | 101 | 142 | 101 | 147 | 137 |
| Unpaid volunteer, trainee and other unpaid work | 110 | 148 | 113 | 107 | 108 |
| Learning | 150 | 316 | 262 | 418 | 413 |
| Socializing and communication, community participation and religious practice | 119 | 140 | 120 | 145 | 139 |
| Culture, leisure, mass-media and sports practices | 110 | 199 | 114 | 177 | 164 |
| Self-care and maintenance | 658 | 711 | 659 | 720 | 706 |
| person | |||||
| Employment and related activities | 453 | 211 | 451 | 204 | 440 |
| Production of goods for own final use | 132 | 107 | 131 | 102 | 116 |
| Unpaid domestic services for household members | 157 | 156 | 157 | 292 | 238 |
| Unpaid caregiving services for household members | 81 | 117 | 81 | 144 | 116 |
| Unpaid volunteer, trainee and other unpaid work | 122 | 202 | 130 | 116 | 122 |
| Learning | 160 | 341 | 279 | 420 | 414 |
| Socializing and communication, community participation and religious practice | 132 | 180 | 133 | 143 | 138 |
| Culture, leisure, mass-media and sports practices | 132 | 267 | 137 | 199 | 171 |
| Self-care and maintenance | 680 | 730 | 681 | 731 | 708 |
Reference: Appendix Table 18
Note: The estimates have been calculated considering all the activities in a time slot
2.2.4 Type of days
Type of day on which information of time use was collected from the persons was classified as ‘normal day’ or ‘other day.
The normal days are the days on which a household member pursues mostly his/her routine activities whereas the day on which the routine activities of a household member are altered due to any reason, it is treated as ‘other day’. A day other than a normal day might arise due to social obligations or some unforeseen reasons like, illness, ceremonies, hospitalization of a household member etc. besides, weekly off-days, holidays or days of leave.
Statement 9 presents the percentage distribution of persons of age 6 years and above by type of the day on which information on time use was collected. Percentage distribution of persons of age 6 years and above by type of the day on which information on time use was collected is given in Statement 2.1 for each State/UT.
Statement 9: Percentage distribution of persons of age 6 years and above by type of the day on which information of time use was collected
all-India
| Type of day | rural | urban | rural+urban | ||||||
|---|---|---|---|---|---|---|---|---|---|
| male | female | person | male | female | person | male | female | person | |
| normal day | 87.0 | 89.7 | 88.4 | 86.8 | 89.3 | 88.0 | 87.0 | 89.6 | 88.3 |
| other day | 13.0 | 10.3 | 11.6 | 13.2 | 10.7 | 12.0 | 13.0 | 10.4 | 11.7 |
| all | 100.0 | 100.0 | 100.0 | 100.0 | 100.0 | 100.0 | 100.0 | 100.0 | 100.0 |
Note: (i) The estimates have been calculated considering all the activities in a time slot
(ii) Figures may not add up to 100 due to not reported cases of type of the day and rounding off
Reference: Appendix Table 3
Participation rates in the activities by type of day
Participation rate in different activities among those who reported the reference day as ‘normal day’ and those who reported the reference day as ‘other day’ are given in Statement 10 for male and female and in Statement 11 for different age groups.
| Statement 10: Participation rate (\%) in different activities during Normal Day and Other Day | |||||||
|---|---|---|---|---|---|---|---|
| Description of the activity | normal day | other day | |||||
| male | female | person | male | female | person | ||
| Employment and related activities | 67.7 | 22.3 | 44.8 | 14.6 | 7.2 | 11.3 | |
| Production of goods for own final use | 13.2 | 21.5 | 17.4 | 12.0 | 14.4 | 13.0 | |
| Unpaid domestic services for household members | 26.4 | 83.1 | 55.0 | 32.2 | 67.5 | 47.8 | |
| Unpaid caregiving services for household members | 18.5 | 35.6 | 27.1 | 14.3 | 20.2 | 16.9 | |
| Unpaid volunteer, trainee and other unpaid work | 0.6 | 0.9 | 0.8 | 2.5 | 3.2 | 2.8 | |
| Learning | 20.9 | 18.1 | 19.5 | 33.5 | 38.7 | 35.8 | |
| Socializing and communication, community participation and religious practice | 89.9 | 90.9 | 90.4 | 89.7 | 89.6 | 89.6 | |
| Culture, leisure, mass-media and sports practices | 95.0 | 90.4 | 92.7 | 97.3 | 93.5 | 95.6 | |
| Self-care and maintenance | 100.0 | 100.0 | 100.0 | 100.0 | 100.0 | 100.0 | 100.0 |
| Note: The estimates have been calculated considering all the activities in a time slot |
| all-India | ||||||
|---|---|---|---|---|---|---|
| normal day | other day | |||||
| Description of the activity | 15-29 years | 15-59 years | 60 years and above | 15-29 years | 15-59 years | 60 years and above |
| Employment and related activities | 39.1 | 53.8 | 33.4 | 11.8 | 15.6 | 15.0 |
| Production of goods for own final use | 13.9 | 19.1 | 20.9 | 12.6 | 16.2 | 18.3 |
| Unpaid domestic services for household members | 56.8 | 61.8 | 57.2 | 53.8 | 60.9 | 57.2 |
| Unpaid caregiving services for household members | 32.4 | 32.3 | 18.0 | 14.9 | 22.1 | 15.6 |
| Unpaid volunteer, trainee and other unpaid work | 0.5 | 0.7 | 1.8 | 2.5 | 3.5 | 7.0 |
| Learning | 27.3 | 10.8 | 0.1 | 42.7 | 23.7 | 0.1 |
| Socializing and communication, community participation and religious practice | 90.1 | 92.7 | 97.0 | 93.5 | 95.0 | 97.7 |
| Culture, leisure, mass-media and sports practices | 92.5 | 91.6 | 93.6 | 95.7 | 94.1 | 93.4 |
| Self-care and maintenance | 100.0 | 100.0 | 100.0 | 100.0 | 100.0 | 100.0 |
Note: The estimates have been calculated considering all the activities in a time slot
Time spent in a day per person by type of day
Average time spent per person in a day in different activities by those who reported the reference day as ‘normal day’ and those who reported the reference day as ‘other day’ are given in Statement 12 for male and female and in Statement 13 for different age groups.
| Description of the activity | normal day | other day | ||||
| male | femal e |
perso n |
male | femal e |
perso n |
|
| Employment and related activities | 323 | 77 | 199 | 48 | 18 | 35 |
| Production of goods for own final use | 18 | 22 | 20 | 17 | 13 | 15 |
| Unpaid domestic services for household members | 22 | 246 | 135 | 38 | 151 | 87 |
| Unpaid caregiving services for household members | 13 | 49 | 31 | 16 | 26 | 20 |
| Unpaid volunteer, trainee and other unpaid work | 1 | 1 | 1 | 4 | 5 | 4 |
| Learning | 98 | 84 | 91 | 67 | 80 | 73 |
| Socializing and communication, community participation and religious practice | 114 | 121 | 117 | 191 | 170 | 182 |
| Culture, leisure, mass-media and sports practices | 151 | 140 | 145 | 289 | 225 | 261 |
| Self-care and maintenance | 701 | 701 | 701 | 769 | 753 | 762 |
| Total | 1440 | 1440 | 1440 | 1440 | 1440 | 1440 |
Note: (i) The estimates have been calculated considering all the activities in a time slot
(ii) Figures may not add up to 1440 due to rounding off
Statement 13: Average time (in minutes) spent in a day per person of different age group during a Normal Day and Other days
all-India
| Description of the activity | normal day | other day | ||||
|---|---|---|---|---|---|---|
| $\begin{gathered} 15-29 \ \text { years } \end{gathered}$ | $\begin{gathered} 15-59 \ \text { years } \end{gathered}$ | 60 years and above | $\begin{gathered} 15-29 \ \text { years } \end{gathered}$ | $\begin{gathered} 15-59 \ \text { years } \end{gathered}$ | 60 years and above | |
| Employment and related activities | 178 | 242 | 130 | 37 | 50 | 40 |
| Production of goods for own final use | 13 | 22 | 28 | 14 | 20 | 22 |
| Unpaid domestic services for household members | 140 | 159 | 109 | 93 | 119 | 99 |
| Unpaid caregiving services for household members | 47 | 38 | 19 | 20 | 27 | 17 |
| Unpaid volunteer, trainee and other unpaid work | 1 | 1 | 2 | 4 | 6 | 11 |
| Learning | 128 | 50 | 0 | 103 | 57 | 0 |
| Socializing and communication, community participation and religious practice | 105 | 116 | 186 | 183 | 212 | 291 |
| Culture, leisure, mass-media and sports practices | 142 | 130 | 200 | 247 | 215 | 191 |
| Self-care and maintenance | 687 | 683 | 767 | 741 | 735 | 770 |
| Total | 1440 | 1440 | 1440 | 1440 | 1440 | 1440 |
Note: (i) The estimates have been calculated considering all the activities in a time slot
(ii) Figures may not add up to 1440 due to rounding off
Figure 13 below shows the percentage distribution of 24 hours ( 1440 minutes) time in a day for male, female and all persons of age 6 years and above during a normal day and other type of days.
Figure 13: Percentage distribution of time in a day over different activities in Normal days and Other days for persons of age 6 years and above
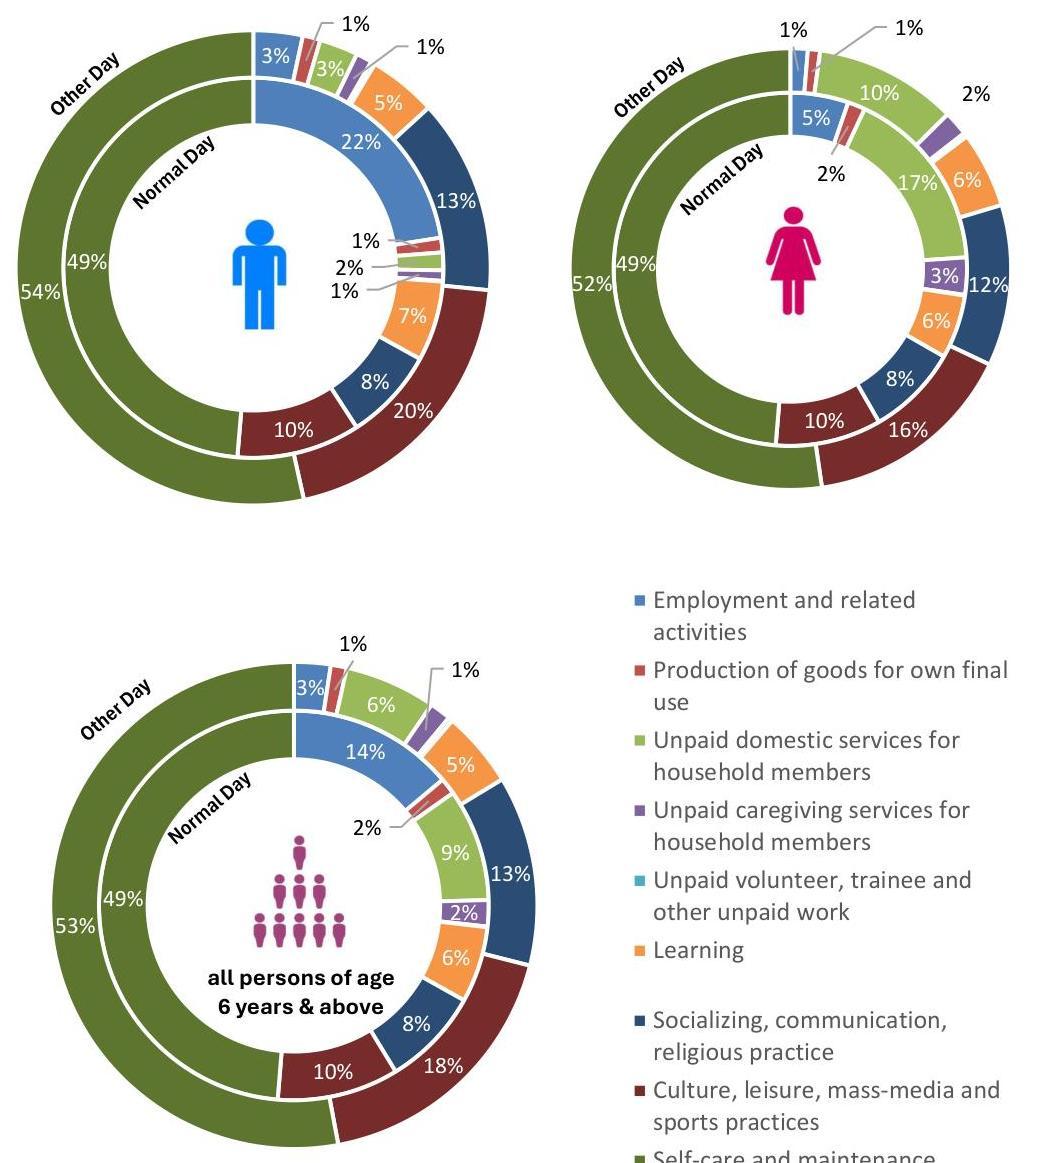
- Employment and related activities
- Production of goods for own final use
- Unpaid domestic services for household members
- Unpaid caregiving services for household members
- Unpaid volunteer, trainee and other unpaid work
- Learning
- Socializing, communication, religious practice
- Culture, leisure, mass-media and sports practices
- Self-care and maintenance
2.3 Unpaid caregiving services for household members
Unpaid caregiving services for household members are important for the purpose of understanding the needs of care within the households.
The different categories of unpaid caregiving services for household members corresponding to which estimates are presented in this Section are:
- Childcare and instruction
- Care for dependent adults
- Help to non-dependent adult household members
- Other activities related to unpaid caregiving services for household members
- Travelling and accompanying goods or persons related to unpaid caregiving services for household members
- All care activities
Participation rates in unpaid caregiving services for household members by persons of age 6 years and above
In Statement 14, participation rate in different unpaid caregiving services for household members is presented.
| Statement 14: Participation rate (\%) in a day in different unpaid caregiving services for household members | |||
|---|---|---|---|
| Description of unpaid caregiving services | male | female | $\begin{gathered} \text { all-India } \ \text { person } \end{gathered}$ |
| rural | |||
| Childcare and instruction | 17.4 | 33.7 | 25.6 |
| Care for dependent adults | 0.3 | 0.7 | 0.5 |
| Help to non-dependent adult household members | 0.1 | 0.3 | 0.2 |
| Travelling and accompanying goods or persons related to unpaid caregiving services for household members | 0.7 | 0.8 | 0.8 |
| Other activities related to unpaid caregiving services for household members | 0.1 | 0.3 | 0.2 |
| All care activities | 18.2 | 34.8 | 26.5 |
| urban | |||
| Childcare and instruction | 16.2 | 30.7 | 23.3 |
| Care for dependent adults | 0.3 | 0.7 | 0.5 |
| Help to non-dependent adult household members | 0.1 | 0.3 | 0.2 |
| Travelling and accompanying goods or persons related to unpaid caregiving services for household members | 1.7 | 2.2 | 1.9 |
| Other activities related to unpaid caregiving services for household members | 0.1 | 0.3 | 0.2 |
| All care activities | 17.5 | 32 | 24.5 |
| rural+urban | |||
| Childcare and instruction | 17.0 | 32.8 | 24.9 |
| Care for dependent adults | 0.3 | 0.7 | 0.5 |
| Help to non-dependent adult household members | 0.1 | 0.3 | 0.2 |
| Travelling and accompanying goods or persons related to unpaid caregiving services for household members | 1.0 | 1.2 | 1.1 |
| Other activities related to unpaid caregiving services for household members | 0.1 | 0.3 | 0.2 |
| All care activities | 17.9 | 34.0 | 25.9 |
| Reference: Appentis Table 6 | |||
| Note: The estimates have been calculated considering all the activities in a time slot |
Time spent in a day in unpaid caregiving services for household members by persons participating in caregiving activities
In Statement 15, average amount of time (in minutes) spent in a day in different unpaid caregiving services for household members per participant of age 6 years and above are presented.
| Description of unpaid caregiving services | male | female | all-India person |
|---|---|---|---|
| rural | |||
| Childcare and instruction | 73 | 135 | 114 |
| Care for dependent adults | 82 | 92 | 89 |
| Help to non-dependent adult household members | 93 | 66 | 74 |
| Travelling and accompanying goods or persons related to unpaid caregiving services for household members | 74 | 71 | 73 |
| Other activities related to unpaid caregiving services for household members | 80 | 63 | 68 |
| All care activities | 76 | 135 | 115 |
| urban | |||
| Childcare and instruction | 71 | 140 | 115 |
| Care for dependent adults | 92 | 90 | 90 |
| Help to non-dependent adult household members | 81 | 64 | 69 |
| Travelling and accompanying goods or persons related to unpaid caregiving services for household members | 58 | 62 | 60 |
| Other activities related to unpaid caregiving services for household members | 87 | 66 | 72 |
| All care activities | 74 | 142 | 117 |
| rural+urban | |||
| Childcare and instruction | 73 | 136 | 114 |
| Care for dependent adults | 85 | 91 | 89 |
| Help to non-dependent adult household members | 89 | 65 | 72 |
| Travelling and accompanying goods or persons related to unpaid caregiving services for household members | 66 | 66 | 66 |
| Other activities related to unpaid caregiving services for household members | 83 | 64 | 69 |
| All care activities | 75 | 137 | 116 |
| Reference: Appendix Table 7 | |||
| Note: The estimates have been calculated considering all the activities in a time slot |
2.4 Unpaid domestic services for household member
Unpaid domestic service activities include activities like cooking, cleaning and shopping for household members, etc., that are undertaken by the household members for use of the household members
In this Section estimates are presented in respect of participation rates and average time spent in unpaid domestic service activities for household members.
Participation rates in unpaid domestic services activities for household member by persons of age 6 years and above
In Statement 16, participation rate in different unpaid domestic service activities for household members are presented.
Statement 16: Participation rate (\%) in a day in unpaid domestic service activities
| Description of unpaid domestic service activities | male | female | all-India person |
|---|---|---|---|
| rural | |||
| Food and meals management and preparation | 4.5 | 76.4 | 40.6 |
| Cleaning and maintaining of own dwelling and surroundings | 7.2 | 63.5 | 35.4 |
| Do-it-yourself decoration, maintenance and repair | 1.7 | 0.9 | 1.3 |
| Care and maintenance of textiles and footwear | 3.0 | 45.5 | 24.3 |
| Household management for own final use | 1.2 | 2.7 | 1.9 |
| Pet care | 1.4 | 1.3 | 1.4 |
| Shopping for own household members | 13.3 | 4.1 | 8.7 |
| Travelling, moving, transporting or accompanying goods or persons related to unpaid domestic services for household members | 7.0 | 2.1 | 4.6 |
| Other unpaid domestic services for household members | 0.9 | 2.7 | 1.8 |
| All unpaid domestic services for household members | 26.5 | 81.8 | 54.2 |
| urban | |||
| Food and meals management and preparation | 9.9 | 76.1 | 42.0 |
| Cleaning and maintaining of own dwelling and surroundings | 6.2 | 58.9 | 31.8 |
| Do-it-yourself decoration, maintenance and repair | 1.3 | 0.7 | 1.0 |
| Care and maintenance of textiles and footwear | 4.8 | 47.1 | 25.3 |
| Household management for own final use | 0.9 | 1.8 | 1.4 |
| Pet care | 0.6 | 0.7 | 0.6 |
| Shopping for own household members | 14.1 | 10.0 | 12.1 |
| Travelling, moving, transporting or accompanying goods or persons related to unpaid domestic services for household members | 6.2 | 4.0 | 5.1 |
| Other unpaid domestic services for household members | 0.5 | 1.9 | 1.1 |
| All unpaid domestic services for household members | 28.4 | 80.9 | 53.9 |
| rural+urban | |||
| Food and meals management and preparation | 6.2 | 76.3 | 41.0 |
| Cleaning and maintaining of own dwelling and surroundings | 6.9 | 62.1 | 34.3 |
| Do-it-yourself decoration, maintenance and repair | 1.6 | 0.8 | 1.2 |
| Care and maintenance of textiles and footwear | 3.6 | 46.0 | 24.6 |
| Household management for own final use | 1.1 | 2.4 | 1.8 |
| Pet care | 1.2 | 1.1 | 1.2 |
| Statement 16: Participation rate (\%) in a day in unpaid domestic service activities | |||
|---|---|---|---|
| Description of unpaid domestic service activities | male | female | all-India person |
| Shopping for own household members | 13.5 | 5.9 | 9.7 |
| Travelling, moving, transporting or accompanying goods or persons related to unpaid domestic services for household members | 6.7 | 2.7 | 4.7 |
| Other unpaid domestic services for household members | 0.8 | 2.5 | 1.6 |
| All unpaid domestic services for household members | 27.1 | 81.5 | 54.1 |
| Reference: Appendix Table 6 Note: The estimates have been calculated considering all the activities in a time slot |
Time spent in a day in unpaid domestic services activities for household member
In Statement 17, average amount of time (in minutes) spent in a day in different unpaid domestic services activities for household member per participant of age 6 years and above is presented.
Statement 17: Average time (in minutes) spent in a day per participant in unpaid domestic services activities for household member
| Description of unpaid domestic service activities | male | female rural |
person |
|---|---|---|---|
| Food and meals management and preparation | 91 | 212 | 206 |
| Cleaning and maintaining of own dwelling and surroundings | 45 | 59 | 57 |
| Do-it-yourself decoration, maintenance and repair | 64 | 69 | 66 |
| Care and maintenance of textiles and footwear | 35 | 63 | 61 |
| Household management for own final use | 54 | 81 | 73 |
| Pet care | 69 | 67 | 68 |
| Shopping for own household members | 54 | 57 | 55 |
| Travelling, moving, transporting or accompanying goods or persons related to unpaid domestic services for household members | 60 | 58 | 59 |
| Other unpaid domestic services for household members | 75 | 91 | 87 |
| All unpaid domestic services for household members | 88 | 291 | 241 |
| urban | |||
| Food and meals management and preparation | 83 | 202 | 188 |
| Cleaning and maintaining of own dwelling and surroundings | 42 | 57 | 56 |
| Do-it-yourself decoration, maintenance and repair | 51 | 53 | 52 |
| Care and maintenance of textiles and footwear | 39 | 66 | 64 |
| Household management for own final use | 61 | 78 | 72 |
| Pet care | 56 | 57 | 56 |
| Shopping for own household members | 51 | 59 | 54 |
| Travelling, moving, transporting or accompanying goods or persons related to unpaid domestic services for household members | 52 | 54 | 53 |
| Other unpaid domestic services for household members | 72 | 86 | 83 |
| All unpaid domestic services for household members | 88 | 285 | 232 |
| rural+urban | |||
| Food and meals management and preparation | 87 | 209 | 200 |
| Cleaning and maintaining of own dwelling and surroundings | 44 | 58 | 57 |
| Do-it-yourself decoration, maintenance and repair | 61 | 65 | 62 |
| Care and maintenance of textiles and footwear | 36 | 64 | 62 |
| Household management for own final use | 56 | 80 | 73 |
| Statement 17: Average time (in minutes) spent in a day per participant in unpaid domestic services activities for household member | all-India person | ||
|---|---|---|---|
| Description of unpaid domestic service activities | male | female | |
| Pet care | 67 | 65 | 66 |
| Shopping for own household members | 53 | 58 | 55 |
| Travelling, moving, transporting or accompanying goods or persons related to unpaid domestic services for household members | 58 | 56 | 57 |
| Other unpaid domestic services for household members | 74 | 90 | 86 |
| All unpaid domestic services for household members | 88 | 289 | 238 |
| Reference: Appendix Table 7 Note: The estimates have been calculated considering all the activities in a time slot |
2.5 Learning activities
The coverage of learning activities includes pre-primary, primary, secondary, technical and vocational, post-secondary and tertiary education, etc. It also covers non-formal education and courses (literacy and other special programmes for those who have no opportunity to attend school, private studies, research, courses taken in relation to hobbies and recreational games, sports, courses on Yoga, etc), and travel time related to learning.
Participation in learning and time spent in learning
In Statement 18, participation rate among persons of age 6-14 years and 15-29 years in learning activities and average time (in minutes) spent by those who are participating in learning activities are given.
Statement 18: Participation rate (\%) in learning activities and average time (in minutes) spent in a day per participant in learning activities
| category of persons | participation rate (\%) in leaning activities |
|||
|---|---|---|---|---|
| 6-14 years | 15-29 years | average time (in minutes) spent in a day per participant in learning activities |
||
| 6-14 years | 6-14 years |
15-29 years | ||
| rural | ||||
| male | 89.4 | 30.4 | 410 | 423 |
| female | 89.6 | 24.8 | 413 | 414 |
| person | 89.5 | 27.5 | 411 | 419 |
| urban | ||||
| male | 88.2 | 35 | 415 | 433 |
| female | 89.1 | 32.6 | 419 | 424 |
| person | 88.6 | 33.8 | 417 | 429 |
| rural+urban | ||||
| male | 89.1 | 31.9 | 411 | 427 |
| female | 89.5 | 27.1 | 415 | 417 |
| person | 89.3 | 29.5 | 413 | 422 |
Reference: Appendix Table 6 for estimates of participation rate and Table 7 for estimates of time spent in a day
Note: The estimates have been calculated considering all the activities in a time slot
2.6 Unpaid activities and paid activities
This Section gives the participation rates and time spent in a day in paid and unpaid activities. The list of activities used in the classification of paid activities and unpaid are as follows:
| Unpaid activities |
|---|
| care for children, sick, elderly, differently-abled persons in own |
| households |
| production of other services for own consumption |
| production of goods for own consumption |
| voluntary work for production of goods in households |
| voluntary work for production of services in households |
| voluntary work for production of goods in market/non-market units |
| voluntary work for production of services in market/non-market units |
| unpaid trainee work for production of goods |
| unpaid trainee work for production of services |
| other unpaid work for production of goods |
| other unpaid work for production of services |
| Paid activities |
| self-employment for production of goods |
| self-employment for production of services |
| regular wage/ salary for production of goods |
| regular wage/ salary for production of services |
| casual labour for production of goods |
| casual labour: for production of services |
Participation in unpaid and paid activities
In Statement 19, participation rate in unpaid activities, paid activities and residual other activities in a day are presented and average time (in minutes) spent in a day by those who participated in such activities are given in Statement 20. Corresponding estimates for each State/UT are given in Statement 11.1 and Statement 13.1, respectively. It may be noted that activities under ‘self development/ self care/ self maintenance, etc.’ are ‘residual other activities’. It may be noted that residual other activities include all other activities which are not classified as either paid activities or unpaid activities such as self-care and maintenance activities, learning, culture, leisure, massmedia and sports practices, socialising and communication, community participation and religious practice, etc.
Figure 14 and Figure 15 present a pictorial comparison of participation rate in unpaid and paid activities respectively by persons of age 6 years and above during TUS, 2019 and TUS, 2024 in rural and urban areas.
Statement 19: Participation rate (\%) in unpaid activities, paid activities and residual other activities in a day
| Description of the activity | male | female | all-India person |
|---|---|---|---|
| rural | |||
| Unpaid activity | 47.4 | 84.4 | 65.9 |
| Paid activity | 60.1 | 21.8 | 40.9 |
| all paid and unpaid activities | 74.3 | 85.1 | 79.7 |
| Residual other activities | 100 | 100 | 100 |
| Urban | |||
| Unpaid activity | 42.4 | 82.8 | 62.1 |
| Paid activity | 61.2 | 18.0 | 40.2 |
| all paid and unpaid activities | 74.6 | 84.3 | 79.3 |
| Residual other activities | 100 | 100 | 100 |
| rural+urban | |||
| Unpaid activity | 45.8 | 83.9 | 64.7 |
| Paid activity | 60.5 | 20.6 | 40.7 |
| all paid and unpaid activities | 74.4 | 84.8 | 79.6 |
| Residual other activities | 100 | 100 | 100 |
Reference: Appendix Table 12
Note: The estimates have been calculated considering all the activities in a time slot
Figure 14: Participation rate (\%) in unpaid activities among persons of age 6 years and above in rural and urban areas during TUS, 2019 and TUS, 2024
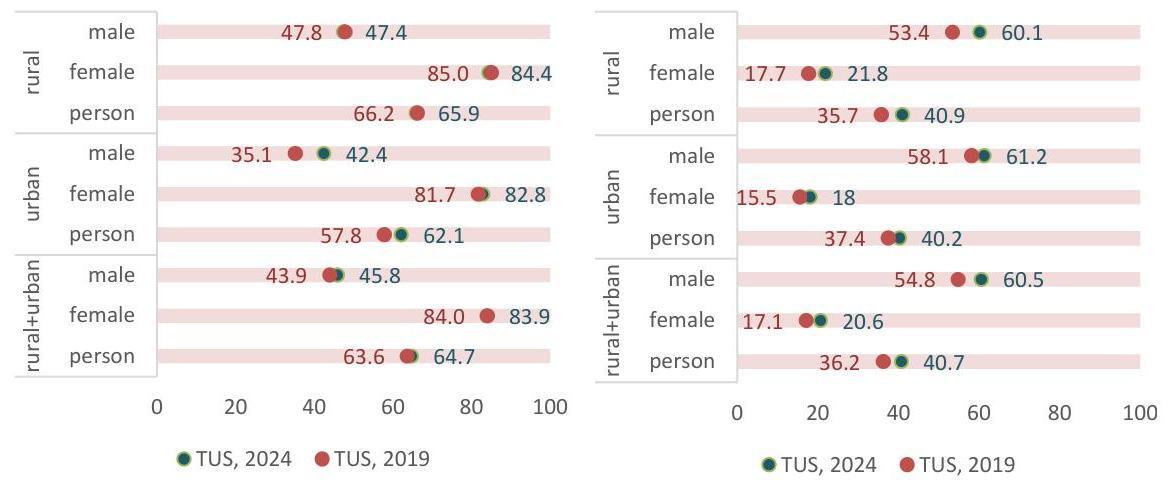
Statement 20: Average time (in minutes) spent in a day per participant in unpaid activities, paid activities and residual other activities
| Description of the activity | male | female | all-India person |
|---|---|---|---|
| rural | |||
| Unpaid activity | 133 | 373 | 287 |
| Paid activity | 394 | 285 | 365 |
| all paid and unpaid activities | 403 | 443 | 424 |
| Residual other activities | 1140 | 1063 | 1102 |
| urban | |||
| Unpaid activity | 99 | 342 | 256 |
| Paid activity | 458 | 349 | 434 |
| all paid and unpaid activities | 432 | 410 | 421 |
| Residual other activities | 1118 | 1094 | 1106 |
| rural+urban | |||
| Unpaid activity | 123 | 363 | 278 |
| Paid activity | 414 | 302 | 386 |
| all paid and unpaid activities | 412 | 433 | 423 |
| Residual other activities | 1133 | 1073 | 1103 |
| Reference: Appendix Table 14 Note: The estimates have been calculated considering all the activities in a time slot |
Average time spent per person in a day in paid and unpaid activities
To derive the distribution of total time in unpaid activities, paid activities and residual other activities by the population, the estimates of average time is obtained by considering all the persons irrespective of whether they performed the activities or not.
In Statement 21, distribution of total time of 1440 minutes in a day per person in unpaid activities, paid activities and residual other activities are presented considering all the persons irrespective of whether they performed the activity or not.
Statement 21: Average time (in minutes) spent in a day per person in unpaid activities, paid activities and residual other activities
| Description of the activity | male | female | all-India person |
|---|---|---|---|
| rural | |||
| Unpaid activity | 63 | 314 | 189 |
| Paid activity | 237 | 62 | 149 |
| all paid and unpaid activities | 300 | 377 | 338 |
| Residual other activities | 1140 | 1063 | 1102 |
| all | 1440 | 1440 | 1440 |
| urban | |||
| Unpaid activity | 42 | 283 | 159 |
| Paid activity | 280 | 63 | 175 |
| all paid and unpaid activities | 322 | 346 | 334 |
| Residual other activities | 1118 | 1094 | 1106 |
Statement 21: Average time (in minutes) spent in a day per person in unpaid activities, paid activities and residual other activities
| Description of the activity | male | female | all-India person |
|---|---|---|---|
| all | 1440 | 1440 | 1440 |
| rural+urban | |||
| Unpaid activity | 56 | 305 | 180 |
| Paid activity | 251 | 62 | 157 |
| all paid and unpaid activities | 307 | 367 | 337 |
| Residual other activities | 1133 | 1073 | 1103 |
| all | 1440 | 1440 | 1440 |
Reference: Appendix Table 13
Note: (i) The estimates have been calculated considering all the activities in a time slot (ii) Figures may not add up to 1440 due to rounding off
Statement 22: Percentage share of unpaid activities, paid activities and residual other activities of the total time in a day per person
| Description of the activity | male | female | all-India person |
|---|---|---|---|
| rural | |||
| Unpaid activity | 4.4 | 21.8 | 13.1 |
| Paid activity | 16.5 | 4.3 | 10.3 |
| all paid and unpaid activities | 20.8 | 26.2 | 23.5 |
| Residual other activities | 79.2 | 73.8 | 76.5 |
| all | 100.0 | 100.0 | 100.0 |
| urban | |||
| Unpaid activity | 2.9 | 19.7 | 11.0 |
| Paid activity | 19.4 | 4.4 | 12.2 |
| all paid and unpaid activities | 22.4 | 24.0 | 23.2 |
| Residual other activities | 77.6 | 76.0 | 76.8 |
| all | 100.0 | 100.0 | 100.0 |
| rural+urban | |||
| Unpaid activity | 3.9 | 21.2 | 12.5 |
| Paid activity | 17.4 | 4.3 | 10.9 |
| all paid and unpaid activities | 21.3 | 25.5 | 23.4 |
| Residual other activities | 78.7 | 74.5 | 76.6 |
| all | 100.0 | 100.0 | 100.0 |
Reference: Appendix Table 13
Note: (i) The estimates have been calculated considering all the activities in a time slot
(ii) Figures may not add up to 100 due to rounding off
Figure 16 and Figure 17 below, present a graphical view of average time spent per person in unpaid and paid activities, respectively, by persons of age 6 years and above during TUS, 2019 and TUS, 2024 in rural and urban areas.
Figure 16: Average time (in minutes) spent in a day per person of age 6 years and above in unpaid activities during TUS, 2019 and TUS, 2024
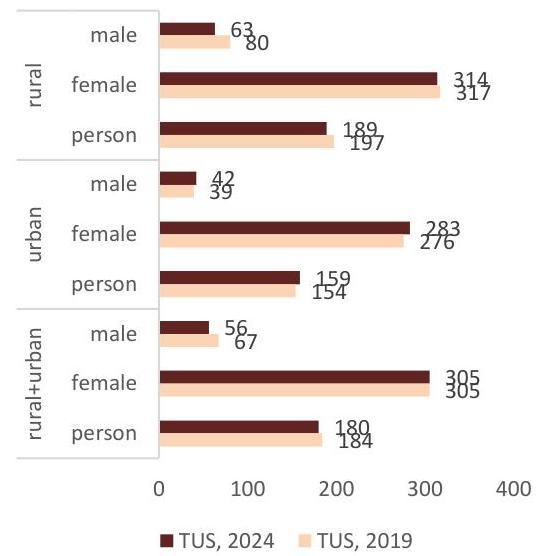
Figure 17: Average time (in minutes) spent in a day per person of age 6 years and above in paid activities during TUS, 2019 and TUS, 2024
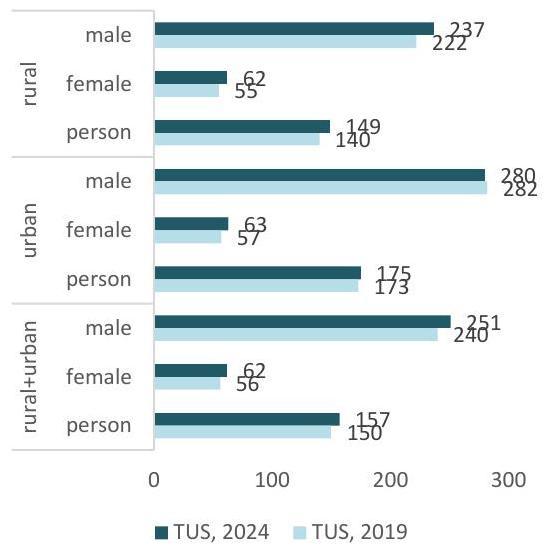
Participation in paid and unpaid activities by persons of different age groups
In Statement 23, participation rate in unpaid and paid activities are presented and average time (in minutes) spent in a day spent by those who participated in such activities are given in Statement 24 in respect of persons of age 15-29 years, 15-59 years and 60 years and above. Corresponding estimates for the persons of age 15-29 years, 15-59 years and persons of age 6 years and above for each State/UT are given in Statement 11.1 and 13.1, respectively.
Figure 18 and Figure 19 present the participation rate in a day in unpaid activities and paid activities, respectively, among persons of different age groups during TUS, 2019 and TUS, 2024
Statement 23: Participation rate (\%) in a day among different age groups in unpaid activities, paid activities and residual other activities
all-India
| Description activity |
age group | ||||||||
|---|---|---|---|---|---|---|---|---|---|
| 15-29 years | 15-59 years | 60 years and above | |||||||
| male | female | person | male | female | person | male | female | person | |
| Unpaid activity | 40.9 | 87.5 | 64.5 | 51.5 | 94.2 | 72.9 | 54.3 | 86.4 | 70.3 |
| Paid activity | 55.5 | 14.7 | 34.8 | 74.5 | 24.9 | 49.6 | 48.1 | 16.4 | 32.3 |
| all paid and unpaid | |||||||||
| activities | 70.6 | 89.1 | 80.0 | 86.5 | 95.2 | 90.9 | 78.1 | 87.5 | 82.7 |
| Residual other activities | 100.0 | 100.0 | 100.0 | 100.0 | 100.0 | 100.0 | 100.0 | 100.0 | 100.0 |
Reference: Appendix Table 12
Note: The estimates have been calculated considering all the activities in a time slot
Figure 18: Participation rate (\%) in unpaid activities among persons of different age groups during TUS, 2019 and TUS, 2024
Figure 19: Participation rate (\%) in paid activities among persons of different age groups during TUS, 2019 and TUS, 2024
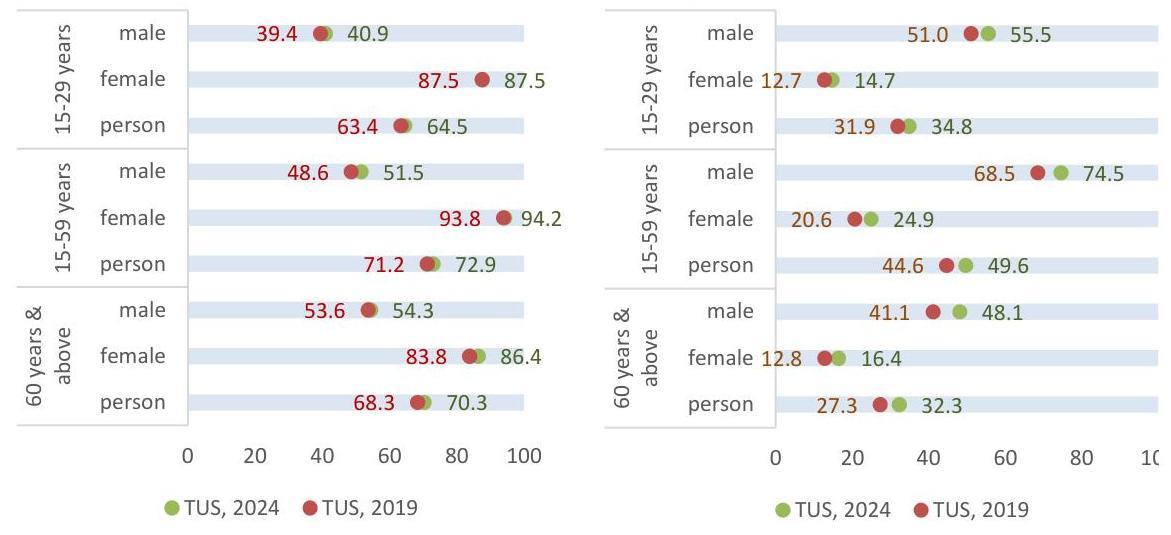
Statement 24: Average time (in minutes) spent in a day per participant of different age groups in unpaid activities, paid activities and residual other activities
| Description of the activity | age group | ||||||||
|---|---|---|---|---|---|---|---|---|---|
| 15-29 years | 15-59 years | 60 years and above | |||||||
| male | female | person | male | female | person | male | female | person | |
| Unpaid activity | 113 | 380 | 296 | 120 | 389 | 294 | 146 | 272 | 223 |
| Paid activity | 422 | 302 | 396 | 421 | 305 | 392 | 358 | 284 | 339 |
| all paid and unpaid activities | 397 | 423 | 411 | 434 | 465 | 450 | 322 | 322 | 322 |
| Residual other activities | 1160 | 1063 | 1111 | 1065 | 998 | 1031 | 1189 | 1159 | 1174 |
Reference: Appendix Table 14
Note: The estimates have been calculated considering all the activities in a time slot
Average time spent per person in a day in unpaid and paid activities for different age groups
To derive the distribution of total time in unpaid activities, paid activities and residual other activities by the population in these age groups, the estimates of average time is obtained by considering all the persons in that age group irrespective of whether they performed the activities or not.
In Statement 25, distribution of total time of 1440 minutes in a day per person for each of these age groups in unpaid activities, paid activities and residual other activities are presented considering all the persons in that age group irrespective of whether they performed the activity or not and the corresponding percentage share is given in Statement 26.
Statement 25: Average time (in minutes) spent in a day per person of different age groups in unpaid activities, paid activities and residual other activities
all-India
| Description of the activity | age group | ||||||||
|---|---|---|---|---|---|---|---|---|---|
| 15-29 years | 15-59 years | 60 years and above | |||||||
| male | female | person | male | female | person | male | female | person | |
| Unpaid activity | 46 | 332 | 191 | 62 | 366 | 215 | 79 | 235 | 157 |
| Paid activity | 234 | 44 | 138 | 314 | 76 | 194 | 172 | 47 | 110 |
| all paid and unpaid activities | 280 | 377 | 329 | 375 | 442 | 409 | 251 | 281 | 266 |
| Residual other activities | 1160 | 1063 | 1111 | 1065 | 998 | 1031 | 1189 | 1159 | 1174 |
| all | 1440 | 1440 | 1440 | 1440 | 1440 | 1440 | 1440 | 1440 | 1440 |
Reference: Appendix Table 13
Note: (i) The estimates have been calculated considering all the activities in a time slot
(ii) Figures may not add up to 1440 due to rounding
Statement 26: Percentage share of unpaid activities, paid activities and residual other activities of the total time in a day per person of different age groups
all-India
| Description of the activity | age group | ||||||||
|---|---|---|---|---|---|---|---|---|---|
| 15-29 years | 15-59 years | 60 years and above | |||||||
| male | female | person | male | female | person | male | female | person | |
| Unpaid activity | 3.2 | 23.1 | 13.3 | 4.3 | 25.4 | 14.9 | 5.5 | 16.3 | 10.9 |
| Paid activity | 16.3 | 3.1 | 9.6 | 21.8 | 5.3 | 13.5 | 11.9 | 3.3 | 7.6 |
| all paid and unpaid activities | 19.4 | 26.2 | 22.8 | 26.0 | 30.7 | 28.4 | 17.4 | 19.5 | 18.5 |
| Residual other activities | 80.6 | 73.8 | 77.2 | 74.0 | 69.3 | 71.6 | 82.6 | 80.5 | 81.5 |
| all | 100.0 | 100.0 | 100.0 | 100.0 | 100.0 | 100.0 | 100.0 | 100.0 | 100.0 |
Reference: Appendix Table 13
Note: (i) The estimates have been calculated considering all the activities in a time slot
(ii) Figures may not add up to 100 due to rounding
Figure 20: Average time (in minutes) spent in a day per person of different age group in unpaid activities during TUS, 2019 and TUS, 2024
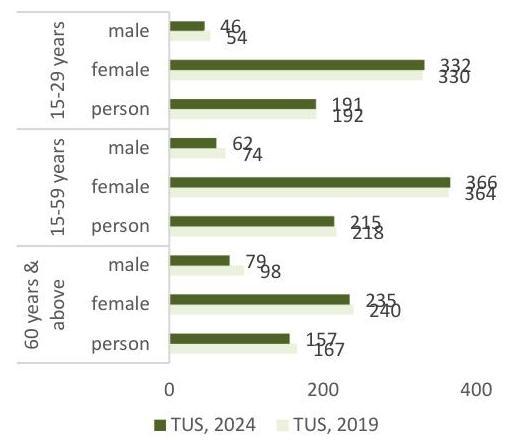
Figure 21: Average time (in minutes) spent in a day per person of different age group in paid activities during TUS, 2019 and TUS, 2024
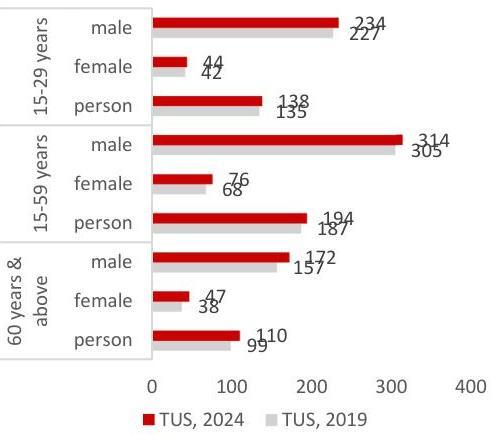
2.7 SNA production activities and non-SNA production activities
The activities included in the coverage of System of National Accounts (SNA) production boundary are termed as SNA production activities and those which are outside the SNA production boundary but within the SNA general production boundary are termed as non-SNA production and the rest are termed as residual other activities
From the information collected in the TUS 2024, the following activities have been classified as SNA production, non-SNA production and residual other activities.
SNA production:
Employment in corporations, government and non-profit institutions
Production of goods for own final use
Employment in household enterprises to produce goods
Employment in household enterprises to provide services
Ancillary activities and breaks related to employment
Training and studies in relation to employment
Employment-related travel
Unpaid trainee work and related activities
Unpaid direct volunteering for other households for production of goods or for production of goods/services for market/non-market units
Unpaid community- and organization-based volunteering for production of goods or for production of goods/services for market/non-market units
Other unpaid work activities (other than those which are already covered in SNA or covered in nonSNA production)
Non-SNA production:
Unpaid domestic services for household members
Unpaid caregiving services for household members
Unpaid direct volunteering for other households for production of services for the households
Unpaid community- and organization-based volunteering for production of services for the households
Other activities
Seeking employment
Setting up a business
Commuting
Learning
Socializing and communication, community participation and religious practice
Culture, leisure, mass-media and sports practices
Self-care and maintenance
In Statement 27, participation rate participating in SNA production activities and non-SNA production activities in a day are presented and average amount of time (in minutes) in a day spent by those who participated in such activities are given in Statement 28. Corresponding estimates for each State/UT are given in Statement 15.1.
| Statement 27: Participation rate (\%) in SNA production, non-SNA production and residual other activities in a day | |||
|---|---|---|---|
| Description of the activity | male | female rural | $\begin{aligned} & \text { all-India } \ & \text { person } \end{aligned}$ |
| SNA production | 66.8 | 42.1 | 54.4 |
| Non-SNA production | 39.0 | 83.7 | 61.4 |
| SNA and non-SNA production | 74.3 | 85.1 | 79.7 |
| Residual other activities | 100 | 100 | 100 |
| Urban | |||
| SNA production | 62.7 | 25.6 | 44.7 |
| Non-SNA production | 41 | 82.7 | 61.2 |
| SNA and non-SNA production | 74.6 | 84.3 | 79.3 |
| Residual other activities | 100 | 100 | 100 |
| rural+urban | |||
| SNA production | 65.5 | 37.1 | 51.4 |
| Non-SNA production | 39.6 | 83.4 | 61.4 |
| SNA and non-SNA production | 74.4 | 84.8 | 79.6 |
| Residual other activities | 100 | 100 | 100 |
| Reference: Appendix Table 36 Note: The estimates have been calculated considering all the activities in a time slot |
Figure 22: Participation rate (\%) in SNA production activities among persons of age 6 years and above during TUS, 2019 and TUS, 2024
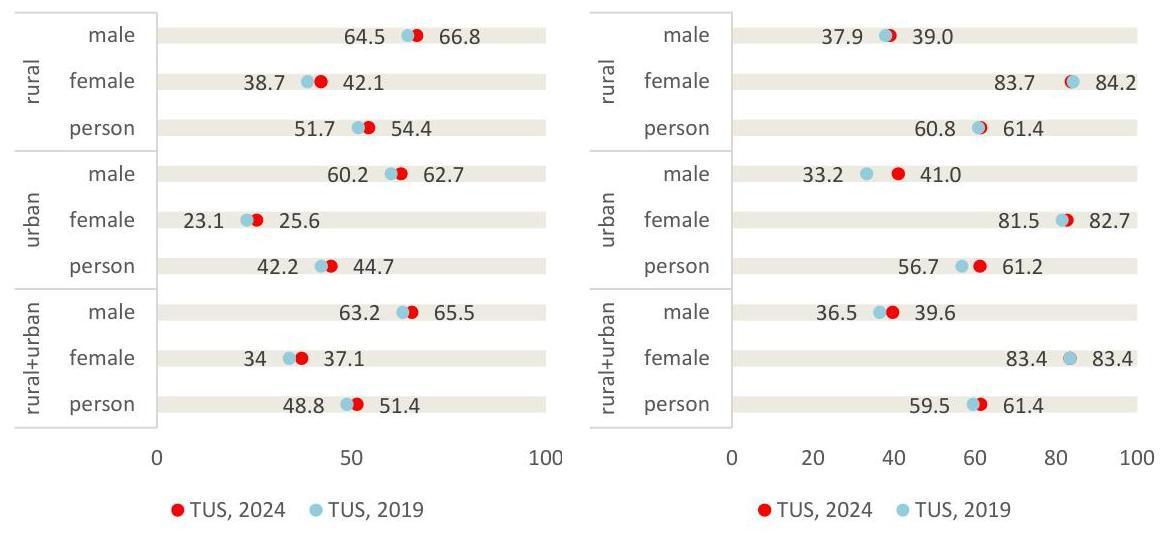
Statement 28: Average time (in minutes) spent in a day per participant in SNA production, non-SNA production and residual other activities
| Description of the activity | male | female rural |
person |
|---|---|---|---|
| SNA production | 392 | 216 | 324 |
| Non-SNA production | 97 | 341 | 264 |
| SNA and non-SNA production | 403 | 443 | 424 |
| Residual other activities | 1140 | 1063 | 1102 |
| urban | |||
| SNA production | 452 | 266 | 401 |
| Non-SNA production | 94 | 336 | 253 |
| SNA and non-SNA production | 432 | 410 | 421 |
| Residual other activities | 1118 | 1094 | 1106 |
| rural+urban | |||
| SNA production | 410 | 226 | 344 |
| Non-SNA production | 96 | 340 | 261 |
| SNA and non-SNA production | 412 | 433 | 423 |
| Residual other activities | 1133 | 1073 | 1103 |
| Reference: Appendix Table 36 Note: The estimates have been calculated considering all the activities in a time slot |
Figure 24: Average time (in minutes) spent in a day per participant of age 6 years and above in SNA production activities during TUS, 2019 and TUS, 2024
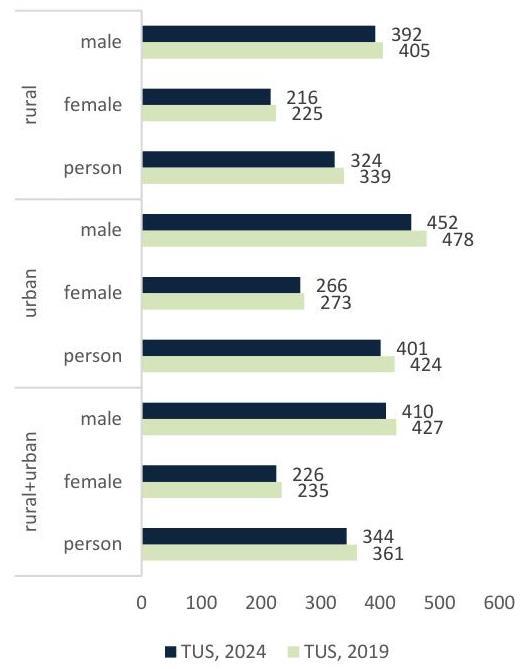
Figure 25: Average time (in minutes) spent in a day per participant of age 6 years and above in non-SNA production activities during TUS, 2019 and TUS, 2024
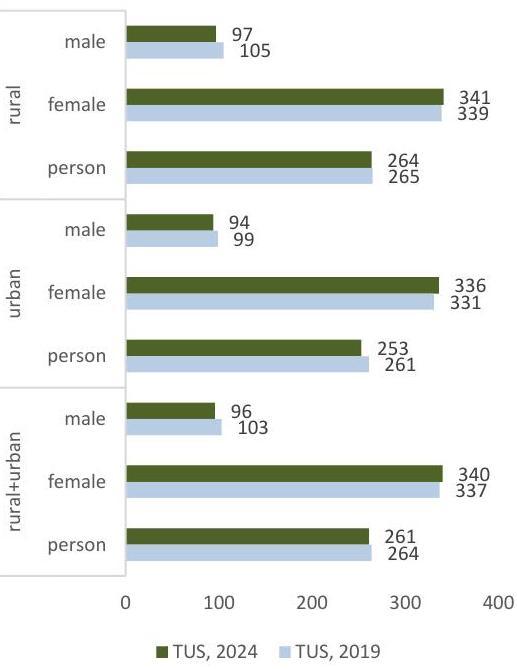
To derive the distribution of total time in SNA production, non-SNA production and residual other activities by the population, the estimates of average time is obtained by considering all the persons irrespective of whether they performed the activities or not.
In Statement 29, distribution of total time of 1440 minutes in a day per person in SNA production, non-SNA production and residual other activities are presented considering all the persons irrespective of whether they performed the activity or not and corresponding percentage share is given in Statement 30. Corresponding estimates for each State/UT are given in Statement 17.1.
| Description of the activity | male | female | all-India person |
|---|---|---|---|
| rural | |||
| SNA production | 262 | 91 | 176 |
| Non-SNA production | 38 | 286 | 162 |
| SNA and non-SNA production | 300 | 377 | 338 |
| Residual other activities | 1140 | 1063 | 1102 |
| total | 1440 | 1440 | 1440 |
| Urban | |||
| SNA production | 283 | 68 | 179 |
| Non-SNA production | 39 | 278 | 155 |
| SNA and non-SNA production | 322 | 346 | 334 |
| Residual other activities | 1118 | 1094 | 1106 |
| total | 1440 | 1440 | 1440 |
| rural+urban | |||
| SNA production | 269 | 84 | 177 |
| Non-SNA production | 38 | 283 | 160 |
| SNA and non-SNA production | 307 | 367 | 337 |
| Residual other activities | 1133 | 1073 | 1103 |
| total | 1440 | 1440 | 1440 |
| Reference: Appendix Table 42 | |||
| Note: (i) The estimates have been calculated considering all the activities in a time slot | |||
| (ii) Figures may not add up to 1440 due to rounding off |
Statement 30: Percentage share of SNA production, non-SNA production and residual other activities of the total time in a day per person
| Description of the activity | male | female | all-India person |
|---|---|---|---|
| rural | |||
| SNA production | 18.2 | 6.3 | 12.2 |
| Non-SNA production | 2.6 | 19.9 | 11.3 |
| SNA and non-SNA production | 20.8 | 26.2 | 23.5 |
| Residual other activities | 79.2 | 73.8 | 76.5 |
| all | 100.0 | 100.0 | 100.0 |
| urban | |||
| SNA production | 19.7 | 4.7 | 12.4 |
| Non-SNA production | 2.7 | 19.3 | 10.8 |
| SNA and non-SNA production | 22.4 | 24.0 | 23.2 |
| Residual other activities | 77.6 | 76.0 | 76.8 |
| all | 100.0 | 100.0 | 100.0 |
Statement 30: Percentage share of SNA production, non-SNA production and residual other activities of the total time in a day per person
| Description of the activity | male | female | all-India person |
|---|---|---|---|
| rural+urban | |||
| SNA production | 18.7 | 5.8 | 12.3 |
| Non-SNA production | 2.6 | 19.7 | 11.1 |
| SNA and non-SNA production | 21.3 | 25.5 | 23.4 |
| Residual other activities | 78.7 | 74.5 | 76.6 |
| all | 100.0 | 100.0 | 100.0 |
Reference: Appendix Table 42
Note: (i) The estimates have been calculated considering all the activities in a time slot
(ii) Figures may not add up to 100 due to rounding
Participation in SNA production and non-SNA production activities by persons of different age groups
In Statement 31, participation rate in SNA production, non-SNA production and residual other activities are given and average amount of time (in minutes) spent in a day by those who participated in such activities are given in respect of persons of age 15-29 years, 15-59 years and 60 years and above in Statement 32. Graphical presentation of the participation rate in SNA production, non-SNA production and residual other activities during TUS, 2019 and TUS, 2024 are given in Figures 26 and 27.
Statement 31: participation rate (\%) among persons of different age groups in SNA production, non-SNA production and residual other activities in a day
all-India
| Description of the activity | age group | ||||||||
|---|---|---|---|---|---|---|---|---|---|
| 15-29 years | 15-59 years | 60 years and above | |||||||
| male | female | person | male | female | person | male | female | person | |
| SNA production | 60.3 | 30.1 | 45.0 | 79.2 | 43.4 | 61.2 | 58.6 | 34.8 | 46.7 |
| Non-SNA production | 35.9 | 87.2 | 61.9 | 45.0 | 93.9 | 69.5 | 44.4 | 85.4 | 64.8 |
| SNA and non-SNA production | 70.6 | 89.1 | 80.0 | 86.5 | 95.2 | 90.9 | 78.1 | 87.5 | 82.7 |
| Residual other activities | 100.0 | 100.0 | 100.0 | 100.0 | 100.0 | 100.0 | 100.0 | 100.0 | 100.0 |
Reference: Appendix Table 36
Note: The estimates have been calculated considering all the activities in a time slot
Figure 26: Participation rate (\%) in SNA
Figure 27: Participation rate (\%) in non-SNA production activities among persons of different age group during TUS, 2019 and TUS, 2024
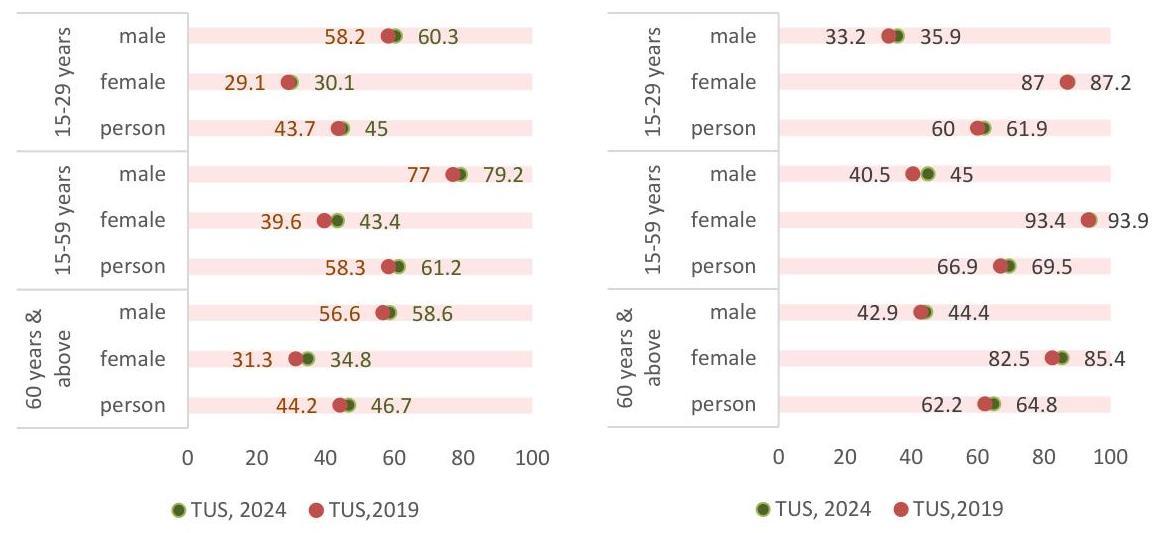
Statement 32: Average time (in minutes) spent in a day per participant of different age groups in SNA production, non-SNA production and residual other activities in a day
all-India
| Description of the activity | age group | ||||||||
|---|---|---|---|---|---|---|---|---|---|
| 15-29 years | 15-59 years | 60 years and above | |||||||
| male | female | person | male | female | person | male | female | person | |
| SNA production | 408 | 199 | 337 | 420 | 232 | 353 | 347 | 205 | 294 |
| Non-SNA production | 95 | 364 | 287 | 95 | 364 | 277 | 108 | 246 | 199 |
| SNA and non-SNA production | 397 | 423 | 411 | 434 | 465 | 450 | 322 | 322 | 322 |
| Residual other activities | 1160 | 1063 | 1111 | 1065 | 998 | 1031 | 1189 | 1159 | 1174 |
| Reference: Appendix Table 36 | |||||||||
| Note: The estimates have been calculated considering all the activities in a time slot |
Figure 28 and figure 29 present a graphical comparison of average time spent per participant in SNA activities and Non-SNA activities respectively, during TUS, 2019 and TUS, 2024 among persons of different age group.
Figure 28: Average time (in minutes) spent in a day per participant of different age group in SNA production activities during TUS, 2019 and TUS, 2024
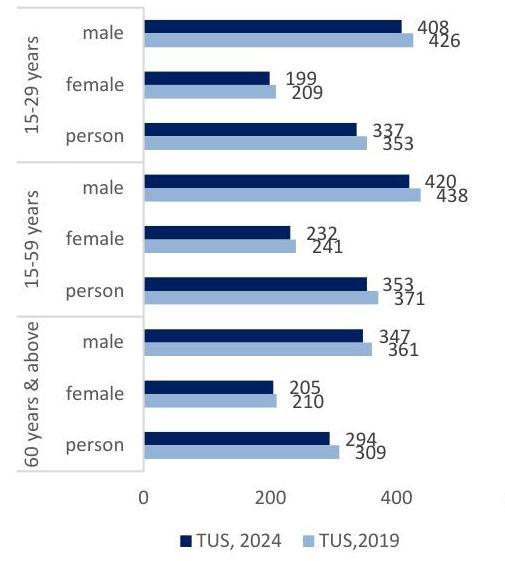
Figure 29: Average time (in minutes) spent in a day per participant of different age group in non-SNA production activities during TUS, 2019 and TUS, 2024
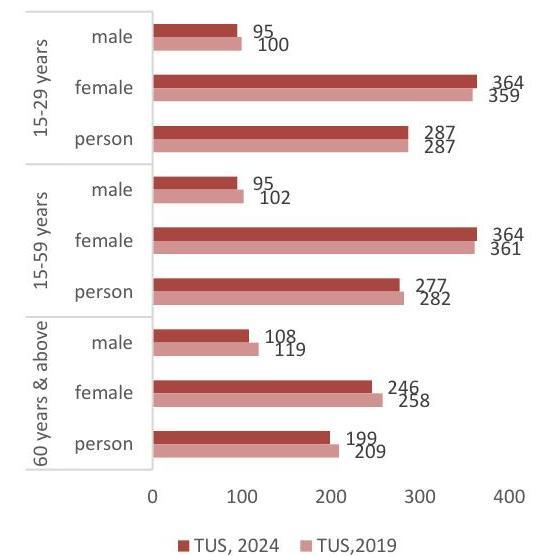
Average time spent per person in a day in SNA production and non-SNA production activities for different age groups
To derive the distribution of total time in SNA production, non-SNA production and residual other activities by the population in these age groups, the estimates of average time is obtained by considering all the persons in that age group irrespective of whether they performed the activities or not.
In Statement 33, distribution of total time of 1440 minutes in a day per person for each of these age groups in SNA production, non-SNA production and residual other activities are presented considering all the persons in that age group irrespective of whether they performed the activity or not and the corresponding percentage distribution is given in Statement 34.
Statement 33: Average time (in minutes) spent in a day per person of different age groups in SNA production, non-SNA production and residual other activities
all-India
| Description of the activity | age group | ||||||||
|---|---|---|---|---|---|---|---|---|---|
| 15-29 years | 15-59 years | 60 years and above | |||||||
| Male | female | person | male | female | person | male | female | person | |
| SNA production | 246 | 59 | 152 | 333 | 100 | 216 | 204 | 72 | 138 |
| Non-SNA production | 34 | 317 | 177 | 43 | 342 | 193 | 48 | 210 | 129 |
| SNA and non-SNA production | 280 | 376 | 329 | 376 | 442 | 409 | 252 | 282 | 267 |
| Residual other activities | 1160 | 1063 | 1111 | 1065 | 998 | 1031 | 1189 | 1159 | 1174 |
| All | 1440 | 1440 | 1440 | 1440 | 1440 | 1440 | 1440 | 1440 | 1440 |
Reference: Appendix Table 42
Note: (i) The estimates have been calculated considering all the activities in a time slot
(ii) Figures may not add up to 1440 due to rounding off
Statement 34: Percentage share of SNA production, non-SNA production and residual other activities of the total time in a day per person of different age groups
all-India
| Description of the activity | age group | ||||||||
|---|---|---|---|---|---|---|---|---|---|
| 15-29 years | 15-59 years | 60 years and above | |||||||
| male | female | person | male | female | person | male | female | person | |
| SNA production | 17.1 | 4.1 | 10.6 | 23.1 | 6.9 | 15.0 | 14.2 | 5.0 | 9.6 |
| Non-SNA production | 2.4 | 22.0 | 12.3 | 3.0 | 23.8 | 13.4 | 3.3 | 14.6 | 9.0 |
| SNA and non-SNA production | 19.4 | 26.1 | 22.8 | 26.1 | 30.7 | 28.4 | 17.5 | 19.6 | 18.5 |
| Residual other activities | 80.6 | 73.8 | 77.2 | 74.0 | 69.3 | 71.6 | 82.6 | 80.5 | 81.5 |
| All | 100.0 | 100.0 | 100.0 | 100.0 | 100.0 | 100.0 | 100.0 | 100.0 | 100.0 |
Reference: Appendix Table 42
Note: (i) The estimates have been calculated considering all the activities in a time slot
(ii) Figures may not add up to 100 due to rounding
Participation in unpaid SNA production and paid activities
SNA production activities include both paid activities and unpaid activities while all the non-SNA production activities are covered under unpaid activities. To understand the extent of paid and unpaid work in SNA activities, participation rate participating in unpaid SNA production, non-SNA production and paid activities are given in Statement 35 and, average amount of time (in minutes) in a day spent by those who participated in such activities are given in Statement 36. Corresponding estimates for each State/UT are given in Statement 17.1.
Statement 35: Participation rate (\%) in unpaid SNA production, non-SNA production and paid activities in a day
| Description of the activity | male | female rural |
person |
|---|---|---|---|
| Unpaid activities: SNA production | 17.6 | 25.9 | 21.8 |
| Unpaid activities: Non-SNA production | 39.0 | 83.7 | 61.4 |
| all unpaid activities | 47.4 | 84.4 | 65.9 |
| Paid activities | 60.1 | 21.8 | 40.9 |
| all paid and unpaid activities | 74.3 | 85.1 | 79.7 |
| Urban | |||
| Unpaid activities: SNA production | 3.7 | 9.2 | 6.4 |
| Unpaid activities: Non-SNA production | 41.0 | 82.7 | 61.2 |
| all unpaid activities | 42.4 | 82.8 | 62.1 |
| Paid activities | 61.2 | 18.0 | 40.2 |
| All paid and unpaid activities | 74.6 | 84.3 | 79.3 |
| rural+urban | |||
| Unpaid activities: SNA production | 13.2 | 20.8 | 17.0 |
| Unpaid activities: Non-SNA production | 39.6 | 83.4 | 61.4 |
| all unpaid activities | 45.8 | 83.9 | 64.7 |
| Paid activities | 60.5 | 20.6 | 40.7 |
| all paid and unpaid activities | 74.4 | 84.8 | 79.6 |
| Reference: Appendix Table 42 | |||
| Note: The estimates have been calculated considering all the activities in a time slot |
Statement 36: Average time (in minutes) spent in a day per participant in unpaid SNA production, non-SNA production and paid activities in a day
| Description of the activity | male | female rural |
person |
|---|---|---|---|
| Unpaid activities: SNA production | 143 | 111 | 124 |
| Unpaid activities: Non-SNA production | 97 | 341 | 264 |
| all unpaid activities | 133 | 373 | 287 |
| Paid activities | 394 | 285 | 365 |
| all paid and unpaid activities | 403 | 443 | 424 |
| Urban | |||
| Unpaid activities: SNA production | 88 | 59 | 67 |
| Unpaid activities: Non-SNA production | 94 | 336 | 253 |
| all unpaid activities | 99 | 342 | 256 |
| Paid activities | 458 | 349 | 434 |
| all paid and unpaid activities | 432 | 410 | 421 |
| rural+urban | |||
| Unpaid activities: SNA production | 138 | 104 | 117 |
| Unpaid activities: Non-SNA production | 96 | 340 | 261 |
| all unpaid activities | 123 | 363 | 278 |
| Paid activities | 414 | 302 | 386 |
| all paid and unpaid activities | 412 | 433 | 423 |
Reference: Appendix Table 42
Note: The estimates have been calculated considering all the activities in a time slot
Average time spent per person in a day in unpaid SNA production, non-SNA production and paid activities
In Statement 37, distribution of total time of paid and unpaid activities in a day per person in unpaid SNA production, non-SNA production and paid activities are given and percentage share of time in paid and unpaid activities among unpaid SNA production, non-SNA production and paid activities are presented in Statement 38. Corresponding estimates for each State/UT are given in Statement 17.1.
Statement 37: Average time (in minutes) spent in a day per person in unpaid SNA production, non-SNA production and paid activities
| Description of the activity | male | female rural |
|
|---|---|---|---|
| Unpaid activities: SNA production | 25 | 29 | 27 |
| Unpaid activities: Non-SNA production | 38 | 286 | 162 |
| all unpaid activities | 63 | 314 | 189 |
| Paid activities | 237 | 62 | 149 |
| total in paid and unpaid activities | 300 | 377 | 338 |
| urban | |||
| Unpaid activities: SNA production | 3 | 5 | 4 |
| Unpaid activities: Non-SNA production | 39 | 278 | 155 |
| all unpaid activities | 42 | 283 | 159 |
| Paid activities | 280 | 63 | 175 |
| total in paid and unpaid activities | 322 | 346 | 334 |
Statement 37: Average time (in minutes) spent in a day per person in unpaid SNA production, non-SNA production and paid activities
| Description of the activity | male | female | all-India person |
|---|---|---|---|
| rural+urban | |||
| Unpaid activities: SNA production | 18 | 22 | 20 |
| Unpaid activities: Non-SNA production | 38 | 283 | 160 |
| all unpaid activities | 56 | 305 | 180 |
| Paid activities | 251 | 62 | 157 |
| total in paid and unpaid activities | 307 | 367 | 337 |
Reference:Appendix Table 42
Note: (i) The estimates have been calculated considering all the activities in a time slot
(ii) Estimates of paid and unpaid activities may not add up to total of paid and unpaid activities due to rounding off
Statement 38: Percentage share of time in unpaid SNA production and paid activities of the total time in SNA production in a day per person
| all-India | |||
|---|---|---|---|
| Description of the activity | male | female | person |
| rural | |||
| Unpaid SNA production | 9.5 | 31.9 | 15.3 |
| Paid activities | 90.5 | 68.1 | 84.7 |
| Total SNA production | 100 | 100 | 100 |
| urban | |||
| Unpaid SNA production | 1.1 | 7.4 | 2.2 |
| Paid activities | 98.9 | 92.6 | 97.8 |
| Total SNA production | 100 | 100 | 100 |
| rural+urban | |||
| Unpaid SNA production | 6.7 | 26.2 | 11.3 |
| Paid activities | 93.3 | 73.8 | 88.7 |
| Total SNA production | 100 | 100 | 100 |
Reference:Appendix Table 42
Note: The estimates have been calculated considering all the activities in a time slot
2.8 Travel Time
Travelling is included as an activity in all the nine major Divisions of the TUS activity classification as follows:
- Travelling and commuting for employment
- Travelling, moving, transporting or accompanying goods or persons related to own-use production of goods
- Travelling, moving, transporting or accompanying goods or persons related to unpaid domestic services for household members
- Travelling and accompanying goods or persons related to unpaid caregiving services for household members
- Travelling time related to unpaid volunteer, trainee and other unpaid work
- Travelling time related to learning
- Travelling time related to socializing and communication, community participation and religious practice
- Travelling time related to culture, leisure, mass-media and sports practices
- Travelling time related to self-care and maintenance activities
In this Section, average time spent in a day for travelling in the total time in a day per person (i.e., considering all the persons irrespective of whether they travelled or not) and percentage share of travel time in total time of a day is presented in Statement 39.
Statement 39: Average time (in minutes) spent in a day per person different age groups in travelling all-India
| Age group | average time (in minutes) spent in a day per person |
percentage share of travel time in total time of a day per person |
||||
|---|---|---|---|---|---|---|
| male | female | person | male | female | person | |
| rural | ||||||
| 15-29 years | 61 | 22 | 41 | 4.2 | 1.5 | 2.8 |
| 15-59 years | 66 | 22 | 42 | 4.6 | 1.5 | 2.9 |
| 60 years and above | 46 | 16 | 30 | 3.2 | 1.1 | 2.1 |
| all (6 years and above) | 59 | 23 | 40 | 4.1 | 1.6 | 2.8 |
| urban | ||||||
| 15-29 years | 60 | 30 | 46 | 4.2 | 2.1 | 3.2 |
| 15-59 years | 65 | 25 | 46 | 4.5 | 1.7 | 3.2 |
| 60 years and above | 38 | 12 | 24 | 2.6 | 0.8 | 1.7 |
| all (6 years and above) | 59 | 25 | 43 | 4.1 | 1.7 | 3.0 |
| rural+urban | ||||||
| 15-29 years | 61 | 25 | 42 | 4.2 | 1.7 | 2.9 |
| 15-59 years | 65 | 23 | 46 | 4.5 | 1.6 | 3.2 |
| 60 years and above | 43 | 14 | 28 | 3.0 | 1.0 | 1.9 |
| all (6 years and above) | 59 | 24 | 43 | 4.1 | 1.7 | 3.0 |
Reference: Appendix Table 8
Note: The estimates have been calculated considering all the activities in a time slot
2.9 Self-care and maintenance activities
Self-care and maintenance activities refer to activities that are required by the persons in relation to their biological needs, such as sleeping, eating, drinking, personal hygiene and care, etc.
In this Section, share of time in self-care and maintenance, like sleeping, eating and drinking, personal hygiene and care, etc., in the total time in a day per person of age 6 years and above (i.e., considering all the persons of age 6 years and above irrespective of whether their participation in such activities) is presented in Statement 40.
Statement 40: Average time (in minutes) spent in a day per person different age groups in self-care and maintenance activities
| type of self-care and maintenance activities | average time (in minutes) spent in a day per person | percentage share of time spent in self-care and maintenance activities in total time of a day | ||||
|---|---|---|---|---|---|---|
| male | female | person | male | female | person | |
| rural | ||||||
| Sleep and related activities | 546 | 550 | 548 | 37.9 | 38.2 | 38.1 |
| Eating and drinking | 95 | 87 | 91 | 6.6 | 6.0 | 6.3 |
| Personal hygiene and care | 70 | 66 | 68 | 4.9 | 4.6 | 4.7 |
| Other activities related to self-care and maintenance activities | 1 | 1 | 1 | 0.1 | 0.1 | 0.1 |
| all self-care and maintenance activities | 715 | 707 | 711 | 49.7 | 49.1 | 49.4 |
| urban | ||||||
| Sleep and related activities | 532 | 550 | 541 | 36.9 | 38.2 | 37.6 |
| Eating and drinking | 94 | 88 | 91 | 6.5 | 6.1 | 6.3 |
| Personal hygiene and care | 67 | 64 | 66 | 4.7 | 4.4 | 4.6 |
| Other activities related to self-care and maintenance activities | 0 | 0 | 0 | 0.0 | 0.0 | 0.0 |
| all self-care and maintenance activities | 697 | 705 | 701 | 48.4 | 49.0 | 48.7 |
| rural+urban | ||||||
| Sleep and related activities | 542 | 550 | 546 | 37.6 | 38.2 | 37.9 |
| Eating and drinking | 94 | 87 | 91 | 6.5 | 6.0 | 6.3 |
| Personal hygiene and care | 69 | 65 | 67 | 4.8 | 4.5 | 4.7 |
| Other activities related to self-care and maintenance activities | 1 | 1 | 1 | 0.1 | 0.1 | 0.1 |
| all self-care and maintenance activities | 710 | 706 | 708 | 49.3 | 49.0 | 49.2 |
Reference: Appendix Table 8
Note: The estimates have been calculated considering all the activities in a time slot
2.10 Respondent type in TUS, 2024
For any member of the selected household, information on time use was planned to be collected only from that household member. In some situations information was collected from other household members when the household member was not able to provide information or the household member could not be contacted even after best efforts. Only in extreme cases information was collected from a person who is not a member of the household but closely associated with the household to collect reliable information for the household member. If for a household member information is collected from more than one type of informants mentioned above, then the type of informant from whom bulk of the information was collected is considered as the informant.
Relationship of the informant with the household member for whom information on time use was collected
In Statement 41, distribution of the persons of age 6 years and above by the relationship of the informant with the person in respect of whom information on time use was collected is given. Percentage distribution of persons of age 6 years and above by relationship of the informant with the household member for whom information on time use was collected is given in Statement 2.1 for each State/UT.
Statement 41: Percentage distribution of persons of age 6 years and above by relationship of the informant with the person in respect of whom information on time use was collected
all-India
| relationship informant household member |
the the |
rural | urban | rural+urban | ||||||
|---|---|---|---|---|---|---|---|---|---|---|
| male | female | person | male | female | person | male | female | person | ||
| informant | self | 53.8 | 65.6 | 59.7 | 54.8 | 67.4 | 60.9 | 54.1 | 66.2 | 60.1 |
| is a household member |
other household members |
44.5 | 32.9 | 38.6 | 43.3 | 30.9 | 37.3 | 44.1 | 32.3 | 38.2 |
| informant is not a household member but is closely associated with the household |
0.9 | 0.8 | 0.8 | 1.1 | 0.8 | 1.0 | 0.9 | 0.8 | 0.9 | |
| information on time use could not be collected |
0.9 | 0.7 | 0.8 | 0.8 | 0.8 | 0.8 | 0.9 | 0.7 | 0.8 | |
| all | 100.0 | 100.0 | 100.0 | 100.0 | 100.0 | 100.0 | 100.0 | 100.0 | 100.0 | 100.0 |
Note: Figures may not add up to 100 due to not reported cases and rounding off
Reference: Appendix Table 3
Day of the week on which information on time use was collected
The distribution of the days of the week on which information on time use was collected from the members of the selected households is given in Statement 42 to have an idea about uniformity of the spread of the different days of the week in collection of information on time use. It may be mentioned that in TUS, 14 households were selected from each FSU and two households were planned to be canvassed each day over the 7 days of a week.
Statement 42: Percentage distribution of persons of age 6 years and above by day of the week on which information on time use was collected
all-India
| day of the week |
rural | urban | rural+urban | ||||||
|---|---|---|---|---|---|---|---|---|---|
| male | female | person | male | female | person | male | female | person | |
| Monday | 14.5 | 14.6 | 14.6 | 14.6 | 14.9 | 14.8 | 14.6 | 14.7 | 14.6 |
| Tuesday | 14.5 | 14.5 | 14.5 | 14.6 | 14.8 | 14.7 | 14.5 | 14.6 | 14.6 |
| Wednesday | 14.4 | 14.4 | 14.4 | 14.2 | 14.3 | 14.3 | 14.4 | 14.4 | 14.4 |
| Thursday | 14.4 | 14.5 | 14.4 | 14.3 | 14.4 | 14.4 | 14.4 | 14.5 | 14.4 |
| Friday | 14.5 | 14.6 | 14.5 | 14.4 | 14.4 | 14.4 | 14.5 | 14.5 | 14.5 |
| Saturday | 14.4 | 14.3 | 14.3 | 14.2 | 13.9 | 14.1 | 14.4 | 14.2 | 14.3 |
| Sunday | 13.2 | 13.2 | 13.2 | 13.5 | 13.4 | 13.4 | 13.3 | 13.2 | 13.3 |
| all | 100.0 | 100.0 | 100.0 | 100.0 | 100.0 | 100.0 | 100.0 | 100.0 | 100.0 |
Figures may not add up to 100 due to not reported cases of day of the week and rounding off
Reference: Appendix Table 3
State/UT level Estimates
Statement Title
No.
1.1 Percentage of population of age 6 years and above for each State/ UT
2.1 Percentage distribution of persons of age 6 years and above by relationship of the informant with the household member
3.1 Percentage of persons participating in a day in activities of major divisions of TUS activity classification as major activity (considering only the major activity of the time slots)
4.1 Minutes spent in a day on an average per participant in the activities of major divisions of TUS activity classification as a major activity (considering only the major activity of the time slots)
5.1 Percentage of persons participating in a day in activities of major divisions of TUS activity classification irrespective of whether it is a major activity or not (considering all the activities in a time slot)
6.1 Minutes spent in a day on an average per participant in the activities of major divisions of TUS activity classification irrespective of whether it is a major activity or not (considering all the activities in a time slot)
7.1 Minutes spent in a day on an average per person in the activities of major divisions of TUS activity classification irrespective of whether it is a major activity or not (considering all the activities in a time slot)
8.1 Percentage of persons participating in a day in self development activities, unpaid activities and paid activities as a major activity (considering only the major activity of the time slots)
9.1 Minutes spent in a day on an average per participant in self development activity, unpaid activities and paid activities as a major activity (considering only the major activity of the time slots)
10.1 Minutes spent in a day on an average per person in self development activity, unpaid activities and paid activities as a major activity (considering only the major activity of the time slots)
11.1 Percentage of persons participating in a day in self development activity, unpaid activities and paid activities irrespective of whether it is a major activity or not (considering all the activities in a time slot)
12.1 Minutes spent in a day on an average per person in self development activity, unpaid activities and paid activities irrespective of whether it is a major activity or not (considering all the activities in a time slot)
13.1 Minutes spent in a day on an average per participant in self development, unpaid activities and paid activities irrespective of whether it is a major activity or not (considering all the activities in a time slot)
14.1 Percentage of persons and minutes spent in a day on an average per participant in SNA production/NonSNA production/residual other activities where the activity was a major activity (considering only the major activity of the time slots)
15.1 Percentage of persons and minutes spent in a day on an average per participant in SNA production/NonSNA production/residual other activities irrespective of whether it is a major activity or not (considering all the activities in a time slot)
16.1 Percentage of persons and minutes spent in a day on an average per person/per participant of different age groups where the activity was a major activity (considering only the major activity of the time slots)
17.1 Percentage of persons and minutes spent in a day on an average per person/per participant of different age groups irrespective of whether the activity was a major activity or not (considering all the activities in a time slot)
| State/ UT | estimated percentage of population | ||||||||
|---|---|---|---|---|---|---|---|---|---|
| rural | urban | all-India | |||||||
| male | female | persons | male | female | persons | male | female | persons | |
| (1) | (2) | (3) | (4) | (5) | (6) | (7) | (8) | (9) | (10) |
| Andhra Pradesh | 87.0 | 87.3 | 87.1 | 87.2 | 88.1 | 87.7 | 87.0 | 87.6 | 87.3 |
| Arunachal Pradesh | 64.5 | 71.2 | 67.6 | 72.7 | 74.9 | 73.7 | 66.1 | 71.9 | 68.7 |
| Assam | 83.9 | 84.6 | 84.2 | 88.8 | 88.8 | 88.8 | 84.5 | 85.0 | 84.7 |
| Bihar | 78.6 | 80.6 | 79.6 | 83.3 | 83.6 | 83.4 | 79.1 | 80.9 | 80.0 |
| Chhattisgarh | 87.8 | 87.6 | 87.7 | 89.2 | 90.0 | 89.6 | 88.1 | 88.1 | 88.1 |
| Delhi | 84.4 | 75.4 | 80.5 | 83.9 | 82.0 | 83.1 | 83.9 | 81.6 | 82.9 |
| Goa | 86.6 | 90.5 | 88.6 | 89.7 | 87.3 | 88.5 | 88.5 | 88.5 | 88.5 |
| Gujarat | 88.0 | 88.6 | 88.3 | 89.9 | 89.9 | 89.9 | 88.8 | 89.2 | 89.0 |
| Haryana | 86.1 | 86.7 | 86.4 | 85.3 | 84.6 | 85.0 | 85.7 | 85.7 | 85.7 |
| Himachal Pradesh | 86.0 | 87.9 | 87.0 | 87.5 | 88.3 | 87.9 | 86.2 | 87.9 | 87.1 |
| Jharkhand | 81.7 | 84.3 | 83.0 | 87.4 | 88.4 | 87.9 | 82.8 | 85.1 | 83.9 |
| Karnataka | 83.1 | 83.1 | 83.1 | 84.3 | 84.7 | 84.5 | 83.6 | 83.7 | 83.7 |
| Kerala | 89.7 | 89.5 | 89.6 | 90.7 | 92.3 | 91.6 | 90.2 | 90.8 | 90.5 |
| Madhya Pradesh | 83.4 | 83.3 | 83.4 | 85.6 | 86.1 | 85.8 | 84.0 | 84.1 | 84.1 |
| Maharashtra | 88.6 | 88.6 | 88.6 | 88.0 | 89.0 | 88.5 | 88.4 | 88.7 | 88.6 |
| Manipur | 81.3 | 78.9 | 80.1 | 83.6 | 83.6 | 83.6 | 82.0 | 80.3 | 81.1 |
| Meghalaya | 72.2 | 73.9 | 73.0 | 82.5 | 82.6 | 82.6 | 73.9 | 75.4 | 74.6 |
| Mizoram | 74.2 | 75.6 | 74.9 | 72.4 | 78.6 | 75.4 | 73.4 | 76.9 | 75.1 |
| Nagaland | 78.4 | 79.9 | 79.1 | 72.4 | 80.3 | 76.1 | 76.2 | 80.1 | 78.0 |
| Odisha | 86.8 | 88.2 | 87.5 | 87.9 | 89.2 | 88.5 | 87.0 | 88.4 | 87.7 |
| Punjab | 89.7 | 90.1 | 89.9 | 88.3 | 89.1 | 88.7 | 89.2 | 89.7 | 89.4 |
| Rajasthan | 83.5 | 86.1 | 84.8 | 88.5 | 87.2 | 87.9 | 84.8 | 86.4 | 85.6 |
| Sikkim | 86.5 | 87.4 | 87.0 | 88.7 | 89.0 | 88.8 | 87.1 | 87.8 | 87.4 |
| Tamil Nadu | 88.6 | 89.9 | 89.3 | 87.4 | 88.6 | 88.0 | 88.0 | 89.3 | 88.6 |
| Telangana | 85.7 | 86.8 | 86.3 | 86.2 | 86.8 | 86.5 | 85.9 | 86.8 | 86.4 |
| Tripura | 86.9 | 88.8 | 87.9 | 93.1 | 92.6 | 92.8 | 88.2 | 89.6 | 88.9 |
| Uttar Pradesh | 79.4 | 80.8 | 80.1 | 81.8 | 83.2 | 82.5 | 79.9 | 81.3 | 80.6 |
| Uttarakhand | 84.1 | 86.3 | 85.2 | 88.2 | 88.3 | 88.2 | 85.1 | 86.8 | 86.0 |
| West Bengal | 87.2 | 88.4 | 87.8 | 91.1 | 91.2 | 91.2 | 88.4 | 89.2 | 88.8 |
| A \& N Islands | 94.7 | 93.3 | 94.0 | 95.4 | 95.7 | 95.6 | 94.9 | 94.2 | 94.6 |
| Chandigarh | – | – | – | 92.0 | 85.0 | 88.5 | 92.0 | 85.0 | 88.5 |
| Dadra \& Nagar Haveli and Daman \& Diu | 92.3 | 91.5 | 91.9 | 92.5 | 94.1 | 93.2 | 92.4 | 93.0 | 92.7 |
| Jammu \& Kashmir | 84.1 | 84.3 | 84.2 | 88.6 | 86.4 | 87.5 | 85.2 | 84.9 | 85.0 |
| Ladakh | 75.9 | 76.5 | 76.1 | 80.0 | 79.7 | 79.9 | 76.3 | 76.8 | 76.6 |
| Lakshadweep | 74.8 | 74.8 | 74.8 | 82.5 | 87.1 | 84.9 | 80.7 | 84.3 | 82.6 |
| Puducherry | 86.2 | 84.4 | 85.3 | 88.4 | 89.9 | 89.2 | 87.6 | 88.1 | 87.9 |
| all India | 83.8 | 85.0 | 84.4 | 86.9 | 87.4 | 87.1 | 84.8 | 85.7 | 85.2 |
Statement 2.1: Percentage distribution of persons of age 6 years and above by relationship of the informant with the household member rural male
| State/UT | percentage distribution of persons of age 6 years and above by relationship of the informant with the household member | percentage of response which were cooperative | percentage distribution of persons of age 6 years and above by type of the day on which information on time use was collected. | ||||||
|---|---|---|---|---|---|---|---|---|---|
| self | other household members |
not a member of the household but closely associated with the household | NR* | all (including not reported cases) | normal day | other day | all (including not reported cases) |
||
| (1) | (2) | (3) | (4) | (5) | (6) | (7) | (8) | (9) | (10) |
| Andhra Pradesh | 84.9 | 15.0 | 0.1 | 0.0 | 100.0 | 99.3 | 87.8 | 12.2 | 100.0 |
| Arunachal Pradesh | 26.9 | 73.0 | 0.2 | 0.0 | 100.0 | 99.4 | 88.8 | 11.2 | 100.0 |
| Assam | 45.3 | 54.2 | 0.2 | 0.4 | 100.0 | 99.6 | 89.0 | 11.0 | 100.0 |
| Bihar | 43.1 | 55.4 | 1.1 | 0.3 | 100.0 | 99.5 | 88.2 | 11.8 | 100.0 |
| Chhattisgarh | 52.6 | 43.6 | 1.3 | 2.5 | 100.0 | 98.7 | 85.3 | 14.7 | 100.0 |
| Delhi | 42.1 | 54.9 | 3.1 | 0.0 | 100.0 | 100.0 | 94.0 | 6.0 | 100.0 |
| Goa | 98.0 | 2.0 | 0.0 | 0.0 | 100.0 | 99.4 | 89.5 | 10.5 | 100.0 |
| Gujarat | 42.9 | 55.0 | 0.9 | 1.2 | 100.0 | 99.5 | 91.4 | 8.6 | 100.0 |
| Haryana | 36.5 | 61.1 | 0.6 | 1.8 | 100.0 | 99.5 | 87.0 | 13.0 | 100.0 |
| Himachal Pradesh | 55.5 | 38.4 | 1.0 | 5.1 | 100.0 | 99.2 | 84.1 | 15.9 | 100.0 |
| Jharkhand | 45.3 | 51.6 | 1.4 | 1.7 | 100.0 | 99.6 | 86.9 | 13.1 | 100.0 |
| Karnataka | 48.8 | 50.6 | 0.1 | 0.5 | 100.0 | 98.9 | 89.4 | 10.6 | 100.0 |
| Kerala | 60.9 | 37.6 | 0.5 | 1.0 | 100.0 | 99.3 | 75.4 | 24.6 | 100.0 |
| Madhya Pradesh | 72.7 | 26.7 | 0.2 | 0.4 | 100.0 | 99.7 | 84.3 | 15.7 | 100.0 |
| Maharashtra | 71.5 | 26.3 | 0.6 | 1.6 | 100.0 | 98.3 | 87.5 | 12.5 | 100.0 |
| Manipur | 42.5 | 57.3 | 0.2 | 0.0 | 100.0 | 99.8 | 88.0 | 12.0 | 100.0 |
| Meghalaya | 9.3 | 89.9 | 0.8 | 0.0 | 100.0 | 99.9 | 76.2 | 23.8 | 100.0 |
| Mizoram | 34.5 | 65.1 | 0.4 | 0.0 | 100.0 | 97.1 | 84.3 | 15.7 | 100.0 |
| Nagaland | 67.8 | 31.8 | 0.3 | 0.1 | 100.0 | 100.0 | 71.8 | 28.2 | 100.0 |
| Odisha | 81.0 | 18.7 | 0.3 | 0.1 | 100.0 | 99.4 | 83.4 | 16.6 | 100.0 |
| Punjab | 49.8 | 48.7 | 1.0 | 0.5 | 100.0 | 99.0 | 90.8 | 9.2 | 100.0 |
| Rajasthan | 47.9 | 47.4 | 1.1 | 3.6 | 100.0 | 99.4 | 85.2 | 14.8 | 100.0 |
| Sikkim | 59.9 | 39.6 | 0.5 | 0.0 | 100.0 | 98.9 | 88.2 | 11.8 | 100.0 |
| Tamil Nadu | 70.0 | 28.7 | 0.5 | 0.8 | 100.0 | 98.1 | 83.6 | 16.4 | 100.0 |
| Telangana | 52.6 | 46.8 | 0.6 | 0.0 | 100.0 | 99.7 | 88.7 | 11.3 | 100.0 |
| Tripura | 29.5 | 69.8 | 0.8 | 0.0 | 100.0 | 99.7 | 87.5 | 12.5 | 100.0 |
| Uttar Pradesh | 44.0 | 53.7 | 1.4 | 0.9 | 100.0 | 97.8 | 88.2 | 11.8 | 100.0 |
| Uttarakhand | 43.5 | 55.1 | 0.1 | 1.3 | 100.0 | 99.8 | 88.2 | 11.8 | 100.0 |
| West Bengal | 49.5 | 48.9 | 1.5 | 0.1 | 100.0 | 99.6 | 87.1 | 12.9 | 100.0 |
| A \& N Islands | 34.6 | 61.1 | 0.0 | 4.2 | 100.0 | 97.4 | 76.3 | 23.7 | 100.0 |
| Dadra \& Nagar Haveli and Daman \& Das | 35.3 | 62.8 | 0.0 | 1.9 | 100.0 | 99.5 | 88.8 | 11.2 | 100.0 |
| Jammu \& Kashmir | 53.1 | 46.6 | 0.2 | 0.2 | 100.0 | 97.7 | 89.9 | 10.1 | 100.0 |
| Ladakh | 24.4 | 74.6 | 0.5 | 0.5 | 100.0 | 98.8 | 94.1 | 5.9 | 100.0 |
| Lakshadweep | 41.9 | 55.5 | 0.0 | 2.6 | 100.0 | 99.2 | 78.8 | 21.2 | 100.0 |
| Puducherry | 28.2 | 71.4 | 0.0 | 0.4 | 100.0 | 100.0 | 77.5 | 22.5 | 100.0 |
| All India | 53.8 | 44.5 | 0.9 | 0.9 | 100.0 | 99.0 | 87.0 | 13.0 | 100.0 |
- NR: Information on time use could not be collected.
Statement 2.1: Percentage distribution of persons of age 6 years and above by relationship of the informant with the household member
rural female
| State/UT | percentage distribution of persons of age 6 years and above by relationship of the informant with the household member | percentage of response which were cooperative | percentage distribution of persons of age 6 years and above by type of the day on which information on time use was collected. | ||||||
|---|---|---|---|---|---|---|---|---|---|
| self | other household members |
not a member of the household but closely associated with the household | NR* | all (including not reported cases) | normal day | other day | all (including not reported cases) |
||
| (1) | (2) | (3) | (4) | (5) | (6) | (7) | (8) | (9) | (10) |
| Andhra Pradesh | 89.5 | 10.4 | 0.1 | 0.0 | 100.0 | 99.5 | 88.0 | 12.0 | 100.0 |
| Arunachal Pradesh | 67.7 | 32.1 | 0.2 | 0.0 | 100.0 | 99.6 | 90.9 | 9.1 | 100.0 |
| Assam | 71.9 | 27.8 | 0.2 | 0.1 | 100.0 | 99.6 | 92.0 | 8.0 | 100.0 |
| Bihar | 59.0 | 39.8 | 1.1 | 0.2 | 100.0 | 99.6 | 91.1 | 8.9 | 100.0 |
| Chhattisgarh | 53.0 | 43.3 | 1.4 | 2.3 | 100.0 | 98.9 | 86.6 | 13.4 | 100.0 |
| Delhi | 67.8 | 30.4 | 1.7 | 0.0 | 100.0 | 100.0 | 85.5 | 14.5 | 100.0 |
| Goa | 99.0 | 1.0 | 0.0 | 0.0 | 100.0 | 99.3 | 90.6 | 9.4 | 100.0 |
| Gujarat | 31.8 | 46.4 | 0.8 | 1.0 | 100.0 | 99.6 | 93.2 | 6.8 | 100.0 |
| Haryana | 55.7 | 42.9 | 0.7 | 0.7 | 100.0 | 99.6 | 90.0 | 10.0 | 100.0 |
| Himachal Pradesh | 68.7 | 25.5 | 0.8 | 5.0 | 100.0 | 99.0 | 89.2 | 10.8 | 100.0 |
| Jharkhand | 63.5 | 34.0 | 1.1 | 1.4 | 100.0 | 99.4 | 90.0 | 10.0 | 100.0 |
| Karnataka | 65.1 | 34.3 | 0.1 | 0.4 | 100.0 | 99.0 | 91.1 | 8.9 | 100.0 |
| Kerala | 74.8 | 24.2 | 0.5 | 0.5 | 100.0 | 99.5 | 79.3 | 20.7 | 100.0 |
| Madhya Pradesh | 70.7 | 28.8 | 0.2 | 0.3 | 100.0 | 99.6 | 87.9 | 12.1 | 100.0 |
| Maharashtra | 72.3 | 25.3 | 0.8 | 1.6 | 100.0 | 98.5 | 88.7 | 11.3 | 100.0 |
| Manipur | 72.9 | 27.0 | 0.1 | 0.0 | 100.0 | 99.9 | 89.0 | 11.0 | 100.0 |
| Meghalaya | 62.2 | 37.4 | 0.4 | 0.0 | 100.0 | 99.6 | 79.1 | 20.9 | 100.0 |
| Mizoram | 75.9 | 23.8 | 0.3 | 0.0 | 100.0 | 97.4 | 84.0 | 16.0 | 100.0 |
| Nagaland | 73.4 | 26.2 | 0.5 | 0.0 | 100.0 | 99.8 | 79.9 | 20.1 | 100.0 |
| Odisha | 83.2 | 16.4 | 0.3 | 0.1 | 100.0 | 99.6 | 88.1 | 11.9 | 100.0 |
| Punjab | 69.7 | 29.2 | 0.5 | 0.5 | 100.0 | 99.2 | 92.3 | 7.7 | 100.0 |
| Rajasthan | 52.0 | 44.2 | 1.4 | 2.4 | 100.0 | 99.7 | 88.9 | 11.1 | 100.0 |
| Sikkim | 70.3 | 29.3 | 0.4 | 0.0 | 100.0 | 98.3 | 88.1 | 11.9 | 100.0 |
| Tamil Nadu | 81.9 | 17.3 | 0.4 | 0.4 | 100.0 | 98.1 | 85.3 | 14.7 | 100.0 |
| Telangana | 66.8 | 32.2 | 0.8 | 0.2 | 100.0 | 99.6 | 87.2 | 12.8 | 100.0 |
| Tripura | 42.2 | 57.5 | 0.2 | 0.0 | 100.0 | 99.7 | 89.0 | 11.0 | 100.0 |
| Uttar Pradesh | 58.8 | 39.3 | 1.3 | 0.7 | 100.0 | 97.7 | 91.8 | 8.2 | 100.0 |
| Uttarakhand | 55.6 | 43.6 | 0.1 | 0.6 | 100.0 | 99.7 | 90.5 | 9.5 | 100.0 |
| West Bengal | 68.9 | 29.6 | 1.5 | 0.0 | 100.0 | 99.7 | 90.7 | 9.3 | 100.0 |
| A \& N Islands | 40.7 | 54.9 | 0.0 | 4.3 | 100.0 | 97.7 | 83.4 | 16.6 | 100.0 |
| Dadra \& Nagar Haveli and Daman \& Das | 44.8 | 55.2 | 0.0 | 0.0 | 100.0 | 100.0 | 93.8 | 6.2 | 100.0 |
| Jammu \& Kashmir | 68.6 | 30.9 | 0.3 | 0.2 | 100.0 | 98.5 | 92.5 | 7.5 | 100.0 |
| Ladakh | 68.6 | 31.2 | 0.0 | 0.2 | 100.0 | 99.8 | 95.0 | 5.0 | 100.0 |
| Lakshadweep | 53.3 | 45.5 | 0.0 | 1.2 | 100.0 | 100.0 | 90.4 | 9.6 | 100.0 |
| Puducherry | 52.3 | 47.7 | 0.0 | 0.0 | 100.0 | 100.0 | 85.4 | 14.6 | 100.0 |
| All India | 65.6 | 32.9 | 0.8 | 0.7 | 100.0 | 99.0 | 89.7 | 10.3 | 100.0 |
- NR: Information on time use could not be collected.
Statement 2.1: Percentage distribution of persons of age 6 years and above by relationship of the informant with the household member rural persons
| State/UT | percentage distribution of persons of age 6 years and above by relationship of the informant with the household member | percentage of response which were cooperative | percentage distribution of persons of age 6 years and above by type of the day on which information on time use was collected. | ||||||
|---|---|---|---|---|---|---|---|---|---|
| self | other household members |
not a member of the household but closely associated with the household | NR* | all (including not reported cases) | normal day | other day | all (including not reported cases) |
||
| (1) | 121 | (3) | (4) | (5) | (6) | (7) | (8) | (9) | (10) |
| Andhra Pradesh | 87.2 | 12.7 | 0.1 | 0.0 | 100.0 | 99.4 | 87.9 | 12.1 | 100.0 |
| Arunachal Pradesh | 46.6 | 53.2 | 0.2 | 0.0 | 100.0 | 99.5 | 89.8 | 16.2 | 100.0 |
| Assam | 58.5 | 41.1 | 0.2 | 0.2 | 100.0 | 99.6 | 90.5 | 9.5 | 100.0 |
| Bihar | 51.0 | 47.6 | 1.1 | 0.3 | 100.0 | 99.5 | 89.6 | 10.4 | 100.0 |
| Chhattisgarh | 52.8 | 43.5 | 1.3 | 2.4 | 100.0 | 98.8 | 85.9 | 14.1 | 100.0 |
| Delhi | 52.3 | 44.8 | 2.9 | 0.0 | 100.0 | 100.0 | 90.6 | 9.4 | 100.0 |
| Goa | 98.5 | 1.5 | 0.0 | 0.0 | 100.0 | 99.4 | 90.1 | 9.9 | 100.0 |
| Gujarat | 47.3 | 50.8 | 0.8 | 1.1 | 100.0 | 99.6 | 92.3 | 7.7 | 100.0 |
| Haryana | 45.8 | 52.3 | 0.6 | 1.3 | 100.0 | 99.5 | 88.5 | 11.5 | 100.0 |
| Himachal Pradesh | 62.4 | 31.7 | 0.9 | 5.0 | 100.0 | 99.1 | 86.8 | 13.2 | 100.0 |
| Jharkhand | 54.4 | 42.8 | 1.3 | 1.6 | 100.0 | 99.5 | 88.5 | 11.5 | 100.0 |
| Karnataka | 57.0 | 42.4 | 0.1 | 0.5 | 100.0 | 99.0 | 90.2 | 9.8 | 100.0 |
| Kerala | 68.3 | 30.5 | 0.5 | 0.7 | 100.0 | 99.4 | 77.4 | 22.6 | 100.0 |
| Madhya Pradesh | 71.7 | 27.7 | 0.2 | 0.4 | 100.0 | 99.6 | 86.0 | 14.0 | 100.0 |
| Maharashtra | 71.9 | 25.8 | 0.7 | 1.6 | 100.0 | 98.4 | 88.1 | 11.9 | 100.0 |
| Manipur | 57.3 | 42.6 | 0.2 | 0.0 | 100.0 | 99.8 | 88.5 | 11.5 | 100.0 |
| Meghalaya | 36.5 | 62.9 | 0.6 | 0.0 | 100.0 | 99.8 | 77.7 | 22.3 | 100.0 |
| Mizoram | 54.6 | 45.1 | 0.3 | 0.0 | 100.0 | 97.3 | 84.2 | 15.8 | 100.0 |
| Nagaland | 70.5 | 29.0 | 0.4 | 0.0 | 100.0 | 99.9 | 75.8 | 24.2 | 100.0 |
| Odisha | 82.1 | 17.5 | 0.3 | 0.1 | 100.0 | 99.5 | 85.8 | 14.2 | 100.0 |
| Punjab | 59.3 | 39.5 | 0.8 | 0.5 | 100.0 | 99.1 | 91.3 | 8.5 | 100.0 |
| Rajasthan | 50.0 | 45.8 | 1.2 | 3.0 | 100.0 | 99.6 | 87.2 | 12.8 | 100.0 |
| Sikkim | 65.0 | 34.6 | 0.4 | 0.0 | 100.0 | 98.6 | 88.2 | 11.8 | 100.0 |
| Tamil Nadu | 76.2 | 22.8 | 0.4 | 0.6 | 100.0 | 98.1 | 84.5 | 15.5 | 100.0 |
| Telangana | 59.8 | 39.3 | 0.7 | 0.1 | 100.0 | 99.7 | 88.0 | 12.0 | 100.0 |
| Tripura | 36.0 | 63.5 | 0.5 | 0.0 | 100.0 | 99.7 | 88.3 | 11.7 | 100.0 |
| Uttar Pradesh | 51.4 | 46.5 | 1.3 | 0.8 | 100.0 | 97.8 | 90.1 | 9.9 | 100.0 |
| Uttarakhand | 49.5 | 49.4 | 0.1 | 1.0 | 100.0 | 99.8 | 89.4 | 10.6 | 100.0 |
| West Bengal | 59.3 | 39.2 | 1.5 | 0.1 | 100.0 | 99.6 | 88.9 | 11.1 | 100.0 |
| A \& N Islands | 37.5 | 58.3 | 0.0 | 4.3 | 100.0 | 97.5 | 79.6 | 20.4 | 100.0 |
| Dadra \& Nagar Haveli and Daman \& Dia | 39.8 | 59.2 | 0.0 | 1.0 | 100.0 | 99.8 | 91.2 | 8.8 | 100.0 |
| Jammu \& Kashmir | 60.6 | 39.0 | 0.2 | 0.2 | 100.0 | 98.1 | 91.2 | 8.8 | 100.0 |
| Ladakh | 45.4 | 54.0 | 0.3 | 0.4 | 100.0 | 99.3 | 94.5 | 5.5 | 100.0 |
| Lakshadweep | 47.9 | 50.3 | 0.0 | 1.9 | 100.0 | 99.6 | 84.9 | 15.1 | 100.0 |
| Puducherry | 40.8 | 59.0 | 0.0 | 0.2 | 100.0 | 100.0 | 81.6 | 18.4 | 100.0 |
| All India | 59.7 | 38.6 | 0.8 | 0.8 | 100.0 | 99.0 | 88.4 | 11.6 | 100.0 |
- NR: Information on time use could not be collected.
Statement 2.1: Percentage distribution of persons of age 6 years and above by relationship of the informant with the household member
urban male
| State/UT | percentage distribution of persons of age 6 years and above by relationship of the informant with the household member | percentage of response which were cooperative | percentage distribution of persons of age 6 years and above by type of the day on which information on time use was collected | ||||||
|---|---|---|---|---|---|---|---|---|---|
| self | other household members |
not a member of the household but closely associated with the household | NR* | all (including not reported cases) | normal day | other day | all (including not reported cases) |
||
| (1) | (2) | (3) | (4) | (5) | (6) | (7) | (8) | (9) | (10) |
| Andhra Pradesh | 85.4 | 14.4 | 0.2 | 0.0 | 100.0 | 98.0 | 85.6 | 14.4 | 100.0 |
| Arunachal Pradesh | 27.7 | 72.1 | 0.1 | 0.0 | 100.0 | 100.0 | 86.8 | 13.2 | 100.0 |
| Assam | 47.8 | 51.3 | 0.8 | 0.1 | 100.0 | 98.2 | 88.7 | 11.3 | 100.0 |
| Bihar | 43.4 | 54.4 | 1.9 | 0.2 | 100.0 | 98.7 | 86.9 | 13.1 | 100.0 |
| Chhattisgarh | 50.7 | 46.4 | 0.4 | 2.5 | 100.0 | 96.4 | 86.5 | 13.5 | 100.0 |
| Delhi | 43.1 | 50.4 | 6.5 | 0.0 | 100.0 | 96.7 | 90.9 | 9.1 | 100.0 |
| Goa | 97.2 | 2.8 | 0.0 | 0.0 | 100.0 | 100.0 | 93.3 | 6.7 | 100.0 |
| Gujarat | 45.8 | 51.7 | 0.6 | 1.9 | 100.0 | 99.2 | 85.6 | 14.4 | 100.0 |
| Haryana | 41.1 | 57.6 | 0.9 | 0.4 | 100.0 | 99.1 | 87.8 | 12.2 | 100.0 |
| Himachal Pradesh | 39.9 | 36.1 | 0.0 | 3.9 | 100.0 | 98.5 | 85.6 | 14.4 | 100.0 |
| Jharkhand | 46.5 | 48.3 | 3.2 | 2.0 | 100.0 | 98.9 | 88.7 | 11.3 | 100.0 |
| Karnataka | 54.3 | 45.3 | 0.2 | 0.2 | 100.0 | 99.4 | 85.4 | 14.6 | 100.0 |
| Kerala | 62.0 | 36.4 | 0.8 | 0.8 | 100.0 | 98.8 | 74.7 | 25.3 | 100.0 |
| Madhya Pradesh | 66.5 | 32.1 | 1.0 | 0.4 | 100.0 | 98.8 | 87.6 | 12.4 | 100.0 |
| Maharashtra | 71.1 | 27.9 | 0.2 | 0.9 | 100.0 | 97.9 | 87.3 | 12.7 | 100.0 |
| Manipur | 46.1 | 53.0 | 0.9 | 0.0 | 100.0 | 99.5 | 88.3 | 11.7 | 100.0 |
| Meghalaya | 22.9 | 75.8 | 1.3 | 0.0 | 100.0 | 100.0 | 80.5 | 19.5 | 100.0 |
| Mizoram | 36.7 | 62.5 | 0.8 | 0.0 | 100.0 | 96.4 | 84.7 | 15.3 | 100.0 |
| Nagaland | 64.9 | 34.9 | 0.2 | 0.0 | 100.0 | 99.9 | 78.3 | 21.7 | 100.0 |
| Odisha | 76.3 | 23.3 | 0.3 | 0.0 | 100.0 | 96.9 | 86.6 | 13.4 | 100.0 |
| Punjab | 55.7 | 42.7 | 1.2 | 0.3 | 100.0 | 98.9 | 91.9 | 8.1 | 100.0 |
| Rajasthan | 46.9 | 50.0 | 0.7 | 2.4 | 100.0 | 98.6 | 86.8 | 13.2 | 100.0 |
| Sikkim | 55.7 | 43.8 | 0.4 | 0.0 | 100.0 | 99.2 | 85.7 | 14.3 | 100.0 |
| Tamil Nadu | 65.1 | 32.9 | 0.8 | 1.2 | 100.0 | 94.9 | 84.9 | 15.1 | 100.0 |
| Telangana | 45.2 | 53.2 | 1.3 | 0.3 | 100.0 | 98.5 | 88.5 | 11.5 | 100.0 |
| Tripura | 26.2 | 73.6 | 0.2 | 0.0 | 100.0 | 98.3 | 85.6 | 14.4 | 100.0 |
| Uttar Pradesh | 43.8 | 53.4 | 1.8 | 1.0 | 100.0 | 96.7 | 89.4 | 10.6 | 100.0 |
| Uttarakhand | 42.0 | 55.1 | 0.2 | 2.7 | 100.0 | 99.2 | 84.2 | 15.8 | 100.0 |
| West Bengal | 41.9 | 56.5 | 1.6 | 0.0 | 100.0 | 98.7 | 87.1 | 12.9 | 100.0 |
| A \& N Islands | 35.7 | 63.1 | 0.0 | 1.2 | 100.0 | 90.6 | 79.3 | 20.7 | 100.0 |
| Chandigarh | 38.0 | 61.6 | 0.4 | 0.0 | 100.0 | 99.3 | 84.7 | 15.3 | 100.0 |
| Dadra \& Nagar Haveli and Daman \& Dia | 37.0 | 62.7 | 0.3 | 0.0 | 100.0 | 100.0 | 88.2 | 11.8 | 100.0 |
| Jammu \& Kashmir | 47.3 | 52.1 | 0.5 | 0.1 | 100.0 | 99.6 | 91.7 | 8.3 | 100.0 |
| Ladakh | 53.4 | 43.6 | 0.4 | 2.6 | 100.0 | 98.8 | 93.6 | 6.4 | 100.0 |
| Lakshadweep | 74.8 | 22.1 | 0.0 | 3.1 | 100.0 | 99.4 | 83.7 | 16.3 | 100.0 |
| Puducherry | 41.3 | 58.4 | 0.0 | 0.3 | 100.0 | 100.0 | 79.7 | 20.3 | 100.0 |
| All India | 54.8 | 43.3 | 1.1 | 0.8 | 100.0 | 98.0 | 86.8 | 13.2 | 100.0 |
- NR: Information on time use could not be collected.
Statement 2.1: Percentage distribution of persons of age 6 years and above by relationship of the informant with the household member
urban female
| State/UT | percentage distribution of persons of age 6 years and above by relationship of the informant with the household member | percentage of response which were cooperative | percentage distribution of persons of age 6 years and above by type of the day on which information on time use was collected. | ||||||
|---|---|---|---|---|---|---|---|---|---|
| self | other household members |
not a member of the household but closely associated with the household | NR** | all (including not reported cases) | normal day | other day | all (including not reported cases) |
||
| (1) | 121 | 131 | (4) | (5) | (6) | 171 | (8) | (9) | (10) |
| Andhra Pradesh | 89.8 | 10.0 | 0.2 | 0.0 | 100.0 | 98.1 | 89.6 | 10.4 | 100.0 |
| Arunachal Pradesh | 81.2 | 18.7 | 0.1 | 0.0 | 100.0 | 99.8 | 88.9 | 11.1 | 100.0 |
| Assam | 71.3 | 28.0 | 0.5 | 0.2 | 100.0 | 99.2 | 93.9 | 6.1 | 100.0 |
| Bihar | 53.6 | 44.6 | 1.7 | 0.1 | 100.0 | 98.5 | 89.4 | 10.6 | 100.0 |
| Chhattisgarh | 50.3 | 46.5 | 0.6 | 2.6 | 100.0 | 96.7 | 89.3 | 10.7 | 100.0 |
| Delhi | 61.5 | 35.9 | 2.7 | 0.0 | 100.0 | 96.8 | 91.3 | 8.7 | 100.0 |
| Goa | 98.4 | 1.6 | 0.0 | 0.0 | 100.0 | 99.4 | 95.0 | 5.0 | 100.0 |
| Gujarat | 62.8 | 34.2 | 0.6 | 2.4 | 100.0 | 99.2 | 88.0 | 12.0 | 100.0 |
| Haryana | 61.2 | 38.1 | 0.3 | 0.4 | 100.0 | 99.5 | 92.2 | 7.8 | 100.0 |
| Himachal Pradesh | 72.8 | 22.6 | 0.0 | 4.6 | 100.0 | 98.0 | 85.6 | 14.4 | 100.0 |
| Jharkhand | 61.9 | 34.0 | 2.2 | 2.0 | 100.0 | 99.0 | 91.0 | 9.0 | 100.0 |
| Karnataka | 70.0 | 29.5 | 0.3 | 0.1 | 100.0 | 99.4 | 89.0 | 11.0 | 100.0 |
| Kerala | 71.4 | 27.0 | 0.9 | 0.7 | 100.0 | 98.9 | 79.5 | 20.5 | 100.0 |
| Madhya Pradesh | 74.3 | 24.7 | 0.7 | 0.3 | 100.0 | 98.9 | 89.6 | 10.4 | 100.0 |
| Maharashtra | 75.4 | 23.2 | 0.3 | 1.1 | 100.0 | 98.1 | 90.4 | 9.6 | 100.0 |
| Manipur | 73.5 | 25.6 | 0.8 | 0.0 | 100.0 | 99.6 | 90.6 | 9.4 | 100.0 |
| Meghalaya | 57.3 | 42.1 | 0.6 | 0.0 | 100.0 | 99.6 | 82.8 | 17.2 | 100.0 |
| Mizoram | 73.8 | 25.4 | 0.8 | 0.0 | 100.0 | 96.8 | 84.8 | 15.2 | 100.0 |
| Nagaland | 79.5 | 20.3 | 0.2 | 0.0 | 100.0 | 100.0 | 86.1 | 13.9 | 100.0 |
| Odisha | 84.8 | 14.6 | 0.5 | 0.0 | 100.0 | 98.4 | 88.4 | 11.6 | 100.0 |
| Punjab | 67.6 | 31.3 | 0.8 | 0.4 | 100.0 | 98.8 | 92.1 | 7.9 | 100.0 |
| Rajasthan | 53.3 | 43.5 | 0.7 | 2.6 | 100.0 | 98.6 | 89.0 | 11.0 | 100.0 |
| Sikkim | 70.2 | 29.5 | 0.3 | 0.0 | 100.0 | 98.9 | 87.1 | 12.9 | 100.0 |
| Tamil Nadu | 77.6 | 20.9 | 0.4 | 1.0 | 100.0 | 94.9 | 87.9 | 12.1 | 100.0 |
| Telangana | 60.7 | 38.0 | 0.9 | 0.4 | 100.0 | 98.5 | 89.2 | 10.8 | 100.0 |
| Tripura | 45.7 | 54.1 | 0.2 | 0.0 | 100.0 | 98.7 | 89.1 | 10.9 | 100.0 |
| Uttar Pradesh | 58.4 | 38.9 | 1.7 | 0.9 | 100.0 | 97.0 | 91.9 | 8.1 | 100.0 |
| Uttarakhand | 54.9 | 43.2 | 0.7 | 1.2 | 100.0 | 99.6 | 86.3 | 13.7 | 100.0 |
| West Bengal | 61.7 | 37.0 | 1.3 | 0.1 | 100.0 | 99.0 | 89.5 | 10.5 | 100.0 |
| A \& N Islands | 47.9 | 49.6 | 0.0 | 2.5 | 100.0 | 95.6 | 80.3 | 19.7 | 100.0 |
| Chandigarh | 36.5 | 43.2 | 0.2 | 0.0 | 100.0 | 99.3 | 83.9 | 16.1 | 100.0 |
| Dadra \& Nagar Haveli and Daman \& Dia | 50.4 | 49.6 | 0.0 | 0.0 | 100.0 | 100.0 | 88.9 | 11.1 | 100.0 |
| Jammu \& Kashmir | 64.2 | 35.6 | 0.0 | 0.1 | 100.0 | 99.2 | 94.6 | 5.4 | 100.0 |
| Ladakh | 69.9 | 30.1 | 0.0 | 0.0 | 100.0 | 98.5 | 95.4 | 4.6 | 100.0 |
| Lakshadweep | 82.5 | 16.8 | 0.0 | 0.6 | 100.0 | 99.1 | 89.1 | 10.9 | 100.0 |
| Puducherry | 62.2 | 37.8 | 0.0 | 0.0 | 100.0 | 99.6 | 85.1 | 14.9 | 100.0 |
| All India | 67.4 | 30.9 | 0.8 | 0.8 | 100.0 | 98.1 | 89.3 | 10.7 | 100.0 |
- NR: Information on time use could not be collected.
Statement 2.1: Percentage distribution of persons of age 6 years and above by relationship of the informant with the household member
urban persons
| State/UT | percentage distribution of persons of age 6 years and above by relationship of the informant with the household member | percentage of response which were cooperative | percentage distribution of persons of age 6 years and above by type of the day on which information on time use was collected. | ||||||
|---|---|---|---|---|---|---|---|---|---|
| self | other household members |
not a member of the household but closely associated with the household | NR* | all (including not reported cases) | normal day | other day | all (including not reported cases) |
||
| (1) | 121 | 131 | (4) | (5) | (6) | 171 | (8) | (9) | (10) |
| Andhra Pradesh | 87.4 | 12.2 | 0.2 | 0.0 | 100.0 | 98.1 | 87.6 | 12.4 | 100.0 |
| Arunachal Pradesh | 52.7 | 47.2 | 0.1 | 0.0 | 100.0 | 99.9 | 87.8 | 12.2 | 100.0 |
| Assam | 58.7 | 40.5 | 0.7 | 0.2 | 100.0 | 98.7 | 91.1 | 8.9 | 100.0 |
| Bihar | 48.3 | 49.8 | 1.8 | 0.2 | 100.0 | 98.6 | 88.1 | 11.9 | 100.0 |
| Chhattisgarh | 50.5 | 46.4 | 0.5 | 2.6 | 100.0 | 96.6 | 87.9 | 12.1 | 100.0 |
| Delhi | 51.2 | 44.0 | 4.8 | 0.0 | 100.0 | 96.8 | 91.1 | 8.9 | 100.0 |
| Goa | 97.8 | 2.2 | 0.0 | 0.0 | 100.0 | 99.7 | 94.1 | 5.9 | 100.0 |
| Gujarat | 53.8 | 43.4 | 0.6 | 2.1 | 100.0 | 99.2 | 86.8 | 13.2 | 100.0 |
| Haryana | 50.3 | 48.7 | 0.6 | 0.4 | 100.0 | 99.3 | 89.8 | 10.2 | 100.0 |
| Himachal Pradesh | 66.2 | 29.6 | 0.0 | 4.3 | 100.0 | 98.2 | 85.6 | 14.4 | 100.0 |
| Jharkhand | 54.0 | 41.3 | 2.7 | 2.0 | 100.0 | 98.9 | 89.8 | 10.2 | 100.0 |
| Karnataka | 61.7 | 37.8 | 0.2 | 0.2 | 100.0 | 99.4 | 87.1 | 12.9 | 100.0 |
| Kerala | 67.0 | 31.4 | 0.8 | 0.8 | 100.0 | 98.8 | 77.2 | 22.8 | 100.0 |
| Madhya Pradesh | 70.3 | 28.5 | 0.9 | 0.3 | 100.0 | 98.8 | 88.6 | 11.4 | 100.0 |
| Maharashtra | 73.1 | 25.6 | 0.3 | 1.0 | 100.0 | 98.0 | 88.8 | 11.2 | 100.0 |
| Manipur | 60.1 | 39.0 | 0.9 | 0.0 | 100.0 | 99.5 | 89.5 | 10.5 | 100.0 |
| Meghalaya | 41.0 | 58.0 | 1.0 | 0.0 | 100.0 | 99.8 | 81.7 | 18.3 | 100.0 |
| Mizoram | 55.4 | 43.8 | 0.8 | 0.0 | 100.0 | 96.6 | 84.8 | 15.2 | 100.0 |
| Nagaland | 72.0 | 27.8 | 0.2 | 0.0 | 100.0 | 99.9 | 82.1 | 17.9 | 100.0 |
| Odisha | 80.7 | 18.8 | 0.4 | 0.0 | 100.0 | 97.7 | 87.5 | 12.5 | 100.0 |
| Punjab | 61.3 | 37.3 | 1.0 | 0.3 | 100.0 | 98.9 | 92.0 | 8.0 | 100.0 |
| Rajasthan | 49.9 | 46.9 | 0.7 | 2.5 | 100.0 | 98.6 | 87.9 | 12.1 | 100.0 |
| Sikkim | 62.4 | 37.2 | 0.4 | 0.0 | 100.0 | 99.0 | 86.3 | 13.7 | 100.0 |
| Tamil Nadu | 71.4 | 26.9 | 0.6 | 1.1 | 100.0 | 94.9 | 86.4 | 13.6 | 100.0 |
| Telangana | 52.8 | 45.8 | 1.1 | 0.4 | 100.0 | 98.5 | 88.8 | 11.2 | 100.0 |
| Tripura | 36.3 | 63.5 | 0.2 | 0.0 | 100.0 | 98.5 | 87.4 | 12.6 | 100.0 |
| Uttar Pradesh | 51.0 | 46.3 | 1.8 | 1.0 | 100.0 | 96.9 | 90.6 | 9.4 | 100.0 |
| Uttarakhand | 48.3 | 49.3 | 0.4 | 2.0 | 100.0 | 99.4 | 85.1 | 14.9 | 100.0 |
| West Bengal | 51.8 | 46.7 | 1.4 | 0.0 | 100.0 | 98.8 | 88.3 | 11.7 | 100.0 |
| A \& N Islands | 41.6 | 56.6 | 0.0 | 1.8 | 100.0 | 93.0 | 79.8 | 20.2 | 100.0 |
| Chandigarh | 46.7 | 52.9 | 0.3 | 0.0 | 100.0 | 99.3 | 84.3 | 15.7 | 100.0 |
| Dadra \& Nagar Haveli and Daman \& Dia | 42.7 | 57.1 | 0.2 | 0.0 | 100.0 | 100.0 | 88.5 | 11.5 | 100.0 |
| Jammu \& Kashmir | 55.3 | 44.1 | 0.3 | 0.1 | 100.0 | 99.4 | 93.1 | 6.9 | 100.0 |
| Ladakh | 60.9 | 37.5 | 0.2 | 1.4 | 100.0 | 98.6 | 94.4 | 5.6 | 100.0 |
| Lakshadweep | 79.0 | 19.2 | 0.0 | 1.7 | 100.0 | 99.2 | 86.7 | 13.3 | 100.0 |
| Puducherry | 52.7 | 47.2 | 0.0 | 0.1 | 100.0 | 99.8 | 82.6 | 17.4 | 100.0 |
| All India | 60.9 | 37.3 | 1.0 | 0.8 | 100.0 | 98.1 | 88.0 | 12.0 | 100.0 |
- NR: Information on time use could not be collected.
Statement 2.1: Percentage distribution of persons of age 6 years and above by relationship of the informant with the household member rural+urban male
| State/UT | percentage distribution of persons of age 6 years and above by relationship of the informant with the household member | percentage of response which were cooperative | percentage distribution of persons of age 6 years and above by type of the day on which information on time use was collected. | ||||||
|---|---|---|---|---|---|---|---|---|---|
| self | other household members |
not a member of the household but closely associated with the household | NR* | all (including not reported cases) | normal day | other day | all (including not reported cases) |
||
| (1) | 121 | 131 | (4) | (5) | (6) | 171 | 181 | (9) | (10) |
| Andhra Pradesh | 85.0 | 14.8 | 0.1 | 0.0 | 100.0 | 98.9 | 87.1 | 12.9 | 100.0 |
| Arunachal Pradesh | 27.0 | 72.8 | 0.2 | 0.0 | 100.0 | 99.5 | 88.4 | 11.6 | 100.0 |
| Assam | 45.6 | 53.8 | 0.3 | 0.3 | 100.0 | 99.4 | 89.0 | 11.0 | 100.0 |
| Bihar | 43.2 | 55.3 | 1.2 | 0.3 | 100.0 | 99.4 | 88.0 | 12.0 | 100.0 |
| Chhattisgarh | 52.1 | 44.3 | 1.1 | 2.5 | 100.0 | 98.2 | 85.6 | 14.4 | 100.0 |
| Delhi | 43.1 | 50.6 | 6.3 | 0.0 | 100.0 | 96.9 | 91.1 | 8.9 | 100.0 |
| Goa | 97.5 | 2.5 | 0.0 | 0.0 | 100.0 | 99.8 | 91.9 | 8.1 | 100.0 |
| Gujarat | 44.2 | 53.5 | 0.8 | 1.5 | 100.0 | 99.4 | 88.8 | 11.2 | 100.0 |
| Haryana | 38.6 | 59.5 | 0.8 | 1.1 | 100.0 | 99.3 | 87.4 | 12.6 | 100.0 |
| Himachal Pradesh | 36.1 | 38.1 | 0.9 | 4.9 | 100.0 | 99.1 | 84.3 | 15.7 | 100.0 |
| Jharkhand | 45.5 | 51.0 | 1.8 | 1.7 | 100.0 | 99.4 | 87.3 | 12.7 | 100.0 |
| Karnataka | 51.1 | 48.4 | 0.1 | 0.4 | 100.0 | 99.1 | 87.7 | 12.3 | 100.0 |
| Kerala | 61.4 | 37.1 | 0.6 | 0.9 | 100.0 | 99.0 | 75.0 | 25.0 | 100.0 |
| Madhya Pradesh | 70.9 | 28.2 | 0.4 | 0.4 | 100.0 | 99.4 | 85.2 | 14.8 | 100.0 |
| Maharashtra | 71.3 | 27.0 | 0.4 | 1.3 | 100.0 | 98.1 | 87.4 | 12.6 | 100.0 |
| Minipur | 43.5 | 56.0 | 0.4 | 0.0 | 100.0 | 99.7 | 88.1 | 11.9 | 100.0 |
| Meghalaya | 11.8 | 87.3 | 0.9 | 0.0 | 100.0 | 100.0 | 77.0 | 23.0 | 100.0 |
| Mizoram | 35.5 | 64.0 | 0.6 | 0.0 | 100.0 | 96.8 | 84.5 | 15.5 | 100.0 |
| Nagaland | 66.8 | 32.9 | 0.3 | 0.0 | 100.0 | 100.0 | 74.0 | 26.0 | 100.0 |
| Odisha | 80.2 | 19.4 | 0.3 | 0.1 | 100.0 | 99.0 | 83.9 | 16.1 | 100.0 |
| Punjab | 52.2 | 46.3 | 1.1 | 0.4 | 100.0 | 99.0 | 91.3 | 8.7 | 100.0 |
| Rajasthan | 47.7 | 48.2 | 0.9 | 3.2 | 100.0 | 99.2 | 85.7 | 14.3 | 100.0 |
| Sikkim | 58.8 | 40.7 | 0.5 | 0.0 | 100.0 | 99.0 | 87.5 | 12.5 | 100.0 |
| Tamil Nadu | 67.6 | 30.7 | 0.6 | 1.0 | 100.0 | 96.5 | 84.2 | 15.8 | 100.0 |
| Telangana | 49.4 | 49.6 | 0.9 | 0.2 | 100.0 | 99.2 | 88.6 | 11.4 | 100.0 |
| Tripura | 28.8 | 70.6 | 0.6 | 0.0 | 100.0 | 99.4 | 87.1 | 12.9 | 100.0 |
| Uttar Pradesh | 43.9 | 53.7 | 1.5 | 0.9 | 100.0 | 97.6 | 88.5 | 11.5 | 100.0 |
| Uttarakhand | 43.1 | 55.1 | 0.1 | 1.7 | 100.0 | 99.7 | 87.1 | 12.9 | 100.0 |
| West Bengal | 47.2 | 51.2 | 1.5 | 0.1 | 100.0 | 99.3 | 87.1 | 12.9 | 100.0 |
| A \& N Islands | 35.0 | 61.8 | 0.0 | 3.1 | 100.0 | 94.9 | 77.4 | 22.6 | 100.0 |
| Chandigarh | 38.0 | 61.6 | 0.4 | 0.0 | 100.0 | 99.3 | 84.7 | 15.3 | 100.0 |
| Dadra \& Nagar Haveli and Daman \& Dia | 36.4 | 62.7 | 0.2 | 0.7 | 100.0 | 99.8 | 88.4 | 11.6 | 100.0 |
| Jammu \& Kashmir | 51.6 | 48.0 | 0.2 | 0.2 | 100.0 | 98.2 | 90.3 | 9.7 | 100.0 |
| Ladakh | 27.8 | 70.9 | 0.5 | 0.8 | 100.0 | 98.8 | 94.0 | 6.0 | 100.0 |
| Lakshadweep | 67.8 | 29.2 | 0.0 | 3.0 | 100.0 | 99.4 | 82.7 | 17.3 | 100.0 |
| Puducherry | 36.9 | 62.8 | 0.0 | 0.3 | 100.0 | 100.0 | 79.0 | 21.0 | 100.0 |
| All India | 54.1 | 44.1 | 0.9 | 0.9 | 100.0 | 98.7 | 87.0 | 13.0 | 100.0 |
- NR: Information on time use could not be collected.
Statement 2.1: Percentage distribution of persons of age 6 years and above by relationship of the informant with the household member rural+urban female
| State/UT | percentage distribution of persons of age 6 years and above by relationship of the informant with the household member | percentage of response which were cooperative | percentage distribution of persons of age 6 years and above by type of the day on which information on time use was collected. | ||||||
|---|---|---|---|---|---|---|---|---|---|
| self | other household members |
not a member of the household but closely associated with the household | NR** | all (including not reported cases) | normal day | other day | all (including not reported cases) |
||
| (1) | 121 | 131 | (41) | (71) | (16) | 171 | 181 | (9) | (10) |
| Andhra Pradesh | 89.6 | 10.3 | 0.2 | 0.0 | 100.0 | 99.0 | 88.5 | 11.5 | 100.0 |
| Arunachal Pradesh | 70.4 | 29.4 | 0.2 | 0.0 | 100.0 | 99.6 | 90.5 | 9.5 | 100.0 |
| Assam | 71.8 | 27.8 | 0.2 | 0.1 | 100.0 | 99.6 | 92.2 | 7.8 | 100.0 |
| Bihar | 58.4 | 40.3 | 1.1 | 0.2 | 100.0 | 99.5 | 90.9 | 9.1 | 100.0 |
| Chhattisgarh | 52.4 | 44.0 | 1.2 | 2.4 | 100.0 | 98.4 | 87.2 | 12.8 | 100.0 |
| Delhi | 61.8 | 35.6 | 2.6 | 0.0 | 100.0 | 97.0 | 91.1 | 8.9 | 100.0 |
| Goa | 98.6 | 1.4 | 0.0 | 0.0 | 100.0 | 99.4 | 93.2 | 6.8 | 100.0 |
| Gujarat | 36.6 | 41.1 | 0.7 | 1.6 | 100.0 | 99.5 | 91.0 | 9.0 | 100.0 |
| Haryana | 58.1 | 40.8 | 0.5 | 0.6 | 100.0 | 99.5 | 91.0 | 9.0 | 100.0 |
| Himachal Pradesh | 69.2 | 25.2 | 0.7 | 4.9 | 100.0 | 98.9 | 88.8 | 11.2 | 100.0 |
| Jharkhand | 63.2 | 34.0 | 1.3 | 1.5 | 100.0 | 99.3 | 90.2 | 9.8 | 100.0 |
| Karnataka | 67.0 | 32.5 | 0.2 | 0.3 | 100.0 | 99.2 | 90.3 | 9.7 | 100.0 |
| Kerala | 73.1 | 25.6 | 0.7 | 0.6 | 100.0 | 99.2 | 79.4 | 20.6 | 100.0 |
| Madhya Pradesh | 71.7 | 27.6 | 0.3 | 0.3 | 100.0 | 99.4 | 88.4 | 11.6 | 100.0 |
| Maharashtra | 73.6 | 24.4 | 0.6 | 1.4 | 100.0 | 98.3 | 89.4 | 10.6 | 100.0 |
| Manipur | 73.1 | 26.6 | 0.3 | 0.0 | 100.0 | 99.8 | 89.5 | 10.5 | 100.0 |
| Meghalaya | 61.3 | 38.3 | 0.4 | 0.0 | 100.0 | 99.6 | 79.8 | 20.2 | 100.0 |
| Mizoram | 75.0 | 24.5 | 0.5 | 0.0 | 100.0 | 97.2 | 84.4 | 15.6 | 100.0 |
| Nagaland | 75.4 | 24.2 | 0.4 | 0.0 | 100.0 | 99.9 | 82.0 | 18.0 | 100.0 |
| Odisha | 83.4 | 16.1 | 0.4 | 0.1 | 100.0 | 99.4 | 88.2 | 11.8 | 100.0 |
| Punjab | 68.9 | 30.0 | 0.6 | 0.4 | 100.0 | 99.0 | 92.2 | 7.8 | 100.0 |
| Rajasthan | 52.3 | 44.0 | 1.2 | 2.4 | 100.0 | 99.4 | 89.0 | 11.0 | 100.0 |
| Sikkim | 70.3 | 29.3 | 0.4 | 0.0 | 100.0 | 98.4 | 87.9 | 12.1 | 100.0 |
| Tamil Nadu | 79.9 | 19.0 | 0.4 | 0.7 | 100.0 | 96.6 | 86.5 | 13.5 | 100.0 |
| Telangana | 64.3 | 34.6 | 0.9 | 0.3 | 100.0 | 99.2 | 88.0 | 12.0 | 100.0 |
| Tripura | 43.0 | 56.8 | 0.2 | 0.0 | 100.0 | 99.5 | 89.1 | 10.9 | 100.0 |
| Uttar Pradesh | 58.7 | 39.2 | 1.4 | 0.7 | 100.0 | 97.6 | 91.8 | 8.2 | 100.0 |
| Uttarakhand | 55.4 | 43.5 | 0.3 | 0.7 | 100.0 | 99.7 | 89.4 | 10.6 | 100.0 |
| West Bengal | 66.7 | 31.8 | 1.4 | 0.0 | 100.0 | 99.5 | 90.3 | 9.7 | 100.0 |
| A \& N Islands | 43.4 | 53.0 | 0.0 | 3.6 | 100.0 | 96.9 | 82.2 | 17.8 | 100.0 |
| Chandigarh | 36.5 | 43.2 | 0.2 | 0.0 | 100.0 | 99.3 | 83.9 | 16.1 | 100.0 |
| Dadra \& Nagar Haveli and Daman \& Dia | 48.2 | 51.8 | 0.0 | 0.0 | 100.0 | 100.0 | 90.9 | 9.1 | 100.0 |
| Jammu \& Kashmir | 67.5 | 32.1 | 0.2 | 0.2 | 100.0 | 98.7 | 93.1 | 6.9 | 100.0 |
| Ladakh | 68.8 | 31.1 | 0.0 | 0.2 | 100.0 | 99.6 | 95.1 | 4.9 | 100.0 |
| Lakshadweep | 76.7 | 22.5 | 0.0 | 0.7 | 100.0 | 99.3 | 89.3 | 10.7 | 100.0 |
| Puducherry | 59.0 | 41.0 | 0.0 | 0.0 | 100.0 | 99.7 | 85.2 | 14.8 | 100.0 |
| All India | 66.2 | 32.3 | 0.8 | 0.7 | 100.0 | 98.8 | 89.6 | 10.4 | 100.0 |
- NR: Information on time use could not be collected.
Statement 2.1: Percentage distribution of persons of age 6 years and above by relationship of the informant with the household member rural+urban persons
| State/UT | percentage distribution of persons of age 6 years and above by relationship of the informant with the household member | percentage of response which were cooperative | percentage distribution of persons of age 6 years and above by type of the day on which information on time use was collected. | ||||||
|---|---|---|---|---|---|---|---|---|---|
| self | other household members |
not a member of the household but closely associated with the household | NR** | all (including not reported cases) | normal day | other day | all (including not reported cases) |
||
| (1) | 120 | (3) | (4) | (5) | (6) | (7) | (8) | (9) | (10) |
| Andhra Pradesh | 87.3 | 12.5 | 0.2 | 0.0 | 100.0 | 98.9 | 87.8 | 12.2 | 100.0 |
| Arunachal Pradesh | 47.9 | 52.0 | 0.2 | 0.0 | 100.0 | 99.6 | 89.4 | 10.6 | 100.0 |
| Assam | 58.5 | 41.0 | 0.2 | 0.2 | 100.0 | 99.5 | 90.6 | 9.4 | 100.0 |
| Bihar | 50.7 | 47.9 | 1.2 | 0.2 | 100.0 | 99.4 | 89.5 | 10.5 | 100.0 |
| Chhattisgarh | 52.3 | 44.1 | 1.2 | 2.4 | 100.0 | 98.3 | 86.4 | 13.6 | 100.0 |
| Delhi | 51.3 | 44.1 | 4.7 | 0.0 | 100.0 | 96.9 | 91.1 | 8.9 | 100.0 |
| Goa | 98.1 | 1.9 | 0.0 | 0.0 | 100.0 | 99.6 | 92.6 | 7.4 | 100.0 |
| Gujarat | 50.2 | 47.5 | 0.7 | 1.5 | 100.0 | 99.4 | 89.9 | 10.1 | 100.0 |
| Haryana | 47.8 | 50.6 | 0.6 | 0.9 | 100.0 | 99.4 | 89.1 | 10.9 | 100.0 |
| Himachal Pradesh | 62.9 | 31.4 | 0.8 | 4.9 | 100.0 | 99.0 | 86.6 | 13.4 | 100.0 |
| Jharkhand | 54.3 | 42.5 | 1.5 | 1.6 | 100.0 | 99.4 | 88.7 | 11.3 | 100.0 |
| Karnataka | 58.9 | 40.6 | 0.2 | 0.4 | 100.0 | 99.2 | 89.0 | 11.0 | 100.0 |
| Kerala | 67.7 | 30.9 | 0.7 | 0.7 | 100.0 | 99.1 | 77.4 | 22.6 | 100.0 |
| Madhya Pradesh | 71.3 | 27.9 | 0.4 | 0.4 | 100.0 | 99.4 | 86.8 | 13.2 | 100.0 |
| Maharashtra | 72.4 | 25.7 | 0.5 | 1.3 | 100.0 | 98.2 | 88.4 | 11.6 | 100.0 |
| Minipur | 58.1 | 41.5 | 0.4 | 0.0 | 100.0 | 99.7 | 88.8 | 11.2 | 100.0 |
| Meghalaya | 37.4 | 62.0 | 0.7 | 0.0 | 100.0 | 99.8 | 78.4 | 21.6 | 100.0 |
| Mizoram | 55.0 | 44.5 | 0.5 | 0.0 | 100.0 | 97.0 | 84.4 | 15.6 | 100.0 |
| Nagaland | 71.0 | 28.6 | 0.3 | 0.0 | 100.0 | 99.9 | 77.9 | 22.1 | 100.0 |
| Odisha | 81.9 | 17.7 | 0.3 | 0.1 | 100.0 | 99.2 | 86.1 | 13.9 | 100.0 |
| Punjab | 60.1 | 38.6 | 0.9 | 0.4 | 100.0 | 99.0 | 91.7 | 8.3 | 100.0 |
| Rajasthan | 50.0 | 46.1 | 1.1 | 2.8 | 100.0 | 99.3 | 87.3 | 12.7 | 100.0 |
| Sikkim | 64.3 | 35.3 | 0.4 | 0.0 | 100.0 | 98.7 | 87.7 | 12.3 | 100.0 |
| Tamil Nadu | 73.9 | 24.7 | 0.5 | 0.8 | 100.0 | 96.6 | 85.4 | 14.6 | 100.0 |
| Telangana | 56.9 | 42.0 | 0.9 | 0.2 | 100.0 | 99.2 | 88.3 | 11.7 | 100.0 |
| Tripura | 36.0 | 63.5 | 0.4 | 0.0 | 100.0 | 99.5 | 88.1 | 11.9 | 100.0 |
| Uttar Pradesh | 51.3 | 46.4 | 1.4 | 0.8 | 100.0 | 97.6 | 90.2 | 9.8 | 100.0 |
| Uttarakhand | 49.2 | 49.3 | 0.2 | 1.2 | 100.0 | 99.7 | 88.2 | 11.8 | 100.0 |
| West Bengal | 57.0 | 41.5 | 1.5 | 0.1 | 100.0 | 99.4 | 88.7 | 11.3 | 100.0 |
| A \& N Islands | 39.0 | 57.7 | 0.0 | 3.4 | 100.0 | 95.8 | 79.6 | 20.4 | 100.0 |
| Chandigarh | 46.7 | 52.9 | 0.3 | 0.0 | 100.0 | 99.3 | 84.3 | 15.7 | 100.0 |
| Dadra \& Nagar Haveli and Daman \& Dia | 41.7 | 57.8 | 0.1 | 0.4 | 100.0 | 99.9 | 89.5 | 10.5 | 100.0 |
| Jammu \& Kashmir | 59.3 | 40.3 | 0.2 | 0.2 | 100.0 | 98.4 | 91.7 | 8.3 | 100.0 |
| Ladakh | 47.2 | 52.1 | 0.3 | 0.5 | 100.0 | 99.2 | 94.5 | 5.5 | 100.0 |
| Lakshadweep | 72.6 | 25.6 | 0.0 | 1.8 | 100.0 | 99.3 | 86.3 | 13.7 | 100.0 |
| Puducherry | 48.7 | 51.1 | 0.0 | 0.1 | 100.0 | 99.8 | 82.3 | 17.7 | 100.0 |
| All India | 60.1 | 38.2 | 0.9 | 0.8 | 100.0 | 98.7 | 88.3 | 11.7 | 100.0 |
- NR: Information on time use could not be collected.
Statement 3.1: Percentage of persons participating in a day in activities of major divisions of TUS activity classification as major activity (considering only the major activity of the time slots)
| major divisions of TUS activity classification | rural | urban | rural+urban | ||||||
|---|---|---|---|---|---|---|---|---|---|
| male | female | person | male | female | person | male | female | person | |
| (1) | (2) | (3) | (4) | (5) | (6) | (7) | (8) | (9) | (10) |
| Andhra Pradesh | |||||||||
| Employment and related activities | 65.7 | 35.6 | 50.5 | 57.9 | 20.5 | 39.2 | 63.1 | 30.6 | 46.8 |
| Production of goods for own final use | 9.8 | 15.4 | 12.7 | 3.9 | 14.7 | 9.3 | 7.9 | 15.2 | 11.5 |
| Unpaid domestic services for household members | 16.9 | 84.7 | 51.2 | 23.4 | 81.1 | 52.3 | 19.0 | 83.5 | 51.5 |
| Unpaid caregiving services for household members | 11.9 | 26.8 | 19.5 | 12.5 | 25.6 | 19.1 | 12.1 | 26.4 | 19.3 |
| Unpaid volunteer, trainee and other unpaid work | 1.1 | 1.0 | 1.1 | 0.7 | 1.1 | 0.9 | 1.0 | 1.0 | 1.0 |
| Learning | 17.4 | 13.6 | 15.5 | 22.1 | 18.4 | 20.2 | 18.9 | 15.2 | 17.0 |
| Socializing and communication, community participation and religious practice | 72.4 | 66.0 | 69.2 | 67.0 | 71.1 | 69.1 | 70.6 | 67.7 | 69.1 |
| Culture, leisure, mass-media and sports practices | 94.7 | 90.2 | 92.4 | 94.4 | 93.0 | 93.7 | 94.6 | 91.1 | 92.9 |
| Self-care and maintenance | 100.0 | 100.0 | 100.0 | 100.0 | 100.0 | 100.0 | 100.0 | 100.0 | 100.0 |
| Arunachal Pradesh | |||||||||
| Employment and related activities | 69.0 | 11.6 | 41.2 | 63.5 | 14.1 | 40.4 | 67.8 | 12.1 | 41.0 |
| Production of goods for own final use | 28.2 | 54.7 | 41.1 | 5.7 | 21.2 | 12.9 | 23.5 | 48.1 | 35.3 |
| Unpaid domestic services for household members | 51.7 | 88.9 | 69.7 | 51.8 | 90.4 | 69.8 | 51.7 | 89.2 | 69.7 |
| Unpaid caregiving services for household members | 29.0 | 55.9 | 42.0 | 18.7 | 55.0 | 35.6 | 26.8 | 55.7 | 40.7 |
| Unpaid volunteer, trainee and other unpaid work | 0.1 | 0.1 | 0.1 | – | – | – | 0.0 | 0.1 | 0.1 |
| Learning | 20.2 | 13.3 | 16.9 | 28.1 | 19.0 | 23.8 | 21.9 | 14.4 | 18.3 |
| Socializing and communication, community participation and religious practice | 38.3 | 43.2 | 40.7 | 40.2 | 43.1 | 41.5 | 38.7 | 43.2 | 40.8 |
| Culture, leisure, mass-media and sports practices | 98.3 | 91.1 | 94.8 | 98.1 | 95.7 | 97.0 | 98.3 | 92.0 | 95.2 |
| Self-care and maintenance | 100.0 | 100.0 | 100.0 | 100.0 | 100.0 | 100.0 | 100.0 | 100.0 | 100.0 |
| Assam | |||||||||
| Employment and related activities | 64.0 | 12.5 | 38.5 | 59.7 | 13.1 | 38.0 | 63.5 | 12.6 | 38.5 |
| Production of goods for own final use | 16.1 | 25.9 | 21.0 | 4.3 | 8.3 | 6.1 | 14.7 | 24.0 | 19.3 |
| Unpaid domestic services for household members | 31.9 | 80.4 | 55.9 | 37.6 | 79.9 | 57.3 | 32.6 | 80.3 | 56.0 |
| Unpaid caregiving services for household members | 22.1 | 37.6 | 29.8 | 16.8 | 31.6 | 23.7 | 21.5 | 37.0 | 29.1 |
| Unpaid volunteer, trainee and other unpaid work | 0.2 | 0.3 | 0.2 | 0.1 | 0.3 | 0.2 | 0.2 | 0.3 | 0.2 |
| Learning | 23.8 | 22.3 | 23.1 | 24.6 | 21.2 | 23.0 | 23.9 | 22.2 | 23.1 |
| Socializing and communication, community participation and religious practice | 73.2 | 79.6 | 76.4 | 67.7 | 77.6 | 72.3 | 72.6 | 79.4 | 75.9 |
| Culture, leisure, mass-media and sports practices | 96.5 | 92.5 | 94.5 | 98.6 | 97.9 | 98.2 | 96.7 | 93.1 | 94.9 |
| Self-care and maintenance | 100.0 | 100.0 | 100.0 | 100.0 | 100.0 | 100.0 | 100.0 | 100.0 | 100.0 |
| Bihar | |||||||||
| Employment and related activities | 54.7 | 10.8 | 32.8 | 54.5 | 8.6 | 32.7 | 54.7 | 10.6 | 32.8 |
| Production of goods for own final use | 14.1 | 14.8 | 14.4 | 2.6 | 3.9 | 3.2 | 12.8 | 13.6 | 13.2 |
| Unpaid domestic services for household members | 25.5 | 76.8 | 51.1 | 28.4 | 76.5 | 51.3 | 25.8 | 76.7 | 51.1 |
| Unpaid caregiving services for household members | 19.1 | 37.4 | 28.2 | 15.2 | 34.0 | 24.1 | 18.6 | 37.0 | 27.8 |
| Unpaid volunteer, trainee and other unpaid work | 0.3 | 0.5 | 0.4 | 0.2 | 0.3 | 0.2 | 0.3 | 0.4 | 0.4 |
| Learning | 33.4 | 28.6 | 31.0 | 34.1 | 28.2 | 31.3 | 33.5 | 28.5 | 31.0 |
| Socializing and communication, community participation and religious practice | 73.6 | 81.1 | 77.3 | 70.6 | 79.6 | 74.9 | 73.3 | 80.9 | 77.1 |
| Culture, leisure, mass-media and sports practices | 91.5 | 82.7 | 87.1 | 94.8 | 90.7 | 92.8 | 91.8 | 83.6 | 87.7 |
| Self-care and maintenance | 100.0 | 100.0 | 100.0 | 100.0 | 100.0 | 100.0 | 100.0 | 100.0 | 100.0 |
Statement 3.1: Percentage of persons participating in a day in activities of major divisions of TUS activity classification as major activity (considering only the major activity of the time slots)
| major divisions of TUS activity classification | rural | urban | rural+urban | ||||||
|---|---|---|---|---|---|---|---|---|---|
| male | female | person | male | female | person | male | female | person | |
| (1) | (2) | (3) | (4) | (5) | (6) | (7) | (8) | (9) | (10) |
| Chhattisgarh | |||||||||
| Employment and related activities | 56.1 | 30.6 | 43.3 | 60.1 | 23.0 | 41.5 | 57.0 | 28.9 | 42.9 |
| Production of goods for own final use | 20.3 | 28.1 | 24.2 | 3.0 | 12.0 | 7.5 | 16.4 | 24.5 | 20.5 |
| Unpaid domestic services for household members | 19.7 | 79.2 | 49.6 | 21.2 | 74.2 | 47.8 | 20.0 | 78.1 | 49.2 |
| Unpaid caregiving services for household members | 18.2 | 27.7 | 23.0 | 15.7 | 28.4 | 22.1 | 17.6 | 27.9 | 22.8 |
| Unpaid volunteer, trainee and other unpaid work | 0.5 | 1.0 | 0.8 | 0.7 | 0.6 | 0.7 | 0.6 | 0.9 | 0.7 |
| Learning | 19.9 | 20.9 | 20.4 | 23.7 | 26.0 | 24.8 | 20.8 | 22.0 | 21.4 |
| Socializing and communication, community participation and religious practice | 78.3 | 75.3 | 76.8 | 72.5 | 72.6 | 72.5 | 77.0 | 74.7 | 75.8 |
| Culture, leisure, mass-media and sports practices | 90.0 | 84.1 | 87.0 | 92.6 | 93.4 | 93.0 | 90.6 | 86.1 | 88.4 |
| Self-care and maintenance | 100.0 | 100.0 | 100.0 | 100.0 | 100.0 | 100.0 | 100.0 | 100.0 | 100.0 |
| Delhi | |||||||||
| Employment and related activities | 79.8 | 14.8 | 53.4 | 70.0 | 11.3 | 44.2 | 70.5 | 11.5 | 44.7 |
| Production of goods for own final use | – | – | – | 0.1 | 0.3 | 0.2 | 0.1 | 0.3 | 0.2 |
| Unpaid domestic services for household members | 38.5 | 85.7 | 57.7 | 28.9 | 79.3 | 51.1 | 29.5 | 79.6 | 51.4 |
| Unpaid caregiving services for household members | 21.4 | 44.6 | 30.7 | 16.6 | 34.3 | 24.4 | 16.8 | 34.8 | 24.7 |
| Unpaid volunteer, trainee and other unpaid work | – | – | – | 0.3 | 0.1 | 0.2 | 0.3 | 0.1 | 0.2 |
| Learning | 9.9 | 23.3 | 15.3 | 18.5 | 21.1 | 19.7 | 18.1 | 21.2 | 19.5 |
| Socializing and communication, community participation and religious practice | 61.8 | 69.9 | 65.2 | 59.0 | 71.4 | 64.5 | 59.2 | 71.3 | 64.5 |
| Culture, leisure, mass-media and sports practices | 83.6 | 88.6 | 85.7 | 85.7 | 88.8 | 87.1 | 85.6 | 88.8 | 87.0 |
| Self-care and maintenance | 100.0 | 100.0 | 100.0 | 100.0 | 100.0 | 100.0 | 100.0 | 100.0 | 100.0 |
| Goa | |||||||||
| Employment and related activities | 59.3 | 20.5 | 39.4 | 67.2 | 28.3 | 48.2 | 64.2 | 25.2 | 44.7 |
| Production of goods for own final use | 7.0 | 9.6 | 8.3 | 3.9 | 3.0 | 3.5 | 5.0 | 5.7 | 5.4 |
| Unpaid domestic services for household members | 26.0 | 74.2 | 50.8 | 28.1 | 65.7 | 46.5 | 27.3 | 69.1 | 48.2 |
| Unpaid caregiving services for household members | 9.3 | 19.6 | 14.6 | 12.7 | 20.4 | 16.5 | 11.4 | 20.1 | 15.8 |
| Unpaid volunteer, trainee and other unpaid work | – | – | – | 0.5 | – | 0.2 | 0.3 | – | 0.1 |
| Learning | 13.6 | 17.2 | 15.4 | 18.5 | 18.4 | 18.4 | 16.6 | 17.9 | 17.3 |
| Socializing and communication, community participation and religious practice | 69.9 | 68.9 | 69.4 | 61.6 | 66.2 | 63.8 | 64.7 | 67.3 | 66.0 |
| Culture, leisure, mass-media and sports practices | 92.1 | 96.1 | 94.1 | 90.8 | 97.9 | 94.3 | 91.3 | 97.2 | 94.2 |
| Self-care and maintenance | 100.0 | 100.0 | 100.0 | 100.0 | 100.0 | 100.0 | 100.0 | 100.0 | 100.0 |
| Gujarat | |||||||||
| Employment and related activities | 69.1 | 32.3 | 51.0 | 64.9 | 19.5 | 43.5 | 67.2 | 26.8 | 47.7 |
| Production of goods for own final use | 6.9 | 21.2 | 13.9 | 1.0 | 7.8 | 4.2 | 4.2 | 15.4 | 9.6 |
| Unpaid domestic services for household members | 9.5 | 82.9 | 45.6 | 17.4 | 82.8 | 48.2 | 13.1 | 82.8 | 46.7 |
| Unpaid caregiving services for household members | 15.4 | 30.0 | 22.6 | 15.0 | 28.4 | 21.3 | 15.3 | 29.3 | 22.0 |
| Unpaid volunteer, trainee and other unpaid work | 0.6 | 0.4 | 0.5 | 0.4 | 1.1 | 0.7 | 0.5 | 0.7 | 0.6 |
| Learning | 17.8 | 14.9 | 16.4 | 16.4 | 15.5 | 16.0 | 17.2 | 15.1 | 16.2 |
| Socializing and communication, community participation and religious practice | 77.5 | 80.1 | 78.8 | 73.5 | 79.5 | 76.3 | 75.7 | 79.8 | 77.7 |
| Culture, leisure, mass-media and sports practices | 93.9 | 86.6 | 90.3 | 92.9 | 90.7 | 91.9 | 93.5 | 88.4 | 91.0 |
| Self-care and maintenance | 100.0 | 100.0 | 100.0 | 100.0 | 100.0 | 100.0 | 100.0 | 100.0 | 100.0 |
Statement 3.1: Percentage of persons participating in a day in activities of major divisions of TUS activity classification as major activity (considering only the major activity of the time slots)
| major divisions of TUS activity classification | rural | urban | rural+urban | ||||||
|---|---|---|---|---|---|---|---|---|---|
| male | female | person | male | female | person | male | female | person | |
| (1) | (2) | (3) | (4) | (5) | (6) | (7) | (8) | (9) | (10) |
| Haryana | |||||||||
| Employment and related activities | 57.4 | 14.2 | 36.4 | 64.1 | 13.7 | 41.0 | 60.6 | 14.0 | 38.5 |
| Production of goods for own final use | 18.8 | 24.6 | 21.6 | 1.6 | 3.2 | 2.3 | 10.7 | 15.1 | 12.8 |
| Unpaid domestic services for household members | 12.7 | 78.2 | 44.6 | 26.3 | 77.4 | 49.6 | 19.1 | 77.9 | 46.9 |
| Unpaid caregiving services for household members | 14.0 | 31.5 | 22.5 | 18.6 | 37.1 | 27.1 | 16.2 | 34.0 | 24.6 |
| Unpaid volunteer, trainee and other unpaid work | 0.4 | 0.4 | 0.4 | 1.6 | 0.1 | 0.9 | 1.0 | 0.2 | 0.6 |
| Learning | 26.6 | 22.6 | 24.7 | 21.8 | 22.1 | 22.0 | 24.3 | 22.4 | 23.4 |
| Socializing and communication, community participation and religious practice | 68.0 | 71.8 | 69.9 | 65.0 | 74.7 | 69.4 | 66.6 | 73.1 | 69.7 |
| Culture, leisure, mass-media and sports practices | 94.0 | 91.5 | 92.8 | 95.8 | 95.9 | 95.9 | 94.8 | 93.4 | 94.2 |
| Self-care and maintenance | 100.0 | 100.0 | 100.0 | 100.0 | 100.0 | 100.0 | 100.0 | 100.0 | 100.0 |
| Himachal Pradesh | |||||||||
| Employment and related activities | 53.8 | 16.3 | 34.3 | 65.8 | 22.9 | 45.0 | 55.3 | 17.1 | 35.6 |
| Production of goods for own final use | 30.7 | 49.7 | 40.6 | 2.9 | 5.1 | 4.0 | 27.1 | 44.6 | 36.1 |
| Unpaid domestic services for household members | 22.3 | 83.5 | 54.2 | 34.5 | 77.4 | 55.3 | 23.9 | 82.8 | 54.3 |
| Unpaid caregiving services for household members | 13.2 | 30.3 | 22.1 | 16.7 | 30.5 | 23.4 | 13.7 | 30.3 | 22.3 |
| Unpaid volunteer, trainee and other unpaid work | 1.1 | 1.2 | 1.1 | 0.7 | 0.9 | 0.8 | 1.0 | 1.2 | 1.1 |
| Learning | 21.6 | 18.7 | 20.1 | 20.9 | 22.7 | 21.7 | 21.5 | 19.2 | 20.3 |
| Socializing and communication, community participation and religious practice | 73.4 | 75.1 | 74.3 | 67.4 | 76.4 | 71.8 | 72.6 | 75.2 | 74.0 |
| Culture, leisure, mass-media and sports practices | 96.9 | 96.1 | 96.5 | 96.7 | 96.7 | 96.7 | 96.9 | 96.2 | 96.5 |
| Self-care and maintenance | 100.0 | 100.0 | 100.0 | 100.0 | 100.0 | 100.0 | 100.0 | 100.0 | 100.0 |
| Jharkhand | |||||||||
| Employment and related activities | 56.6 | 19.4 | 37.9 | 56.9 | 14.9 | 36.4 | 56.7 | 18.6 | 37.6 |
| Production of goods for own final use | 25.0 | 39.7 | 32.3 | 5.8 | 9.2 | 7.4 | 21.2 | 33.9 | 27.5 |
| Unpaid domestic services for household members | 25.3 | 81.0 | 53.3 | 30.9 | 80.3 | 55.0 | 26.4 | 80.9 | 53.6 |
| Unpaid caregiving services for household members | 20.8 | 37.2 | 29.0 | 13.5 | 29.2 | 21.2 | 19.4 | 35.7 | 27.5 |
| Unpaid volunteer, trainee and other unpaid work | 0.5 | 1.2 | 0.9 | 0.5 | 1.0 | 0.8 | 0.5 | 1.2 | 0.8 |
| Learning | 27.9 | 24.4 | 26.1 | 30.7 | 27.2 | 29.0 | 28.4 | 24.9 | 26.7 |
| Socializing and communication, community participation and religious practice | 75.0 | 78.5 | 76.7 | 69.6 | 79.3 | 74.4 | 73.9 | 78.6 | 76.3 |
| Culture, leisure, mass-media and sports practices | 91.4 | 82.7 | 87.0 | 92.9 | 92.0 | 92.5 | 91.7 | 84.4 | 88.1 |
| Self-care and maintenance | 100.0 | 100.0 | 100.0 | 100.0 | 100.0 | 100.0 | 100.0 | 100.0 | 100.0 |
| Karnataka | |||||||||
| Employment and related activities | 69.9 | 28.3 | 49.0 | 63.7 | 21.8 | 43.9 | 67.3 | 25.8 | 46.9 |
| Production of goods for own final use | 15.1 | 13.1 | 14.1 | 2.8 | 5.4 | 4.0 | 10.0 | 10.1 | 10.1 |
| Unpaid domestic services for household members | 24.2 | 83.6 | 54.0 | 26.5 | 79.6 | 51.6 | 25.2 | 82.0 | 53.1 |
| Unpaid caregiving services for household members | 17.1 | 34.1 | 25.6 | 15.9 | 32.5 | 23.7 | 16.6 | 33.5 | 24.9 |
| Unpaid volunteer, trainee and other unpaid work | 0.6 | 1.4 | 1.0 | 0.7 | 1.2 | 1.0 | 0.6 | 1.4 | 1.0 |
| Learning | 17.9 | 16.0 | 16.9 | 21.0 | 19.9 | 20.5 | 19.2 | 17.5 | 18.4 |
| Socializing and communication, community participation and religious practice | 76.6 | 77.7 | 77.2 | 67.7 | 72.9 | 70.1 | 72.9 | 75.9 | 74.3 |
| Culture, leisure, mass-media and sports practices | 95.4 | 91.7 | 93.5 | 93.0 | 92.7 | 92.8 | 94.4 | 92.1 | 93.3 |
| Self-care and maintenance | 100.0 | 100.0 | 100.0 | 100.0 | 100.0 | 100.0 | 100.0 | 100.0 | 100.0 |
Statement 3.1: Percentage of persons participating in a day in activities of major divisions of TUS activity classification as major activity (considering only the major activity of the time slots)
| major divisions of TUS activity classification | rural | urban | rural+urban | ||||||
|---|---|---|---|---|---|---|---|---|---|
| male | female | person | male | female | person | male | female | person | |
| (1) | (2) | (3) | (4) | (5) | (6) | (7) | (8) | (9) | (10) |
| Kerala | |||||||||
| Employment and related activities | 49.6 | 20.3 | 34.0 | 50.0 | 19.9 | 34.0 | 49.8 | 20.1 | 34.0 |
| Production of goods for own final use | 8.4 | 11.4 | 10.0 | 5.7 | 7.5 | 6.7 | 7.1 | 9.6 | 8.4 |
| Unpaid domestic services for household members | 38.3 | 83.4 | 62.3 | 40.0 | 80.6 | 61.6 | 39.1 | 82.1 | 62.0 |
| Unpaid caregiving services for household members | 16.0 | 29.7 | 23.3 | 14.7 | 28.0 | 21.8 | 15.4 | 28.9 | 22.6 |
| Unpaid volunteer, trainee and other unpaid work | 3.5 | 4.6 | 4.1 | 3.6 | 5.0 | 4.3 | 3.5 | 4.8 | 4.2 |
| Learning | 17.7 | 18.8 | 18.3 | 18.5 | 20.4 | 19.6 | 18.1 | 19.6 | 18.9 |
| Socializing and communication, community participation and religious practice | 84.3 | 88.4 | 86.5 | 81.2 | 85.6 | 83.5 | 82.8 | 87.0 | 85.1 |
| Culture, leisure, mass-media and sports practices | 97.2 | 93.7 | 95.4 | 95.9 | 92.6 | 94.1 | 96.6 | 93.2 | 94.8 |
| Self-care and maintenance | 100.0 | 100.0 | 100.0 | 100.0 | 100.0 | 100.0 | 100.0 | 100.0 | 100.0 |
| Madhya Pradesh | |||||||||
| Employment and related activities | 64.4 | 24.2 | 45.0 | 62.3 | 14.7 | 39.2 | 63.8 | 21.4 | 43.3 |
| Production of goods for own final use | 31.8 | 44.1 | 37.8 | 8.3 | 17.1 | 12.6 | 25.1 | 36.3 | 30.5 |
| Unpaid domestic services for household members | 24.1 | 84.4 | 53.2 | 22.5 | 81.4 | 51.1 | 23.7 | 83.5 | 52.6 |
| Unpaid caregiving services for household members | 19.4 | 35.2 | 27.0 | 18.1 | 32.1 | 24.9 | 19.0 | 34.3 | 26.4 |
| Unpaid volunteer, trainee and other unpaid work | 1.0 | 1.3 | 1.1 | 0.7 | 0.8 | 0.7 | 0.9 | 1.2 | 1.0 |
| Learning | 18.8 | 15.5 | 17.2 | 22.6 | 20.3 | 21.5 | 19.9 | 16.9 | 18.5 |
| Socializing and communication, community participation and religious practice | 80.0 | 75.0 | 77.6 | 75.5 | 78.3 | 76.8 | 78.7 | 76.0 | 77.4 |
| Culture, leisure, mass-media and sports practices | 92.9 | 84.1 | 88.7 | 95.0 | 93.7 | 94.3 | 93.5 | 86.9 | 90.3 |
| Self-care and maintenance | 100.0 | 100.0 | 100.0 | 100.0 | 100.0 | 100.0 | 100.0 | 100.0 | 100.0 |
| Maharashtra | |||||||||
| Employment and related activities | 66.3 | 35.7 | 51.3 | 63.0 | 19.1 | 42.0 | 64.9 | 28.7 | 47.3 |
| Production of goods for own final use | 8.6 | 17.9 | 13.1 | 1.9 | 13.7 | 7.6 | 5.7 | 16.1 | 10.7 |
| Unpaid domestic services for household members | 21.4 | 85.0 | 52.6 | 19.5 | 82.0 | 49.3 | 20.6 | 83.8 | 51.2 |
| Unpaid caregiving services for household members | 14.8 | 27.8 | 21.1 | 13.8 | 27.6 | 20.4 | 14.4 | 27.7 | 20.8 |
| Unpaid volunteer, trainee and other unpaid work | 0.8 | 0.8 | 0.8 | 0.5 | 0.7 | 0.6 | 0.7 | 0.8 | 0.7 |
| Learning | 19.6 | 16.5 | 18.1 | 18.2 | 17.8 | 18.0 | 19.0 | 17.1 | 18.1 |
| Socializing and communication, community participation and religious practice | 76.5 | 70.9 | 73.8 | 67.2 | 76.0 | 71.4 | 72.5 | 73.1 | 72.8 |
| Culture, leisure, mass-media and sports practices | 91.9 | 81.4 | 86.8 | 94.1 | 92.9 | 93.6 | 92.9 | 86.3 | 89.7 |
| Self-care and maintenance | 100.0 | 100.0 | 100.0 | 100.0 | 100.0 | 100.0 | 100.0 | 100.0 | 100.0 |
| Manipur | |||||||||
| Employment and related activities | 56.8 | 32.0 | 44.8 | 57.0 | 38.3 | 47.5 | 56.9 | 34.0 | 45.6 |
| Production of goods for own final use | 19.7 | 30.2 | 24.8 | 13.5 | 18.2 | 15.9 | 17.8 | 26.4 | 22.0 |
| Unpaid domestic services for household members | 24.6 | 77.7 | 50.4 | 34.3 | 77.0 | 56.0 | 27.5 | 77.4 | 52.1 |
| Unpaid caregiving services for household members | 29.5 | 38.1 | 33.7 | 29.4 | 37.2 | 33.3 | 29.4 | 37.8 | 33.6 |
| Unpaid volunteer, trainee and other unpaid work | 0.6 | 0.8 | 0.7 | 0.5 | 0.3 | 0.4 | 0.6 | 0.6 | 0.6 |
| Learning | 30.0 | 24.3 | 27.2 | 28.8 | 24.2 | 26.4 | 29.6 | 24.3 | 27.0 |
| Socializing and communication, community participation and religious practice | 51.0 | 53.2 | 52.0 | 51.8 | 62.1 | 57.1 | 51.2 | 56.0 | 53.6 |
| Culture, leisure, mass-media and sports practices | 97.8 | 90.1 | 94.0 | 96.8 | 90.1 | 93.4 | 97.5 | 90.1 | 93.8 |
| Self-care and maintenance | 100.0 | 100.0 | 100.0 | 100.0 | 100.0 | 100.0 | 100.0 | 100.0 | 100.0 |
Statement 3.1: Percentage of persons participating in a day in activities of major divisions of TUS activity classification as major activity (considering only the major activity of the time slots)
| major divisions of TUS activity classification | rural | urban | rural+urban | ||||||
|---|---|---|---|---|---|---|---|---|---|
| male | female | person | male | female | person | male | female | person | |
| (1) | (2) | (3) | (4) | (5) | (6) | (7) | (8) | (9) | (10) |
| Meghalaya | |||||||||
| Employment and related activities | 51.5 | 18.2 | 34.3 | 54.8 | 17.5 | 35.1 | 52.1 | 18.0 | 34.5 |
| Production of goods for own final use | 11.1 | 9.9 | 10.5 | 7.6 | 6.0 | 6.8 | 10.5 | 9.1 | 9.8 |
| Unpaid domestic services for household members | 38.5 | 81.5 | 60.6 | 41.7 | 79.7 | 61.7 | 39.1 | 81.1 | 60.8 |
| Unpaid caregiving services for household members | 16.9 | 42.9 | 30.2 | 12.8 | 28.1 | 20.8 | 16.1 | 40.0 | 28.5 |
| Unpaid volunteer, trainee and other unpaid work | 0.1 | 0.3 | 0.2 | 0.1 | – | 0.0 | 0.1 | 0.3 | 0.2 |
| Learning | 24.2 | 21.8 | 22.9 | 25.6 | 28.6 | 27.2 | 24.4 | 23.1 | 23.7 |
| Socializing and communication, community participation and religious practice | 70.2 | 68.8 | 69.5 | 66.1 | 65.4 | 65.7 | 69.5 | 68.2 | 68.8 |
| Culture, leisure, mass-media and sports practices | 87.4 | 83.7 | 85.5 | 93.6 | 91.2 | 92.3 | 88.6 | 85.1 | 86.8 |
| Self-care and maintenance | 100.0 | 100.0 | 100.0 | 100.0 | 100.0 | 100.0 | 100.0 | 100.0 | 100.0 |
| Mizoram | |||||||||
| Employment and related activities | 69.0 | 30.6 | 50.4 | 60.0 | 21.7 | 40.8 | 65.1 | 26.6 | 46.1 |
| Production of goods for own final use | 26.5 | 30.5 | 28.5 | 3.5 | 9.5 | 6.5 | 16.6 | 21.1 | 18.8 |
| Unpaid domestic services for household members | 32.8 | 89.2 | 60.2 | 35.1 | 87.4 | 61.3 | 33.8 | 88.4 | 60.7 |
| Unpaid caregiving services for household members | 25.2 | 48.0 | 36.2 | 29.1 | 48.7 | 39.0 | 26.9 | 48.3 | 37.4 |
| Unpaid volunteer, trainee and other unpaid work | 0.8 | 0.7 | 0.8 | 1.0 | 0.4 | 0.7 | 0.9 | 0.6 | 0.7 |
| Learning | 13.0 | 11.9 | 12.4 | 20.3 | 15.2 | 17.7 | 16.1 | 13.3 | 14.8 |
| Socializing and communication, community participation and religious practice | 61.1 | 54.9 | 58.1 | 56.6 | 56.7 | 56.6 | 59.2 | 55.7 | 57.5 |
| Culture, leisure, mass-media and sports practices | 92.6 | 81.9 | 87.4 | 92.4 | 85.0 | 88.7 | 92.5 | 83.3 | 87.9 |
| Self-care and maintenance | 100.0 | 100.0 | 100.0 | 100.0 | 100.0 | 100.0 | 100.0 | 100.0 | 100.0 |
| Nagaland | |||||||||
| Employment and related activities | 20.6 | 7.8 | 14.3 | 39.1 | 15.2 | 27.5 | 27.0 | 10.3 | 18.8 |
| Production of goods for own final use | 56.4 | 52.4 | 54.4 | 21.9 | 16.6 | 19.3 | 44.5 | 40.2 | 42.4 |
| Unpaid domestic services for household members | 49.1 | 84.9 | 66.7 | 47.7 | 83.2 | 64.9 | 48.6 | 84.3 | 66.1 |
| Unpaid caregiving services for household members | 29.0 | 39.0 | 33.9 | 29.4 | 41.5 | 35.3 | 29.2 | 39.8 | 34.4 |
| Unpaid volunteer, trainee and other unpaid work | 3.3 | 3.6 | 3.5 | 2.9 | 1.5 | 2.2 | 3.1 | 2.9 | 3.0 |
| Learning | 16.6 | 17.3 | 17.0 | 26.2 | 25.4 | 25.8 | 19.9 | 20.0 | 20.0 |
| Socializing and communication, community participation and religious practice | 75.5 | 72.8 | 74.2 | 71.1 | 69.1 | 70.1 | 74.0 | 71.6 | 72.8 |
| Culture, leisure, mass-media and sports practices | 96.7 | 93.3 | 95.0 | 96.2 | 94.9 | 95.6 | 96.6 | 93.8 | 95.2 |
| Self-care and maintenance | 100.0 | 100.0 | 100.0 | 100.0 | 100.0 | 100.0 | 100.0 | 100.0 | 100.0 |
| Odisha | |||||||||
| Employment and related activities | 56.2 | 15.1 | 35.3 | 59.2 | 13.6 | 35.6 | 56.7 | 14.9 | 35.3 |
| Production of goods for own final use | 18.3 | 36.7 | 27.7 | 3.8 | 11.1 | 7.6 | 15.9 | 32.4 | 24.3 |
| Unpaid domestic services for household members | 22.8 | 78.8 | 51.3 | 29.4 | 77.4 | 54.2 | 23.9 | 78.5 | 51.8 |
| Unpaid caregiving services for household members | 14.8 | 30.8 | 22.9 | 15.0 | 29.6 | 22.5 | 14.8 | 30.6 | 22.9 |
| Unpaid volunteer, trainee and other unpaid work | 1.5 | 1.9 | 1.7 | 1.6 | 1.7 | 1.6 | 1.5 | 1.8 | 1.7 |
| Learning | 21.5 | 19.1 | 20.2 | 22.3 | 25.1 | 23.8 | 21.6 | 20.1 | 20.8 |
| Socializing and communication, community participation and religious practice | 79.0 | 85.0 | 82.0 | 75.0 | 85.9 | 80.6 | 78.3 | 85.1 | 81.8 |
| Culture, leisure, mass-media and sports practices | 95.4 | 90.0 | 92.7 | 95.4 | 94.4 | 94.9 | 95.4 | 90.7 | 93.0 |
| Self-care and maintenance | 100.0 | 100.0 | 100.0 | 100.0 | 100.0 | 100.0 | 100.0 | 100.0 | 100.0 |
Statement 3.1: Percentage of persons participating in a day in activities of major divisions of TUS activity classification as major activity (considering only the major activity of the time slots)
| major divisions of TUS activity classification | rural | urban | rural+urban | ||||||
|---|---|---|---|---|---|---|---|---|---|
| male | female | person | male | female | person | male | female | person | |
| (1) | (2) | (3) | (4) | (5) | (6) | (7) | (8) | (9) | (10) |
| Punjab | |||||||||
| Employment and related activities | 64.2 | 19.9 | 43.2 | 64.6 | 19.1 | 43.2 | 64.4 | 19.6 | 43.2 |
| Production of goods for own final use | 10.4 | 12.9 | 11.5 | 1.8 | 2.0 | 1.9 | 6.9 | 8.6 | 7.7 |
| Unpaid domestic services for household members | 24.7 | 81.4 | 51.6 | 28.4 | 81.9 | 53.5 | 26.2 | 81.6 | 52.4 |
| Unpaid caregiving services for household members | 14.3 | 28.7 | 21.1 | 17.7 | 30.0 | 23.4 | 15.6 | 29.2 | 22.0 |
| Unpaid volunteer, trainee and other unpaid work | 1.0 | 0.8 | 0.9 | 0.7 | 0.8 | 0.8 | 0.9 | 0.8 | 0.9 |
| Learning | 20.2 | 19.0 | 19.6 | 19.9 | 21.4 | 20.6 | 20.1 | 20.0 | 20.0 |
| Socializing and communication, community participation and religious practice | 68.1 | 77.5 | 72.6 | 56.7 | 72.0 | 63.9 | 63.6 | 75.3 | 69.1 |
| Culture, leisure, mass-media and sports practices | 95.3 | 95.4 | 95.4 | 94.3 | 93.9 | 94.1 | 94.9 | 94.8 | 94.9 |
| Self-care and maintenance | 100.0 | 100.0 | 100.0 | 100.0 | 100.0 | 100.0 | 100.0 | 100.0 | 100.0 |
| Rajasthan | |||||||||
| Employment and related activities | 52.9 | 27.1 | 39.6 | 59.9 | 16.3 | 39.3 | 54.9 | 24.4 | 39.5 |
| Production of goods for own final use | 24.0 | 44.3 | 34.4 | 2.6 | 7.9 | 5.1 | 18.0 | 35.2 | 26.7 |
| Unpaid domestic services for household members | 20.5 | 80.9 | 51.6 | 23.0 | 78.3 | 49.1 | 21.2 | 80.2 | 50.9 |
| Unpaid caregiving services for household members | 16.3 | 31.0 | 23.9 | 14.4 | 30.9 | 22.2 | 15.7 | 31.0 | 23.4 |
| Unpaid volunteer, trainee and other unpaid work | 0.9 | 0.8 | 0.8 | 0.7 | 0.9 | 0.8 | 0.8 | 0.8 | 0.8 |
| Learning | 26.5 | 22.1 | 24.2 | 25.5 | 23.4 | 24.5 | 26.2 | 22.4 | 24.3 |
| Socializing and communication, community participation and religious practice | 83.7 | 83.0 | 83.3 | 81.9 | 86.9 | 84.3 | 83.2 | 83.9 | 83.6 |
| Culture, leisure, mass-media and sports practices | 89.9 | 78.7 | 84.1 | 94.4 | 90.2 | 92.4 | 91.2 | 81.5 | 86.3 |
| Self-care and maintenance | 100.0 | 100.0 | 100.0 | 100.0 | 100.0 | 100.0 | 100.0 | 100.0 | 100.0 |
| Sikkim | |||||||||
| Employment and related activities | 65.5 | 25.6 | 46.1 | 65.3 | 28.5 | 48.4 | 65.5 | 26.3 | 46.6 |
| Production of goods for own final use | 22.0 | 19.1 | 20.6 | 1.4 | 2.5 | 1.9 | 16.6 | 15.1 | 15.9 |
| Unpaid domestic services for household members | 55.2 | 87.8 | 71.1 | 60.2 | 92.4 | 75.0 | 56.5 | 88.9 | 72.1 |
| Unpaid caregiving services for household members | 25.0 | 36.8 | 30.7 | 19.3 | 33.7 | 25.9 | 23.5 | 36.0 | 29.5 |
| Unpaid volunteer, trainee and other unpaid work | 0.9 | 0.2 | 0.6 | – | 0.5 | 0.2 | 0.7 | 0.3 | 0.5 |
| Learning | 18.5 | 18.7 | 18.6 | 21.6 | 22.2 | 21.9 | 19.3 | 19.5 | 19.4 |
| Socializing and communication, community participation and religious practice | 83.2 | 83.6 | 83.4 | 72.4 | 75.3 | 73.8 | 80.3 | 81.6 | 80.9 |
| Culture, leisure, mass-media and sports practices | 96.6 | 93.6 | 95.1 | 95.6 | 96.4 | 96.0 | 96.3 | 94.2 | 95.3 |
| Self-care and maintenance | 100.0 | 100.0 | 100.0 | 100.0 | 100.0 | 100.0 | 100.0 | 100.0 | 100.0 |
| Tamil Nadu | |||||||||
| Employment and related activities | 62.6 | 37.8 | 49.6 | 63.6 | 25.4 | 44.3 | 63.1 | 32.0 | 47.1 |
| Production of goods for own final use | 9.1 | 22.7 | 16.2 | 4.3 | 9.4 | 6.9 | 6.8 | 16.5 | 11.8 |
| Unpaid domestic services for household members | 26.3 | 82.1 | 55.5 | 28.5 | 80.9 | 54.9 | 27.4 | 81.6 | 55.2 |
| Unpaid caregiving services for household members | 14.1 | 22.9 | 18.7 | 16.7 | 28.1 | 22.5 | 15.4 | 25.4 | 20.5 |
| Unpaid volunteer, trainee and other unpaid work | 2.3 | 3.5 | 2.9 | 1.8 | 2.8 | 2.3 | 2.0 | 3.2 | 2.6 |
| Learning | 18.0 | 15.9 | 16.9 | 16.2 | 15.6 | 15.9 | 17.1 | 15.8 | 16.4 |
| Socializing and communication, community participation and religious practice | 69.3 | 71.8 | 70.6 | 60.2 | 64.1 | 62.2 | 64.8 | 68.2 | 66.6 |
| Culture, leisure, mass-media and sports practices | 94.1 | 93.1 | 93.6 | 92.4 | 93.0 | 92.7 | 93.3 | 93.0 | 93.2 |
| Self-care and maintenance | 100.0 | 100.0 | 100.0 | 100.0 | 100.0 | 100.0 | 100.0 | 100.0 | 100.0 |
Statement 3.1: Percentage of persons participating in a day in activities of major divisions of TUS activity classification as major activity (considering only the major activity of the time slots)
| major divisions of TUS activity classification | rural | urban | rural+urban | ||||||
|---|---|---|---|---|---|---|---|---|---|
| male | female | person | male | female | person | male | female | person | |
| (1) | (2) | (3) | (4) | (5) | (6) | (7) | (8) | (9) | (10) |
| Telangana | |||||||||
| Employment and related activities | 66.9 | 42.7 | 54.5 | 59.3 | 24.0 | 42.0 | 63.6 | 35.0 | 49.3 |
| Production of goods for own final use | 10.3 | 8.6 | 9.4 | 3.7 | 2.9 | 3.3 | 7.4 | 6.3 | 6.9 |
| Unpaid domestic services for household members | 35.1 | 85.1 | 60.6 | 36.1 | 79.7 | 57.5 | 35.5 | 82.9 | 59.3 |
| Unpaid caregiving services for household members | 20.5 | 30.3 | 25.5 | 22.0 | 31.7 | 26.8 | 21.2 | 30.9 | 26.0 |
| Unpaid volunteer, trainee and other unpaid work | 0.9 | 1.1 | 1.0 | 0.9 | 1.0 | 1.0 | 0.9 | 1.1 | 1.0 |
| Learning | 21.1 | 19.3 | 20.2 | 27.1 | 22.0 | 24.6 | 23.7 | 20.4 | 22.0 |
| Socializing and communication, community participation and religious practice | 78.4 | 75.8 | 77.0 | 72.4 | 75.7 | 74.0 | 75.8 | 75.7 | 75.8 |
| Culture, leisure, mass-media and sports practices | 93.3 | 86.1 | 89.6 | 94.3 | 93.3 | 93.8 | 93.7 | 89.1 | 91.4 |
| Self-care and maintenance | 100.0 | 100.0 | 100.0 | 100.0 | 100.0 | 100.0 | 100.0 | 100.0 | 100.0 |
| Tripura | |||||||||
| Employment and related activities | 64.4 | 16.6 | 40.0 | 56.6 | 14.9 | 35.1 | 62.7 | 16.2 | 38.9 |
| Production of goods for own final use | 17.7 | 36.9 | 27.5 | 6.6 | 10.4 | 8.6 | 15.3 | 31.0 | 23.4 |
| Unpaid domestic services for household members | 31.3 | 81.5 | 56.9 | 30.6 | 80.0 | 56.1 | 31.2 | 81.2 | 56.7 |
| Unpaid caregiving services for household members | 19.2 | 33.7 | 26.6 | 16.0 | 27.6 | 22.0 | 18.5 | 32.3 | 25.6 |
| Unpaid volunteer, trainee and other unpaid work | 0.7 | 0.3 | 0.5 | 0.6 | 0.8 | 0.7 | 0.7 | 0.4 | 0.6 |
| Learning | 17.8 | 17.5 | 17.7 | 22.6 | 18.7 | 20.6 | 18.9 | 17.8 | 18.3 |
| Socializing and communication, community participation and religious practice | 74.8 | 81.4 | 78.2 | 68.9 | 85.4 | 77.4 | 73.5 | 82.3 | 78.0 |
| Culture, leisure, mass-media and sports practices | 96.9 | 94.6 | 95.7 | 94.6 | 95.1 | 94.9 | 96.4 | 94.7 | 95.5 |
| Self-care and maintenance | 100.0 | 100.0 | 100.0 | 100.0 | 100.0 | 100.0 | 100.0 | 100.0 | 100.0 |
| Uttar Pradesh | |||||||||
| Employment and related activities | 56.8 | 14.0 | 35.1 | 60.8 | 10.3 | 36.1 | 57.6 | 13.2 | 35.3 |
| Production of goods for own final use | 23.0 | 21.2 | 22.1 | 3.0 | 3.7 | 3.3 | 18.8 | 17.7 | 18.2 |
| Unpaid domestic services for household members | 25.0 | 80.2 | 52.9 | 23.3 | 80.1 | 51.1 | 24.6 | 80.1 | 52.5 |
| Unpaid caregiving services for household members | 15.7 | 36.6 | 26.3 | 18.4 | 34.6 | 26.3 | 16.3 | 36.2 | 26.3 |
| Unpaid volunteer, trainee and other unpaid work | 0.5 | 0.4 | 0.4 | 0.4 | 0.2 | 0.3 | 0.5 | 0.3 | 0.4 |
| Learning | 25.7 | 22.1 | 23.9 | 23.9 | 22.1 | 23.0 | 25.3 | 22.1 | 23.7 |
| Socializing and communication, community participation and religious practice | 73.4 | 76.7 | 75.1 | 70.4 | 76.3 | 73.3 | 72.8 | 76.6 | 74.7 |
| Culture, leisure, mass-media and sports practices | 90.3 | 85.7 | 88.0 | 92.8 | 92.8 | 92.8 | 90.8 | 87.2 | 89.0 |
| Self-care and maintenance | 100.0 | 100.0 | 100.0 | 100.0 | 100.0 | 100.0 | 100.0 | 100.0 | 100.0 |
| Uttarakhand | |||||||||
| Employment and related activities | 50.1 | 8.4 | 29.2 | 56.4 | 12.1 | 34.7 | 51.7 | 9.4 | 30.6 |
| Production of goods for own final use | 17.1 | 35.9 | 26.6 | 1.8 | 5.8 | 3.8 | 13.1 | 28.2 | 20.6 |
| Unpaid domestic services for household members | 28.3 | 79.8 | 54.2 | 31.0 | 79.9 | 55.0 | 29.0 | 79.8 | 54.4 |
| Unpaid caregiving services for household members | 17.6 | 35.0 | 26.3 | 20.7 | 33.2 | 26.8 | 18.4 | 34.6 | 26.5 |
| Unpaid volunteer, trainee and other unpaid work | 0.7 | 0.7 | 0.7 | 0.6 | 0.7 | 0.7 | 0.7 | 0.7 | 0.7 |
| Learning | 26.4 | 21.8 | 24.1 | 29.4 | 25.7 | 27.6 | 27.2 | 22.8 | 25.0 |
| Socializing and communication, community participation and religious practice | 80.1 | 82.6 | 81.4 | 77.6 | 84.6 | 81.0 | 79.4 | 83.1 | 81.3 |
| Culture, leisure, mass-media and sports practices | 98.8 | 96.8 | 97.8 | 99.0 | 97.8 | 98.4 | 98.9 | 97.0 | 98.0 |
| Self-care and maintenance | 100.0 | 100.0 | 100.0 | 100.0 | 100.0 | 100.0 | 100.0 | 100.0 | 100.0 |
Statement 3.1: Percentage of persons participating in a day in activities of major divisions of TUS activity classification as major activity (considering only the major activity of the time slots)
| major divisions of TUS activity classification | rural | urban | rural+urban | ||||||
|---|---|---|---|---|---|---|---|---|---|
| male | female | person | male | female | person | male | female | person | |
| (1) | (2) | (3) | (4) | (5) | (6) | (7) | (8) | (9) | (10) |
| West Bengal | |||||||||
| Employment and related activities | 65.5 | 17.5 | 41.2 | 62.0 | 20.3 | 41.1 | 64.4 | 18.3 | 41.2 |
| Production of goods for own final use | 10.9 | 31.1 | 21.1 | 3.5 | 12.4 | 8.0 | 8.7 | 25.4 | 17.1 |
| Unpaid domestic services for household members | 30.1 | 81.2 | 55.9 | 33.6 | 79.1 | 56.4 | 31.2 | 80.6 | 56.1 |
| Unpaid caregiving services for household members | 12.6 | 31.9 | 22.3 | 10.8 | 26.5 | 18.7 | 12.0 | 30.2 | 21.2 |
| Unpaid volunteer, trainee and other unpaid work | 0.8 | 1.0 | 0.9 | 0.7 | 0.9 | 0.8 | 0.8 | 1.0 | 0.9 |
| Learning | 20.1 | 18.7 | 19.4 | 19.6 | 18.3 | 19.0 | 20.0 | 18.6 | 19.3 |
| Socializing and communication, community participation and religious practice | 73.1 | 83.8 | 78.5 | 65.9 | 80.3 | 73.1 | 70.9 | 82.7 | 76.9 |
| Culture, leisure, mass-media and sports practices | 89.5 | 79.7 | 84.6 | 91.1 | 88.8 | 89.9 | 90.0 | 82.5 | 86.2 |
| Self-care and maintenance | 100.0 | 100.0 | 100.0 | 100.0 | 100.0 | 100.0 | 100.0 | 100.0 | 100.0 |
| A \& N Islands | |||||||||
| Employment and related activities | 56.0 | 14.0 | 36.6 | 50.9 | 19.0 | 35.7 | 54.1 | 15.9 | 36.3 |
| Production of goods for own final use | 27.9 | 31.5 | 29.5 | 2.3 | 7.8 | 4.9 | 18.5 | 22.5 | 20.4 |
| Unpaid domestic services for household members | 27.5 | 82.1 | 52.7 | 22.4 | 73.1 | 46.6 | 25.6 | 78.7 | 50.4 |
| Unpaid caregiving services for household members | 7.9 | 20.8 | 13.8 | 8.7 | 21.7 | 14.9 | 8.2 | 21.2 | 14.2 |
| Unpaid volunteer, trainee and other unpaid work | – | 1.1 | 0.5 | – | 0.7 | 0.3 | – | 1.0 | 0.5 |
| Learning | 19.5 | 16.7 | 18.2 | 33.1 | 28.3 | 30.8 | 24.5 | 21.1 | 22.9 |
| Socializing and communication, community participation and religious practice | 55.2 | 68.1 | 61.2 | 48.6 | 57.5 | 52.8 | 52.8 | 64.0 | 58.1 |
| Culture, leisure, mass-media and sports practices | 93.1 | 95.5 | 94.2 | 92.4 | 90.4 | 91.4 | 92.9 | 93.6 | 93.2 |
| Self-care and maintenance | 100.0 | 100.0 | 100.0 | 100.0 | 100.0 | 100.0 | 100.0 | 100.0 | 100.0 |
| Chandigarh | |||||||||
| Employment and related activities | – | – | – | 66.6 | 22.1 | 45.5 | 66.6 | 22.1 | 45.5 |
| Production of goods for own final use | – | – | – | 0.2 | 1.6 | 0.9 | 0.2 | 1.6 | 0.9 |
| Unpaid domestic services for household members | – | – | – | 28.9 | 77.9 | 52.1 | 28.9 | 77.9 | 52.1 |
| Unpaid caregiving services for household members | – | – | – | 19.7 | 30.9 | 25.0 | 19.7 | 30.9 | 25.0 |
| Unpaid volunteer, trainee and other unpaid work | – | – | – | 0.3 | – | 0.1 | 0.3 | – | 0.1 |
| Learning | – | – | – | 17.8 | 24.9 | 21.2 | 17.8 | 24.9 | 21.2 |
| Socializing and communication, community participation and religious practice | – | – | – | 52.7 | 66.2 | 59.1 | 52.7 | 66.2 | 59.1 |
| Culture, leisure, mass-media and sports practices | – | – | – | 95.5 | 98.2 | 96.8 | 95.5 | 98.2 | 96.8 |
| Self-care and maintenance | – | – | – | 100.0 | 100.0 | 100.0 | 100.0 | 100.0 | 100.0 |
| Dadra \& Nagar Haveli and Daman \& Diu | |||||||||
| Employment and related activities | 57.7 | 35.2 | 46.9 | 72.2 | 33.2 | 56.0 | 67.4 | 34.0 | 52.7 |
| Production of goods for own final use | 8.8 | 26.8 | 17.5 | 4.4 | 3.1 | 4.1 | 5.9 | 12.5 | 8.9 |
| Unpaid domestic services for household members | 24.6 | 81.8 | 52.1 | 37.8 | 82.0 | 56.3 | 33.3 | 81.9 | 54.8 |
| Unpaid caregiving services for household members | 13.0 | 27.3 | 19.9 | 11.0 | 26.2 | 17.3 | 11.7 | 26.6 | 18.2 |
| Unpaid volunteer, trainee and other unpaid work | 0.4 | 0.9 | 0.6 | 0.2 | 0.3 | 0.2 | 0.3 | 0.5 | 0.4 |
| Learning | 22.3 | 22.8 | 22.6 | 18.7 | 21.9 | 20.0 | 19.9 | 22.2 | 20.9 |
| Socializing and communication, community participation and religious practice | 74.6 | 70.8 | 72.8 | 65.2 | 81.2 | 71.7 | 68.4 | 77.1 | 72.1 |
| Culture, leisure, mass-media and sports practices | 98.9 | 97.4 | 98.2 | 98.3 | 96.8 | 97.7 | 98.5 | 97.1 | 97.9 |
| Self-care and maintenance | 100.0 | 100.0 | 100.0 | 100.0 | 100.0 | 100.0 | 100.0 | 100.0 | 100.0 |
Statement 3.1: Percentage of persons participating in a day in activities of major divisions of TUS activity classification as major activity (considering only the major activity of the time slots)
| major divisions of TUS activity classification | rural | urban | rural+urban | ||||||
|---|---|---|---|---|---|---|---|---|---|
| male | female | person | male | female | person | male | female | person | |
| (1) | (2) | (3) | (4) | (5) | (6) | (7) | (8) | (9) | (10) |
| Jammu \& Kashmir | |||||||||
| Employment and related activities | 53.0 | 4.3 | 29.4 | 63.1 | 17.2 | 40.9 | 55.6 | 7.6 | 32.3 |
| Production of goods for own final use | 26.1 | 37.6 | 31.7 | 7.9 | 9.4 | 8.6 | 21.5 | 30.4 | 25.8 |
| Unpaid domestic services for household members | 23.6 | 75.2 | 48.6 | 15.3 | 78.7 | 45.9 | 21.5 | 76.0 | 47.9 |
| Unpaid caregiving services for household members | 12.5 | 32.7 | 22.3 | 10.1 | 31.6 | 20.5 | 11.9 | 32.4 | 21.9 |
| Unpaid volunteer, trainee and other unpaid work | 0.1 | 0.0 | 0.0 | 0.2 | 0.1 | 0.0 | 0.1 | 0.0 | |
| Learning | 30.3 | 30.0 | 30.2 | 25.7 | 22.7 | 24.2 | 29.2 | 28.1 | 28.6 |
| Socializing and communication, community participation and religious practice | 74.0 | 74.4 | 74.2 | 59.6 | 69.6 | 64.4 | 70.3 | 73.2 | 71.7 |
| Culture, leisure, mass-media and sports practices | 95.1 | 94.2 | 94.7 | 96.3 | 91.2 | 93.8 | 95.4 | 93.5 | 94.5 |
| Self-care and maintenance | 100.0 | 100.0 | 100.0 | 100.0 | 100.0 | 100.0 | 100.0 | 100.0 | 100.0 |
| Ladakh | |||||||||
| Employment and related activities | 62.4 | 5.5 | 35.3 | 62.3 | 11.4 | 38.9 | 62.3 | 6.1 | 35.7 |
| Production of goods for own final use | 16.2 | 34.5 | 24.9 | 3.1 | 10.8 | 6.6 | 14.7 | 31.9 | 22.8 |
| Unpaid domestic services for household members | 20.8 | 81.4 | 49.6 | 21.4 | 86.9 | 51.5 | 20.8 | 82.0 | 49.8 |
| Unpaid caregiving services for household members | 27.4 | 52.5 | 39.3 | 22.7 | 43.9 | 32.5 | 26.8 | 51.5 | 38.5 |
| Unpaid volunteer, trainee and other unpaid work | 0.3 | 0.1 | – | – | – | – | 0.3 | 0.1 | |
| Learning | 26.9 | 20.9 | 24.1 | 27.3 | 19.8 | 23.9 | 27.0 | 20.8 | 24.1 |
| Socializing and communication, community participation and religious practice | 75.4 | 77.5 | 76.4 | 73.9 | 77.3 | 75.4 | 75.2 | 77.5 | 76.3 |
| Culture, leisure, mass-media and sports practices | 96.2 | 93.6 | 95.0 | 95.8 | 96.1 | 96.0 | 96.2 | 93.9 | 95.1 |
| Self-care and maintenance | 100.0 | 100.0 | 100.0 | 100.0 | 100.0 | 100.0 | 100.0 | 100.0 | 100.0 |
| Lakshadweep | |||||||||
| Employment and related activities | 52.4 | 14.2 | 32.2 | 51.8 | 14.5 | 31.2 | 52.0 | 14.4 | 31.4 |
| Production of goods for own final use | 14.2 | 12.8 | 13.5 | 13.7 | 8.3 | 10.7 | 13.8 | 9.2 | 11.3 |
| Unpaid domestic services for household members | 20.9 | 83.2 | 53.8 | 33.1 | 83.4 | 60.9 | 30.5 | 83.4 | 59.5 |
| Unpaid caregiving services for household members | 18.4 | 61.0 | 40.9 | 12.4 | 42.3 | 28.9 | 13.7 | 46.0 | 31.4 |
| Unpaid volunteer, trainee and other unpaid work | 3.5 | 1.2 | 2.3 | 6.5 | 3.1 | 4.6 | 5.8 | 2.7 | 4.1 |
| Learning | 14.9 | 12.2 | 13.5 | 19.5 | 15.1 | 17.1 | 18.5 | 14.6 | 16.3 |
| Socializing and communication, community participation and religious practice | 97.6 | 97.5 | 97.5 | 94.1 | 94.3 | 94.3 | 94.9 | 95.0 | 94.9 |
| Culture, leisure, mass-media and sports practices | 92.6 | 86.3 | 89.3 | 97.1 | 90.8 | 93.6 | 96.1 | 89.9 | 92.7 |
| Self-care and maintenance | 100.0 | 100.0 | 100.0 | 100.0 | 100.0 | 100.0 | 100.0 | 100.0 | 100.0 |
| Puducherry | |||||||||
| Employment and related activities | 60.4 | 26.1 | 42.5 | 51.5 | 20.1 | 34.4 | 54.5 | 22.0 | 37.0 |
| Production of goods for own final use | 11.7 | 20.9 | 16.5 | 8.8 | 15.0 | 12.2 | 9.8 | 16.9 | 13.6 |
| Unpaid domestic services for household members | 42.6 | 85.6 | 65.1 | 36.5 | 82.0 | 61.3 | 38.6 | 83.2 | 62.5 |
| Unpaid caregiving services for household members | 25.0 | 31.0 | 28.1 | 19.4 | 28.9 | 24.5 | 21.3 | 29.5 | 25.7 |
| Unpaid volunteer, trainee and other unpaid work | 0.7 | 0.7 | 0.7 | 1.5 | 1.9 | 1.7 | 1.2 | 1.5 | 1.4 |
| Learning | 19.5 | 14.6 | 17.0 | 18.3 | 18.8 | 18.6 | 18.7 | 17.5 | 18.1 |
| Socializing and communication, community participation and religious practice | 86.1 | 83.8 | 84.9 | 79.2 | 80.1 | 79.7 | 81.6 | 81.3 | 81.4 |
| Culture, leisure, mass-media and sports practices | 84.6 | 82.3 | 83.4 | 91.0 | 86.6 | 88.6 | 88.8 | 85.2 | 86.9 |
| Self-care and maintenance | 100.0 | 100.0 | 100.0 | 100.0 | 100.0 | 100.0 | 100.0 | 100.0 | 100.0 |
| Statement 3.1: Percentage of persons participating in a day in activities of major divisions of TUS activity classification as major activity (considering only the major activity of the time slots) | |||||||||
|---|---|---|---|---|---|---|---|---|---|
| major divisions of TUS activity classification | rural | urban | rural+urban | ||||||
| male | female | person | male | female | person | male | female | person | |
| (1) | (2) | (3) | (4) | (5) | (6) | (7) | (8) | (9) | (10) |
| All India | |||||||||
| Employment and related activities | 60.4 | 21.8 | 41.0 | 61.7 | 18.1 | 40.5 | 60.8 | 20.7 | 40.8 |
| Production of goods for own final use | 16.9 | 24.9 | 20.9 | 3.3 | 8.6 | 5.9 | 12.6 | 20.0 | 16.3 |
| Unpaid domestic services for household members | 24.4 | 81.2 | 52.9 | 26.2 | 80.2 | 52.4 | 25.0 | 80.9 | 52.7 |
| Unpaid caregiving services for household members | 16.4 | 32.7 | 24.6 | 15.8 | 30.2 | 22.8 | 16.2 | 32.0 | 24.0 |
| Unpaid volunteer, trainee and other unpaid work | 0.8 | 1.0 | 0.9 | 0.8 | 1.1 | 1.0 | 0.8 | 1.0 | 0.9 |
| Learning | 23.1 | 20.3 | 21.7 | 21.2 | 20.1 | 20.7 | 22.5 | 20.2 | 21.4 |
| Socializing and communication, community participation and religious practice | 75.2 | 77.8 | 76.5 | 68.8 | 76.1 | 72.3 | 73.2 | 77.2 | 75.2 |
| Culture, leisure, mass-media and sports practices | 92.5 | 86.0 | 89.2 | 93.4 | 92.4 | 92.9 | 92.8 | 87.9 | 90.4 |
| Self-care and maintenance | 100.0 | 100.0 | 100.0 | 100.0 | 100.0 | 100.0 | 100.0 | 100.0 | 100.0 |
Statement 4.1: Minutes spent in a day on an average per participant of age 6 years and above in the activites of major divisions of TUS activity classification as a major activity (considering only the major activity of the time slots)
| major divisions of TUS activity classification | rural | urban | rural+urban | ||||||
|---|---|---|---|---|---|---|---|---|---|
| male | female | person | male | female | person | male | female | person | |
| (1) | (2) | (3) | (4) | (5) | (6) | (7) | (8) | (9) | (10) |
| Andhra Pradesh | |||||||||
| Employment and related activities | 505 | 415 | 473 | 525 | 406 | 494 | 511 | 413 | 478 |
| Production of goods for own final use | 81 | 67 | 72 | 46 | 46 | 46 | 75 | 60 | 65 |
| Unpaid domestic services for household members | 92 | 262 | 234 | 94 | 290 | 246 | 93 | 271 | 238 |
| Unpaid caregiving services for household members | 73 | 143 | 122 | 84 | 159 | 135 | 77 | 148 | 126 |
| Unpaid volunteer, trainee and other unpaid work | 147 | 159 | 153 | 150 | 143 | 146 | 148 | 154 | 151 |
| Learning | 485 | 463 | 475 | 477 | 474 | 476 | 482 | 467 | 475 |
| Socializing and communication, community participation and religious practice | 126 | 119 | 123 | 118 | 108 | 113 | 123 | 115 | 119 |
| Culture, leisure, mass-media and sports practices | 169 | 164 | 167 | 191 | 185 | 188 | 176 | 171 | 174 |
| Self-care and maintenance | 739 | 730 | 735 | 736 | 737 | 736 | 738 | 732 | 735 |
| Arunachal Pradesh | |||||||||
| Employment and related activities | 409 | 322 | 397 | 451 | 400 | 443 | 417 | 340 | 406 |
| Production of goods for own final use | 140 | 166 | 157 | 118 | 112 | 113 | 139 | 161 | 154 |
| Unpaid domestic services for household members | 103 | 367 | 266 | 107 | 366 | 264 | 104 | 366 | 266 |
| Unpaid caregiving services for household members | 84 | 105 | 98 | 99 | 129 | 121 | 86 | 110 | 102 |
| Unpaid volunteer, trainee and other unpaid work | 300 | 150 | 226 | – | – | 300 | 150 | 226 | |
| Learning | 451 | 444 | 449 | 421 | 393 | 411 | 443 | 431 | 438 |
| Socializing and communication, community participation and religious practice | 87 | 99 | 93 | 95 | 79 | 87 | 88 | 95 | 92 |
| Culture, leisure, mass-media and sports practices | 166 | 122 | 146 | 198 | 167 | 184 | 173 | 131 | 154 |
| Self-care and maintenance | 753 | 713 | 734 | 722 | 690 | 707 | 746 | 709 | 728 |
| Assam | |||||||||
| Employment and related activities | 458 | 325 | 436 | 504 | 405 | 488 | 463 | 334 | 442 |
| Production of goods for own final use | 88 | 85 | 86 | 72 | 78 | 76 | 88 | 85 | 86 |
| Unpaid domestic services for household members | 97 | 334 | 266 | 108 | 328 | 251 | 98 | 334 | 264 |
| Unpaid caregiving services for household members | 74 | 133 | 111 | 77 | 134 | 112 | 75 | 133 | 111 |
| Unpaid volunteer, trainee and other unpaid work | 297 | 163 | 225 | 271 | 102 | 167 | 295 | 156 | 220 |
| Learning | 409 | 432 | 420 | 437 | 436 | 436 | 413 | 433 | 422 |
| Socializing and communication, community participation and religious practice | 118 | 124 | 121 | 98 | 119 | 109 | 116 | 124 | 120 |
| Culture, leisure, mass-media and sports practices | 187 | 162 | 175 | 204 | 193 | 199 | 189 | 166 | 178 |
| Self-care and maintenance | 720 | 712 | 716 | 707 | 702 | 705 | 719 | 711 | 715 |
| Bihar | |||||||||
| Employment and related activities | 445 | 256 | 414 | 515 | 349 | 494 | 453 | 264 | 423 |
| Production of goods for own final use | 158 | 124 | 141 | 162 | 97 | 125 | 158 | 124 | 140 |
| Unpaid domestic services for household members | 93 | 334 | 274 | 106 | 337 | 270 | 95 | 334 | 273 |
| Unpaid caregiving services for household members | 91 | 149 | 129 | 96 | 164 | 142 | 91 | 151 | 131 |
| Unpaid volunteer, trainee and other unpaid work | 122 | 113 | 117 | 91 | 102 | 97 | 120 | 112 | 115 |
| Learning | 436 | 430 | 433 | 437 | 411 | 426 | 436 | 428 | 432 |
| Socializing and communication, community participation and religious practice | 135 | 146 | 141 | 111 | 130 | 121 | 132 | 144 | 139 |
| Culture, leisure, mass-media and sports practices | 180 | 156 | 169 | 183 | 175 | 179 | 181 | 158 | 170 |
| Self-care and maintenance | 723 | 711 | 717 | 710 | 714 | 712 | 721 | 711 | 716 |
Statement 4.1: Minutes spent in a day on an average per participant of age 6 years and above in the activites of major divisions of TUS activity classification as a major activity (considering only the major activity of the time slots)
| major divisions of TUS activity classification | rural | urban | rural+urban | ||||||
|---|---|---|---|---|---|---|---|---|---|
| male | female | person | male | female | person | male | female | person | |
| (1) | (2) | (3) | (4) | (5) | (6) | (7) | (8) | (9) | (10) |
| Chhattisgarh | |||||||||
| Employment and related activities | 465 | 375 | 433 | 533 | 396 | 495 | 481 | 379 | 446 |
| Production of goods for own final use | 252 | 122 | 176 | 75 | 55 | 59 | 245 | 114 | 166 |
| Unpaid domestic services for household members | 107 | 266 | 235 | 108 | 274 | 238 | 107 | 268 | 236 |
| Unpaid caregiving services for household members | 99 | 131 | 118 | 86 | 140 | 121 | 96 | 133 | 119 |
| Unpaid volunteer, trainee and other unpaid work | 159 | 212 | 194 | 284 | 238 | 262 | 194 | 216 | 208 |
| Learning | 411 | 396 | 403 | 404 | 380 | 392 | 409 | 392 | 400 |
| Socializing and communication, community participation and religious practice | 140 | 125 | 133 | 120 | 124 | 122 | 136 | 125 | 130 |
| Culture, leisure, mass-media and sports practices | 181 | 169 | 175 | 197 | 202 | 200 | 185 | 177 | 181 |
| Self-care and maintenance | 733 | 723 | 728 | 714 | 720 | 717 | 729 | 722 | 725 |
| Delhi | |||||||||
| Employment and related activities | 580 | 517 | 573 | 583 | 472 | 571 | 583 | 475 | 571 |
| Production of goods for own final use | – | – | 259 | 137 | 169 | 259 | 137 | 169 | |
| Unpaid domestic services for household members | 154 | 324 | 258 | 115 | 327 | 259 | 118 | 327 | 259 |
| Unpaid caregiving services for household members | 113 | 236 | 185 | 86 | 181 | 145 | 88 | 185 | 148 |
| Unpaid volunteer, trainee and other unpaid work | – | – | 106 | 60 | 94 | 106 | 60 | 94 | |
| Learning | 534 | 393 | 447 | 474 | 443 | 459 | 476 | 440 | 459 |
| Socializing and communication, community participation and religious practice | 120 | 112 | 117 | 110 | 130 | 120 | 111 | 129 | 120 |
| Culture, leisure, mass-media and sports practices | 140 | 178 | 156 | 175 | 206 | 189 | 173 | 204 | 187 |
| Self-care and maintenance | 649 | 653 | 651 | 681 | 695 | 687 | 679 | 693 | 686 |
| Goa | |||||||||
| Employment and related activities | 551 | 510 | 540 | 562 | 523 | 551 | 558 | 519 | 547 |
| Production of goods for own final use | 196 | 153 | 170 | 120 | 68 | 98 | 160 | 126 | 142 |
| Unpaid domestic services for household members | 111 | 279 | 237 | 78 | 270 | 211 | 90 | 274 | 221 |
| Unpaid caregiving services for household members | 92 | 171 | 146 | 74 | 178 | 137 | 79 | 175 | 140 |
| Unpaid volunteer, trainee and other unpaid work | – | – | 210 | – | 210 | 210 | – | 210 | |
| Learning | 375 | 409 | 395 | 414 | 428 | 421 | 402 | 421 | 412 |
| Socializing and communication, community participation and religious practice | 118 | 133 | 126 | 88 | 92 | 90 | 101 | 109 | 105 |
| Culture, leisure, mass-media and sports practices | 212 | 201 | 206 | 177 | 186 | 182 | 191 | 192 | 191 |
| Self-care and maintenance | 733 | 725 | 729 | 734 | 754 | 744 | 733 | 743 | 738 |
| Gujarat | |||||||||
| Employment and related activities | 480 | 335 | 435 | 563 | 395 | 527 | 516 | 353 | 472 |
| Production of goods for own final use | 158 | 86 | 104 | 81 | 46 | 50 | 149 | 77 | 94 |
| Unpaid domestic services for household members | 113 | 310 | 289 | 108 | 320 | 280 | 110 | 314 | 285 |
| Unpaid caregiving services for household members | 73 | 121 | 104 | 81 | 140 | 118 | 77 | 129 | 110 |
| Unpaid volunteer, trainee and other unpaid work | 105 | 86 | 97 | 117 | 119 | 119 | 109 | 107 | 108 |
| Learning | 437 | 429 | 434 | 411 | 408 | 410 | 426 | 420 | 423 |
| Socializing and communication, community participation and religious practice | 125 | 124 | 124 | 128 | 133 | 130 | 126 | 128 | 127 |
| Culture, leisure, mass-media and sports practices | 163 | 138 | 151 | 180 | 176 | 178 | 171 | 155 | 163 |
| Self-care and maintenance | 748 | 737 | 743 | 714 | 725 | 719 | 732 | 732 | 732 |
Statement 4.1: Minutes spent in a day on an average per participant of age 6 years and above in the activites of major divisions of TUS activity classification as a major activity (considering only the major activity of the time slots)
| major divisions of TUS activity classification | rural | urban | rural+urban | ||||||
|---|---|---|---|---|---|---|---|---|---|
| male | female | person | male | female | person | male | female | person | |
| (1) | (2) | (3) | (4) | (5) | (6) | (7) | (8) | (9) | (10) |
| Haryana | |||||||||
| Employment and related activities | 489 | 315 | 456 | 552 | 424 | 532 | 520 | 363 | 493 |
| Production of goods for own final use | 140 | 158 | 150 | 85 | 124 | 109 | 136 | 154 | 146 |
| Unpaid domestic services for household members | 111 | 325 | 294 | 99 | 324 | 260 | 103 | 325 | 277 |
| Unpaid caregiving services for household members | 74 | 126 | 109 | 71 | 133 | 110 | 72 | 129 | 109 |
| Unpaid volunteer, trainee and other unpaid work | 321 | 145 | 240 | 142 | 123 | 141 | 181 | 141 | 174 |
| Learning | 409 | 416 | 412 | 427 | 412 | 420 | 417 | 414 | 415 |
| Socializing and communication, community participation and religious practice | 121 | 134 | 127 | 104 | 130 | 117 | 113 | 132 | 122 |
| Culture, leisure, mass-media and sports practices | 206 | 187 | 197 | 194 | 210 | 202 | 200 | 197 | 199 |
| Self-care and maintenance | 723 | 701 | 712 | 697 | 688 | 693 | 710 | 695 | 703 |
| Himachal Pradesh | |||||||||
| Employment and related activities | 486 | 278 | 434 | 530 | 441 | 508 | 493 | 303 | 446 |
| Production of goods for own final use | 147 | 153 | 151 | 133 | 132 | 133 | 146 | 153 | 150 |
| Unpaid domestic services for household members | 99 | 292 | 254 | 104 | 280 | 223 | 100 | 291 | 250 |
| Unpaid caregiving services for household members | 83 | 146 | 128 | 94 | 131 | 117 | 85 | 145 | 127 |
| Unpaid volunteer, trainee and other unpaid work | 230 | 116 | 167 | 250 | 82 | 156 | 232 | 113 | 166 |
| Learning | 434 | 417 | 426 | 429 | 437 | 433 | 434 | 419 | 427 |
| Socializing and communication, community participation and religious practice | 128 | 122 | 125 | 111 | 127 | 119 | 126 | 123 | 124 |
| Culture, leisure, mass-media and sports practices | 219 | 185 | 202 | 230 | 230 | 230 | 221 | 191 | 205 |
| Self-care and maintenance | 698 | 681 | 689 | 648 | 657 | 652 | 691 | 678 | 685 |
| Jharkhand | |||||||||
| Employment and related activities | 472 | 273 | 421 | 533 | 373 | 501 | 484 | 288 | 436 |
| Production of goods for own final use | 166 | 142 | 151 | 91 | 95 | 93 | 162 | 140 | 148 |
| Unpaid domestic services for household members | 95 | 327 | 272 | 104 | 341 | 273 | 97 | 329 | 272 |
| Unpaid caregiving services for household members | 94 | 147 | 128 | 89 | 145 | 127 | 94 | 146 | 128 |
| Unpaid volunteer, trainee and other unpaid work | 111 | 103 | 106 | 302 | 183 | 224 | 148 | 116 | 126 |
| Learning | 415 | 409 | 412 | 441 | 431 | 436 | 421 | 413 | 417 |
| Socializing and communication, community participation and religious practice | 130 | 126 | 128 | 116 | 124 | 120 | 127 | 125 | 126 |
| Culture, leisure, mass-media and sports practices | 178 | 142 | 161 | 196 | 175 | 186 | 181 | 149 | 166 |
| Self-care and maintenance | 711 | 695 | 703 | 687 | 681 | 684 | 707 | 692 | 699 |
| Karnataka | |||||||||
| Employment and related activities | 474 | 376 | 446 | 537 | 416 | 508 | 499 | 389 | 469 |
| Production of goods for own final use | 83 | 66 | 75 | 56 | 62 | 60 | 80 | 65 | 73 |
| Unpaid domestic services for household members | 86 | 308 | 258 | 99 | 309 | 252 | 91 | 308 | 256 |
| Unpaid caregiving services for household members | 69 | 119 | 102 | 73 | 133 | 112 | 70 | 124 | 106 |
| Unpaid volunteer, trainee and other unpaid work | 143 | 102 | 114 | 89 | 114 | 104 | 118 | 106 | 110 |
| Learning | 430 | 437 | 433 | 396 | 444 | 418 | 414 | 440 | 426 |
| Socializing and communication, community participation and religious practice | 113 | 104 | 108 | 104 | 103 | 104 | 110 | 104 | 107 |
| Culture, leisure, mass-media and sports practices | 167 | 157 | 162 | 173 | 166 | 170 | 169 | 161 | 165 |
| Self-care and maintenance | 740 | 730 | 735 | 743 | 739 | 741 | 741 | 734 | 738 |
Statement 4.1: Minutes spent in a day on an average per participant of age 6 years and above in the activites of major divisions of TUS activity classification as a major activity (considering only the major activity of the time slots)
| major divisions of TUS activity classification | rural | urban | rural+urban | ||||||
|---|---|---|---|---|---|---|---|---|---|
| male | female | person | male | female | person | male | female | person | |
| (1) | (2) | (3) | (4) | (5) | (6) | (7) | (8) | (9) | (10) |
| Kerala | |||||||||
| Employment and related activities | 484 | 398 | 457 | 499 | 407 | 470 | 492 | 402 | 463 |
| Production of goods for own final use | 106 | 76 | 88 | 103 | 71 | 84 | 105 | 74 | 86 |
| Unpaid domestic services for household members | 94 | 284 | 229 | 93 | 273 | 218 | 94 | 279 | 224 |
| Unpaid caregiving services for household members | 84 | 147 | 127 | 91 | 163 | 140 | 87 | 154 | 133 |
| Unpaid volunteer, trainee and other unpaid work | 166 | 148 | 155 | 153 | 143 | 147 | 159 | 146 | 151 |
| Learning | 435 | 407 | 420 | 425 | 428 | 427 | 430 | 418 | 423 |
| Socializing and communication, community participation and religious practice | 148 | 136 | 141 | 154 | 143 | 148 | 150 | 139 | 144 |
| Culture, leisure, mass-media and sports practices | 213 | 176 | 193 | 217 | 187 | 201 | 215 | 181 | 197 |
| Self-care and maintenance | 727 | 703 | 714 | 717 | 698 | 707 | 722 | 700 | 711 |
| Madhya Pradesh | |||||||||
| Employment and related activities | 433 | 332 | 407 | 503 | 375 | 480 | 453 | 340 | 426 |
| Production of goods for own final use | 120 | 111 | 115 | 88 | 65 | 73 | 117 | 105 | 110 |
| Unpaid domestic services for household members | 112 | 320 | 271 | 103 | 317 | 269 | 110 | 319 | 271 |
| Unpaid caregiving services for household members | 83 | 128 | 111 | 83 | 142 | 120 | 83 | 132 | 113 |
| Unpaid volunteer, trainee and other unpaid work | 154 | 95 | 122 | 173 | 117 | 143 | 158 | 99 | 126 |
| Learning | 385 | 387 | 386 | 403 | 390 | 397 | 391 | 388 | 390 |
| Socializing and communication, community participation and religious practice | 143 | 126 | 135 | 121 | 124 | 123 | 137 | 125 | 132 |
| Culture, leisure, mass-media and sports practices | 181 | 156 | 169 | 194 | 195 | 195 | 185 | 168 | 177 |
| Self-care and maintenance | 723 | 709 | 716 | 713 | 710 | 711 | 720 | 709 | 715 |
| Maharashtra | |||||||||
| Employment and related activities | 479 | 393 | 450 | 559 | 440 | 533 | 513 | 406 | 482 |
| Production of goods for own final use | 109 | 71 | 84 | 68 | 44 | 47 | 103 | 61 | 73 |
| Unpaid domestic services for household members | 101 | 288 | 249 | 95 | 292 | 252 | 99 | 290 | 250 |
| Unpaid caregiving services for household members | 84 | 135 | 117 | 76 | 133 | 113 | 81 | 134 | 115 |
| Unpaid volunteer, trainee and other unpaid work | 141 | 117 | 129 | 160 | 117 | 137 | 148 | 117 | 132 |
| Learning | 421 | 428 | 424 | 429 | 421 | 425 | 424 | 425 | 424 |
| Socializing and communication, community participation and religious practice | 131 | 114 | 123 | 115 | 113 | 114 | 125 | 114 | 119 |
| Culture, leisure, mass-media and sports practices | 172 | 152 | 162 | 189 | 182 | 185 | 179 | 165 | 173 |
| Self-care and maintenance | 737 | 728 | 733 | 724 | 742 | 733 | 732 | 734 | 733 |
| Manipur | |||||||||
| Employment and related activities | 442 | 320 | 400 | 467 | 343 | 416 | 450 | 328 | 405 |
| Production of goods for own final use | 112 | 132 | 124 | 104 | 113 | 109 | 110 | 128 | 121 |
| Unpaid domestic services for household members | 77 | 265 | 218 | 82 | 273 | 216 | 79 | 268 | 217 |
| Unpaid caregiving services for household members | 110 | 156 | 135 | 106 | 152 | 132 | 109 | 155 | 134 |
| Unpaid volunteer, trainee and other unpaid work | 185 | 115 | 148 | 223 | 114 | 177 | 194 | 115 | 154 |
| Learning | 510 | 514 | 512 | 488 | 476 | 483 | 504 | 502 | 503 |
| Socializing and communication, community participation and religious practice | 125 | 113 | 119 | 116 | 101 | 108 | 122 | 109 | 115 |
| Culture, leisure, mass-media and sports practices | 200 | 161 | 182 | 215 | 167 | 191 | 205 | 163 | 185 |
| Self-care and maintenance | 702 | 702 | 702 | 690 | 693 | 691 | 698 | 699 | 699 |
Statement 4.1: Minutes spent in a day on an average per participant of age 6 years and above in the activites of major divisions of TUS activity classification as a major activity (considering only the major activity of the time slots)
| major divisions of TUS activity classification | rural | urban | rural+urban | ||||||
|---|---|---|---|---|---|---|---|---|---|
| male | female | person | male | female | person | male | female | person | |
| (1) | (2) | (3) | (4) | (5) | (6) | (7) | (8) | (9) | (10) |
| Meghalaya | |||||||||
| Employment and related activities | 472 | 404 | 454 | 504 | 463 | 493 | 478 | 415 | 461 |
| Production of goods for own final use | 179 | 121 | 151 | 96 | 110 | 102 | 168 | 120 | 145 |
| Unpaid domestic services for household members | 85 | 271 | 214 | 105 | 270 | 218 | 89 | 271 | 214 |
| Unpaid caregiving services for household members | 94 | 135 | 124 | 85 | 136 | 121 | 93 | 135 | 124 |
| Unpaid volunteer, trainee and other unpaid work | 208 | 209 | 209 | 150 | – | 150 | 198 | 209 | 206 |
| Learning | 425 | 427 | 426 | 445 | 432 | 438 | 429 | 428 | 428 |
| Socializing and communication, community participation and religious practice | 166 | 151 | 158 | 134 | 129 | 132 | 160 | 147 | 153 |
| Culture, leisure, mass-media and sports practices | 164 | 155 | 160 | 176 | 183 | 180 | 166 | 161 | 164 |
| Self-care and maintenance | 766 | 749 | 757 | 734 | 724 | 729 | 760 | 744 | 752 |
| Mizoram | |||||||||
| Employment and related activities | 446 | 395 | 431 | 466 | 414 | 452 | 454 | 402 | 439 |
| Production of goods for own final use | 82 | 137 | 110 | 114 | 120 | 118 | 85 | 133 | 112 |
| Unpaid domestic services for household members | 70 | 235 | 188 | 83 | 247 | 200 | 76 | 240 | 194 |
| Unpaid caregiving services for household members | 106 | 200 | 166 | 114 | 206 | 172 | 110 | 203 | 169 |
| Unpaid volunteer, trainee and other unpaid work | 116 | 111 | 113 | 104 | 132 | 112 | 110 | 117 | 113 |
| Learning | 461 | 457 | 459 | 467 | 465 | 466 | 464 | 461 | 463 |
| Socializing and communication, community participation and religious practice | 167 | 152 | 160 | 175 | 159 | 167 | 170 | 155 | 163 |
| Culture, leisure, mass-media and sports practices | 194 | 157 | 177 | 191 | 173 | 182 | 192 | 164 | 179 |
| Self-care and maintenance | 719 | 705 | 712 | 723 | 715 | 719 | 721 | 710 | 715 |
| Nagaland | |||||||||
| Employment and related activities | 343 | 230 | 312 | 418 | 333 | 395 | 380 | 281 | 354 |
| Production of goods for own final use | 254 | 223 | 239 | 126 | 129 | 127 | 232 | 210 | 222 |
| Unpaid domestic services for household members | 91 | 218 | 171 | 115 | 260 | 205 | 99 | 232 | 182 |
| Unpaid caregiving services for household members | 115 | 174 | 149 | 123 | 188 | 160 | 118 | 179 | 153 |
| Unpaid volunteer, trainee and other unpaid work | 165 | 117 | 140 | 169 | 154 | 164 | 166 | 124 | 146 |
| Learning | 376 | 364 | 370 | 413 | 406 | 410 | 393 | 382 | 388 |
| Socializing and communication, community participation and religious practice | 180 | 145 | 163 | 170 | 138 | 155 | 177 | 143 | 160 |
| Culture, leisure, mass-media and sports practices | 210 | 169 | 190 | 213 | 174 | 194 | 211 | 171 | 191 |
| Self-care and maintenance | 741 | 722 | 732 | 720 | 708 | 714 | 734 | 717 | 726 |
| Odisha | |||||||||
| Employment and related activities | 424 | 323 | 402 | 502 | 382 | 478 | 438 | 332 | 415 |
| Production of goods for own final use | 173 | 105 | 127 | 85 | 59 | 65 | 169 | 102 | 123 |
| Unpaid domestic services for household members | 107 | 307 | 263 | 100 | 290 | 240 | 106 | 304 | 259 |
| Unpaid caregiving services for household members | 91 | 141 | 125 | 87 | 142 | 124 | 91 | 141 | 125 |
| Unpaid volunteer, trainee and other unpaid work | 148 | 106 | 124 | 154 | 63 | 106 | 149 | 99 | 121 |
| Learning | 407 | 412 | 409 | 402 | 412 | 407 | 406 | 412 | 409 |
| Socializing and communication, community participation and religious practice | 139 | 137 | 138 | 124 | 137 | 131 | 137 | 137 | 137 |
| Culture, leisure, mass-media and sports practices | 194 | 163 | 179 | 198 | 190 | 194 | 194 | 168 | 181 |
| Self-care and maintenance | 748 | 723 | 735 | 723 | 714 | 718 | 744 | 722 | 733 |
Statement 4.1: Minutes spent in a day on an average per participant of age 6 years and above in the activites of major divisions of TUS activity classification as a major activity (considering only the major activity of the time slots)
| major divisions of TUS activity classification | rural | urban | rural+urban | ||||||
|---|---|---|---|---|---|---|---|---|---|
| male | female | person | male | female | person | male | female | person | |
| (1) | (2) | (3) | (4) | (5) | (6) | (7) | (8) | (9) | (10) |
| Punjab | |||||||||
| Employment and related activities | 491 | 297 | 449 | 531 | 399 | 503 | 507 | 337 | 471 |
| Production of goods for own final use | 140 | 122 | 130 | 238 | 147 | 193 | 150 | 124 | 136 |
| Unpaid domestic services for household members | 99 | 316 | 261 | 108 | 306 | 251 | 103 | 312 | 257 |
| Unpaid caregiving services for household members | 75 | 129 | 110 | 78 | 140 | 116 | 76 | 134 | 112 |
| Unpaid volunteer, trainee and other unpaid work | 181 | 125 | 158 | 165 | 150 | 158 | 176 | 135 | 158 |
| Learning | 420 | 410 | 415 | 414 | 411 | 413 | 418 | 410 | 414 |
| Socializing and communication, community participation and religious practice | 111 | 123 | 117 | 105 | 122 | 114 | 109 | 123 | 116 |
| Culture, leisure, mass-media and sports practices | 190 | 180 | 185 | 189 | 184 | 187 | 190 | 182 | 186 |
| Self-care and maintenance | 731 | 725 | 728 | 727 | 718 | 723 | 729 | 722 | 726 |
| Rajasthan | |||||||||
| Employment and related activities | 465 | 294 | 405 | 523 | 365 | 492 | 483 | 306 | 428 |
| Production of goods for own final use | 168 | 176 | 173 | 121 | 95 | 102 | 166 | 172 | 170 |
| Unpaid domestic services for household members | 88 | 262 | 229 | 99 | 288 | 241 | 91 | 268 | 232 |
| Unpaid caregiving services for household members | 77 | 125 | 109 | 78 | 129 | 112 | 77 | 126 | 110 |
| Unpaid volunteer, trainee and other unpaid work | 203 | 112 | 159 | 241 | 135 | 183 | 212 | 119 | 165 |
| Learning | 400 | 388 | 394 | 415 | 395 | 406 | 404 | 390 | 397 |
| Socializing and communication, community participation and religious practice | 159 | 143 | 151 | 130 | 149 | 139 | 151 | 145 | 148 |
| Culture, leisure, mass-media and sports practices | 181 | 152 | 167 | 180 | 181 | 180 | 181 | 160 | 171 |
| Self-care and maintenance | 720 | 707 | 713 | 705 | 722 | 713 | 716 | 711 | 713 |
| Sikkim | |||||||||
| Employment and related activities | 412 | 321 | 388 | 537 | 427 | 507 | 445 | 349 | 419 |
| Production of goods for own final use | 185 | 126 | 158 | 84 | 76 | 79 | 183 | 124 | 156 |
| Unpaid domestic services for household members | 90 | 284 | 207 | 118 | 293 | 217 | 98 | 286 | 210 |
| Unpaid caregiving services for household members | 84 | 132 | 112 | 83 | 156 | 127 | 84 | 137 | 115 |
| Unpaid volunteer, trainee and other unpaid work | 212 | 290 | 228 | 160 | 160 | 212 | 241 | 220 | |
| Learning | 398 | 388 | 393 | 419 | 408 | 414 | 404 | 393 | 399 |
| Socializing and communication, community participation and religious practice | 110 | 106 | 108 | 94 | 93 | 94 | 106 | 103 | 104 |
| Culture, leisure, mass-media and sports practices | 147 | 136 | 141 | 160 | 149 | 155 | 150 | 139 | 145 |
| Self-care and maintenance | 750 | 748 | 749 | 690 | 688 | 689 | 734 | 733 | 734 |
| Tamil Nadu | |||||||||
| Employment and related activities | 507 | 387 | 459 | 545 | 436 | 514 | 526 | 405 | 484 |
| Production of goods for own final use | 83 | 55 | 62 | 52 | 50 | 51 | 73 | 53 | 59 |
| Unpaid domestic services for household members | 82 | 237 | 201 | 85 | 262 | 216 | 83 | 248 | 209 |
| Unpaid caregiving services for household members | 80 | 141 | 119 | 83 | 147 | 123 | 81 | 144 | 121 |
| Unpaid volunteer, trainee and other unpaid work | 119 | 112 | 115 | 120 | 111 | 114 | 120 | 112 | 115 |
| Learning | 502 | 496 | 499 | 482 | 491 | 486 | 493 | 493 | 493 |
| Socializing and communication, community participation and religious practice | 108 | 107 | 107 | 102 | 106 | 104 | 105 | 106 | 106 |
| Culture, leisure, mass-media and sports practices | 191 | 182 | 187 | 192 | 197 | 194 | 191 | 189 | 190 |
| Self-care and maintenance | 735 | 725 | 730 | 734 | 741 | 738 | 735 | 733 | 734 |
Statement 4.1: Minutes spent in a day on an average per participant of age 6 years and above in the activites of major divisions of TUS activity classification as a major activity (considering only the major activity of the time slots)
| major divisions of TUS activity classification | rural | urban | rural+urban | ||||||
|---|---|---|---|---|---|---|---|---|---|
| male | female | person | male | female | person | male | female | person | |
| (1) | (2) | (3) | (4) | (5) | (6) | (7) | (8) | (9) | (10) |
| Telangana | |||||||||
| Employment and related activities | 469 | 387 | 436 | 526 | 426 | 498 | 492 | 398 | 458 |
| Production of goods for own final use | 60 | 68 | 64 | 37 | 62 | 48 | 55 | 67 | 61 |
| Unpaid domestic services for household members | 80 | 257 | 207 | 80 | 281 | 216 | 80 | 266 | 211 |
| Unpaid caregiving services for household members | 81 | 145 | 120 | 82 | 156 | 125 | 82 | 150 | 122 |
| Unpaid volunteer, trainee and other unpaid work | 100 | 114 | 108 | 144 | 105 | 124 | 118 | 111 | 114 |
| Learning | 445 | 457 | 451 | 472 | 476 | 474 | 458 | 465 | 462 |
| Socializing and communication, community participation and religious practice | 122 | 103 | 112 | 108 | 106 | 107 | 116 | 104 | 110 |
| Culture, leisure, mass-media and sports practices | 165 | 146 | 155 | 177 | 184 | 180 | 170 | 162 | 166 |
| Self-care and maintenance | 731 | 713 | 722 | 705 | 705 | 705 | 720 | 710 | 715 |
| Tripura | |||||||||
| Employment and related activities | 427 | 319 | 405 | 483 | 356 | 456 | 438 | 326 | 415 |
| Production of goods for own final use | 114 | 104 | 107 | 103 | 64 | 78 | 113 | 101 | 105 |
| Unpaid domestic services for household members | 104 | 287 | 238 | 105 | 294 | 244 | 104 | 289 | 239 |
| Unpaid caregiving services for household members | 75 | 141 | 118 | 76 | 145 | 120 | 75 | 142 | 118 |
| Unpaid volunteer, trainee and other unpaid work | 178 | 65 | 142 | 71 | 66 | 68 | 159 | 65 | 123 |
| Learning | 387 | 396 | 392 | 403 | 432 | 417 | 391 | 405 | 398 |
| Socializing and communication, community participation and religious practice | 125 | 135 | 130 | 123 | 135 | 130 | 125 | 135 | 130 |
| Culture, leisure, mass-media and sports practices | 202 | 183 | 192 | 222 | 209 | 215 | 206 | 189 | 197 |
| Self-care and maintenance | 738 | 715 | 726 | 729 | 710 | 719 | 736 | 714 | 725 |
| Uttar Pradesh | |||||||||
| Employment and related activities | 463 | 257 | 422 | 524 | 387 | 505 | 477 | 277 | 439 |
| Production of goods for own final use | 177 | 142 | 160 | 142 | 122 | 131 | 176 | 141 | 159 |
| Unpaid domestic services for household members | 100 | 330 | 277 | 102 | 333 | 279 | 101 | 331 | 277 |
| Unpaid caregiving services for household members | 87 | 147 | 129 | 89 | 153 | 130 | 87 | 148 | 129 |
| Unpaid volunteer, trainee and other unpaid work | 188 | 147 | 170 | 150 | 142 | 147 | 182 | 146 | 167 |
| Learning | 405 | 402 | 403 | 408 | 406 | 407 | 405 | 402 | 404 |
| Socializing and communication, community participation and religious practice | 140 | 145 | 143 | 126 | 134 | 130 | 137 | 142 | 140 |
| Culture, leisure, mass-media and sports practices | 183 | 166 | 175 | 198 | 197 | 198 | 187 | 173 | 180 |
| Self-care and maintenance | 724 | 713 | 718 | 707 | 701 | 704 | 720 | 710 | 715 |
| Uttarakhand | |||||||||
| Employment and related activities | 460 | 311 | 438 | 500 | 395 | 482 | 471 | 339 | 451 |
| Production of goods for own final use | 199 | 205 | 203 | 116 | 79 | 88 | 196 | 198 | 197 |
| Unpaid domestic services for household members | 102 | 279 | 233 | 108 | 300 | 245 | 104 | 285 | 236 |
| Unpaid caregiving services for household members | 67 | 112 | 97 | 68 | 122 | 101 | 68 | 115 | 98 |
| Unpaid volunteer, trainee and other unpaid work | 109 | 131 | 120 | 126 | 76 | 100 | 113 | 116 | 115 |
| Learning | 381 | 390 | 385 | 370 | 388 | 378 | 378 | 390 | 383 |
| Socializing and communication, community participation and religious practice | 120 | 133 | 126 | 106 | 133 | 119 | 116 | 133 | 125 |
| Culture, leisure, mass-media and sports practices | 208 | 181 | 195 | 217 | 216 | 217 | 210 | 190 | 200 |
| Self-care and maintenance | 732 | 708 | 720 | 702 | 683 | 693 | 724 | 701 | 713 |
Statement 4.1: Minutes spent in a day on an average per participant of age 6 years and above in the activites of major divisions of TUS activity classification as a major activity (considering only the major activity of the time slots)
| major divisions of TUS activity classification | rural | urban | rural+urban | ||||||
|---|---|---|---|---|---|---|---|---|---|
| male | female | person | male | female | person | male | female | person | |
| (1) | (2) | (3) | (4) | (5) | (6) | (7) | (8) | (9) | (10) |
| West Bengal | |||||||||
| Employment and related activities | 462 | 297 | 426 | 522 | 372 | 485 | 479 | 322 | 444 |
| Production of goods for own final use | 126 | 85 | 95 | 70 | 58 | 61 | 119 | 81 | 90 |
| Unpaid domestic services for household members | 102 | 311 | 255 | 97 | 299 | 240 | 100 | 308 | 250 |
| Unpaid caregiving services for household members | 80 | 156 | 135 | 86 | 160 | 138 | 81 | 157 | 136 |
| Unpaid volunteer, trainee and other unpaid work | 163 | 116 | 137 | 218 | 144 | 175 | 178 | 124 | 148 |
| Learning | 438 | 456 | 447 | 448 | 435 | 442 | 441 | 450 | 445 |
| Socializing and communication, community participation and religious practice | 138 | 139 | 139 | 126 | 124 | 125 | 135 | 135 | 135 |
| Culture, leisure, mass-media and sports practices | 168 | 147 | 158 | 184 | 176 | 180 | 172 | 156 | 165 |
| Self-care and maintenance | 743 | 739 | 741 | 732 | 741 | 737 | 740 | 740 | 740 |
| A \& N Islands | |||||||||
| Employment and related activities | 510 | 463 | 502 | 560 | 477 | 539 | 527 | 469 | 515 |
| Production of goods for own final use | 164 | 150 | 157 | 153 | 57 | 80 | 163 | 137 | 150 |
| Unpaid domestic services for household members | 115 | 304 | 251 | 106 | 306 | 256 | 112 | 305 | 253 |
| Unpaid caregiving services for household members | 117 | 140 | 133 | 106 | 128 | 121 | 113 | 135 | 128 |
| Unpaid volunteer, trainee and other unpaid work | – | 66 | 66 | – | 30 | 30 | – | 56 | 56 |
| Learning | 404 | 380 | 394 | 383 | 433 | 405 | 394 | 407 | 399 |
| Socializing and communication, community participation and religious practice | 145 | 128 | 136 | 116 | 127 | 122 | 135 | 128 | 131 |
| Culture, leisure, mass-media and sports practices | 198 | 186 | 193 | 222 | 211 | 217 | 207 | 196 | 201 |
| Self-care and maintenance | 725 | 720 | 723 | 730 | 706 | 719 | 727 | 715 | 721 |
| Chandigarh | |||||||||
| Employment and related activities | – | – | – | 527 | 421 | 503 | 527 | 421 | 503 |
| Production of goods for own final use | – | – | – | 60 | 123 | 114 | 60 | 123 | 114 |
| Unpaid domestic services for household members | – | – | – | 124 | 277 | 232 | 124 | 277 | 232 |
| Unpaid caregiving services for household members | – | – | – | 92 | 182 | 145 | 92 | 182 | 145 |
| Unpaid volunteer, trainee and other unpaid work | – | – | – | 150 | – | 150 | 150 | – | 150 |
| Learning | – | – | – | 372 | 370 | 371 | 372 | 370 | 371 |
| Socializing and communication, community participation and religious practice | – | – | – | 87 | 99 | 94 | 87 | 99 | 94 |
| Culture, leisure, mass-media and sports practices | – | – | – | 195 | 207 | 201 | 195 | 207 | 201 |
| Self-care and maintenance | – | – | – | 735 | 711 | 724 | 735 | 711 | 724 |
| Dadra \& Nagar Haveli and Daman \& Diu | |||||||||
| Employment and related activities | 578 | 466 | 537 | 647 | 520 | 614 | 627 | 498 | 589 |
| Production of goods for own final use | 134 | 119 | 123 | 68 | 163 | 104 | 101 | 126 | 118 |
| Unpaid domestic services for household members | 76 | 226 | 190 | 102 | 249 | 191 | 96 | 240 | 191 |
| Unpaid caregiving services for household members | 75 | 102 | 93 | 67 | 150 | 119 | 70 | 130 | 109 |
| Unpaid volunteer, trainee and other unpaid work | 183 | 87 | 116 | 90 | 30 | 60 | 135 | 69 | 94 |
| Learning | 463 | 495 | 479 | 472 | 428 | 452 | 468 | 455 | 462 |
| Socializing and communication, community participation and religious practice | 109 | 104 | 107 | 82 | 118 | 99 | 92 | 113 | 102 |
| Culture, leisure, mass-media and sports practices | 207 | 173 | 191 | 187 | 222 | 202 | 194 | 203 | 198 |
| Self-care and maintenance | 677 | 674 | 676 | 598 | 614 | 605 | 624 | 638 | 630 |
Statement 4.1: Minutes spent in a day on an average per participant of age 6 years and above in the activites of major divisions of TUS activity classification as a major activity (considering only the major activity of the time slots)
| major divisions of TUS activity classification | rural | urban | rural+urban | ||||||
|---|---|---|---|---|---|---|---|---|---|
| male | female | person | male | female | person | male | female | person | |
| (1) | (2) | (3) | (4) | (5) | (6) | (7) | (8) | (9) | (10) |
| Jammu \& Kashmir | |||||||||
| Employment and related activities | 486 | 359 | 477 | 524 | 359 | 491 | 497 | 359 | 481 |
| Production of goods for own final use | 181 | 125 | 149 | 142 | 121 | 131 | 178 | 125 | 147 |
| Unpaid domestic services for household members | 93 | 335 | 274 | 93 | 345 | 301 | 93 | 337 | 281 |
| Unpaid caregiving services for household members | 67 | 132 | 113 | 60 | 115 | 101 | 65 | 128 | 110 |
| Unpaid volunteer, trainee and other unpaid work | 60 | 60 | 60 | 147 | 135 | 60 | 104 | 101 | |
| Learning | 411 | 406 | 409 | 397 | 441 | 417 | 408 | 413 | 411 |
| Socializing and communication, community participation and religious practice | 132 | 130 | 131 | 118 | 129 | 124 | 129 | 130 | 129 |
| Culture, leisure, mass-media and sports practices | 148 | 144 | 146 | 162 | 164 | 163 | 152 | 149 | 150 |
| Self-care and maintenance | 741 | 729 | 735 | 750 | 720 | 735 | 743 | 726 | 735 |
| Ladakh | |||||||||
| Employment and related activities | 487 | 375 | 478 | 501 | 410 | 489 | 488 | 382 | 480 |
| Production of goods for own final use | 129 | 116 | 120 | 118 | 83 | 92 | 128 | 115 | 120 |
| Unpaid domestic services for household members | 96 | 336 | 283 | 112 | 337 | 286 | 98 | 336 | 283 |
| Unpaid caregiving services for household members | 75 | 144 | 119 | 77 | 131 | 110 | 75 | 143 | 118 |
| Unpaid volunteer, trainee and other unpaid work | 30 | 30 | – | – | 30 | 30 | |||
| Learning | 457 | 453 | 455 | 413 | 448 | 426 | 452 | 453 | 452 |
| Socializing and communication, community participation and religious practice | 116 | 117 | 117 | 104 | 122 | 112 | 114 | 118 | 116 |
| Culture, leisure, mass-media and sports practices | 151 | 157 | 154 | 162 | 162 | 162 | 152 | 157 | 155 |
| Self-care and maintenance | 720 | 698 | 709 | 738 | 695 | 719 | 722 | 698 | 710 |
| Lakshadweep | |||||||||
| Employment and related activities | 419 | 274 | 385 | 407 | 288 | 376 | 409 | 285 | 378 |
| Production of goods for own final use | 150 | 79 | 114 | 121 | 93 | 109 | 127 | 89 | 110 |
| Unpaid domestic services for household members | 67 | 216 | 189 | 95 | 268 | 226 | 91 | 258 | 219 |
| Unpaid caregiving services for household members | 103 | 188 | 170 | 86 | 167 | 151 | 91 | 172 | 156 |
| Unpaid volunteer, trainee and other unpaid work | 248 | 122 | 212 | 149 | 116 | 137 | 162 | 116 | 145 |
| Learning | 447 | 416 | 433 | 459 | 425 | 443 | 457 | 424 | 441 |
| Socializing and communication, community participation and religious practice | 250 | 241 | 245 | 202 | 210 | 206 | 212 | 216 | 215 |
| Culture, leisure, mass-media and sports practices | 216 | 154 | 184 | 217 | 182 | 198 | 217 | 176 | 195 |
| Self-care and maintenance | 647 | 676 | 663 | 671 | 665 | 668 | 666 | 667 | 667 |
| Puducherry | |||||||||
| Employment and related activities | 551 | 458 | 522 | 559 | 447 | 523 | 556 | 452 | 523 |
| Production of goods for own final use | 61 | 55 | 57 | 55 | 58 | 57 | 58 | 57 | 57 |
| Unpaid domestic services for household members | 109 | 281 | 227 | 106 | 277 | 231 | 107 | 279 | 230 |
| Unpaid caregiving services for household members | 98 | 187 | 149 | 110 | 160 | 142 | 105 | 169 | 145 |
| Unpaid volunteer, trainee and other unpaid work | 141 | 120 | 130 | 115 | 140 | 130 | 120 | 137 | 130 |
| Learning | 452 | 467 | 459 | 508 | 518 | 513 | 488 | 504 | 496 |
| Socializing and communication, community participation and religious practice | 89 | 83 | 86 | 101 | 96 | 98 | 97 | 91 | 94 |
| Culture, leisure, mass-media and sports practices | 174 | 186 | 180 | 198 | 197 | 197 | 190 | 193 | 192 |
| Self-care and maintenance | 716 | 718 | 717 | 733 | 721 | 726 | 727 | 720 | 723 |
Statement 4.1: Minutes spent in a day on an average per participant of age 6 years and above in the activites of major divisions of TUS activity classification as a major activity (considering only the major activity of the time slots)
| major divisions of TUS activity classification | rural | urban | rural+urban | ||||||
|---|---|---|---|---|---|---|---|---|---|
| male | female | person | male | female | person | male | female | person | |
| (1) | (2) | (3) | (4) | (5) | (6) | (7) | (8) | (9) | (10) |
| All India | |||||||||
| Employment and related activities | 466 | 337 | 432 | 536 | 408 | 508 | 488 | 356 | 455 |
| Production of goods for own final use | 148 | 117 | 129 | 88 | 63 | 70 | 143 | 110 | 123 |
| Unpaid domestic services for household members | 97 | 305 | 257 | 98 | 302 | 249 | 98 | 304 | 255 |
| Unpaid caregiving services for household members | 83 | 140 | 121 | 82 | 147 | 124 | 83 | 142 | 122 |
| Unpaid volunteer, trainee and other unpaid work | 155 | 121 | 136 | 152 | 125 | 137 | 154 | 122 | 136 |
| Learning | 422 | 421 | 422 | 430 | 427 | 429 | 425 | 423 | 424 |
| Socializing and communication, community participation and religious practice | 134 | 131 | 132 | 118 | 123 | 121 | 129 | 129 | 129 |
| Culture, leisure, mass-media and sports practices | 180 | 160 | 170 | 189 | 187 | 188 | 183 | 169 | 176 |
| Self-care and maintenance | 730 | 718 | 724 | 718 | 721 | 719 | 726 | 719 | 723 |
Statement 5.1: Percentage of persons of age 6 years and above participating in a day in activities of major divisions of TUS activity classification irrespective of whether it is a major activity or not (considering all the activities in a time slot)
| major divisions of TUS activity classification | rural | urban | rural+urban | ||||||
|---|---|---|---|---|---|---|---|---|---|
| male | female | person | male | female | person | male | female | person | |
| (1) | (2) | (3) | (4) | (5) | (6) | (7) | (8) | (9) | (10) |
| Andhra Pradesh | |||||||||
| Employment and related activities | 65.7 | 35.6 | 50.5 | 57.9 | 20.5 | 39.2 | 63.2 | 30.7 | 46.8 |
| Production of goods for own final use | 10.4 | 16.5 | 13.5 | 4.3 | 15.2 | 9.7 | 8.4 | 16.1 | 12.3 |
| Unpaid domestic services for household members | 17.5 | 85.0 | 51.6 | 24.2 | 81.4 | 52.9 | 19.7 | 83.8 | 52.0 |
| Unpaid caregiving services for household members | 13.1 | 28.2 | 20.7 | 13.0 | 26.6 | 19.8 | 13.1 | 27.7 | 20.4 |
| Unpaid volunteer, trainee and other unpaid work | 1.1 | 1.0 | 1.1 | 0.7 | 1.1 | 0.9 | 1.0 | 1.0 | 1.0 |
| Learning | 17.4 | 13.6 | 15.5 | 22.1 | 18.5 | 20.3 | 18.9 | 15.2 | 17.1 |
| Socializing and communication, community participation and religious practice | 87.9 | 86.3 | 87.1 | 89.8 | 88.5 | 89.1 | 88.5 | 87.0 | 87.7 |
| Culture, leisure, mass-media and sports practices | 96.7 | 93.8 | 95.2 | 97.0 | 96.3 | 96.7 | 96.8 | 94.6 | 95.7 |
| Self-care and maintenance | 100.0 | 100.0 | 100.0 | 100.0 | 100.0 | 100.0 | 100.0 | 100.0 | 100.0 |
| Arunachal Pradesh | |||||||||
| Employment and related activities | 69.0 | 11.7 | 41.2 | 63.5 | 14.1 | 40.4 | 67.8 | 12.2 | 41.1 |
| Production of goods for own final use | 29.1 | 55.2 | 41.7 | 6.3 | 23.8 | 14.5 | 24.3 | 49.0 | 36.2 |
| Unpaid domestic services for household members | 52.8 | 89.2 | 70.4 | 53.5 | 91.0 | 71.0 | 53.0 | 89.5 | 70.5 |
| Unpaid caregiving services for household members | 35.5 | 65.6 | 50.1 | 20.3 | 56.9 | 37.4 | 32.3 | 63.9 | 47.5 |
| Unpaid volunteer, trainee and other unpaid work | 0.1 | 0.1 | 0.1 | – | – | – | 0.0 | 0.1 | 0.1 |
| Learning | 20.2 | 13.3 | 16.9 | 28.2 | 19.0 | 23.9 | 21.9 | 14.4 | 18.3 |
| Socializing and communication, community participation and religious practice | 79.9 | 79.8 | 79.9 | 87.5 | 84.9 | 86.2 | 81.5 | 80.8 | 81.2 |
| Culture, leisure, mass-media and sports practices | 98.9 | 95.1 | 97.1 | 99.2 | 96.4 | 97.9 | 99.0 | 95.4 | 97.3 |
| Self-care and maintenance | 100.0 | 100.0 | 100.0 | 100.0 | 100.0 | 100.0 | 100.0 | 100.0 | 100.0 |
| Assam | |||||||||
| Employment and related activities | 64.0 | 12.8 | 38.7 | 59.7 | 13.2 | 38.0 | 63.5 | 12.8 | 38.6 |
| Production of goods for own final use | 17.2 | 27.3 | 22.2 | 4.5 | 8.5 | 6.3 | 15.7 | 25.3 | 20.4 |
| Unpaid domestic services for household members | 33.7 | 80.9 | 57.0 | 39.5 | 80.5 | 58.6 | 34.4 | 80.9 | 57.2 |
| Unpaid caregiving services for household members | 23.3 | 39.4 | 31.3 | 18.3 | 33.0 | 25.1 | 22.7 | 38.7 | 30.6 |
| Unpaid volunteer, trainee and other unpaid work | 0.2 | 0.3 | 0.3 | 0.1 | 0.3 | 0.2 | 0.2 | 0.3 | 0.2 |
| Learning | 23.8 | 22.4 | 23.1 | 24.6 | 21.2 | 23.0 | 23.9 | 22.2 | 23.1 |
| Socializing and communication, community participation and religious practice | 90.5 | 93.2 | 91.8 | 89.1 | 93.4 | 91.1 | 90.3 | 93.2 | 91.7 |
| Culture, leisure, mass-media and sports practices | 97.6 | 93.8 | 95.7 | 99.1 | 98.5 | 98.8 | 97.8 | 94.3 | 96.1 |
| Self-care and maintenance | 100.0 | 100.0 | 100.0 | 100.0 | 100.0 | 100.0 | 100.0 | 100.0 | 100.0 |
| Bihar | |||||||||
| Employment and related activities | 54.7 | 10.9 | 32.8 | 54.5 | 8.6 | 32.7 | 54.7 | 10.6 | 32.8 |
| Production of goods for own final use | 14.4 | 15.1 | 14.7 | 2.6 | 4.7 | 3.6 | 13.1 | 14.0 | 13.5 |
| Unpaid domestic services for household members | 27.9 | 77.2 | 52.5 | 31.5 | 77.7 | 53.4 | 28.3 | 77.2 | 52.6 |
| Unpaid caregiving services for household members | 20.9 | 39.6 | 30.2 | 17.5 | 36.3 | 26.5 | 20.5 | 39.3 | 29.8 |
| Unpaid volunteer, trainee and other unpaid work | 0.3 | 0.5 | 0.4 | 0.2 | 0.3 | 0.3 | 0.3 | 0.5 | 0.4 |
| Learning | 33.4 | 28.6 | 31.0 | 34.1 | 28.2 | 31.3 | 33.5 | 28.6 | 31.0 |
| Socializing and communication, community participation and religious practice | 83.8 | 87.9 | 85.9 | 87.4 | 90.5 | 88.9 | 84.2 | 88.2 | 86.2 |
| Culture, leisure, mass-media and sports practices | 93.8 | 84.7 | 89.3 | 97.0 | 93.8 | 95.5 | 94.2 | 85.7 | 90.0 |
| Self-care and maintenance | 100.0 | 100.0 | 100.0 | 100.0 | 100.0 | 100.0 | 100.0 | 100.0 | 100.0 |
Statement 5.1: Percentage of persons of age 6 years and above participating in a day in activities of major divisions of TUS activity classification irrespective of whether it is a major activity or not (considering all the activities in a time slot)
| major divisions of TUS activity classification | rural | urban | rural+urban | ||||||
|---|---|---|---|---|---|---|---|---|---|
| male | female | person | male | female | person | male | female | person | |
| (1) | (2) | (3) | (4) | (5) | (6) | (7) | (8) | (9) | (10) |
| Chhattisgarh | |||||||||
| Employment and related activities | 56.1 | 30.6 | 43.3 | 60.1 | 23.0 | 41.5 | 57.0 | 28.9 | 42.9 |
| Production of goods for own final use | 20.5 | 29.3 | 24.9 | 3.0 | 12.2 | 7.7 | 16.6 | 25.5 | 21.1 |
| Unpaid domestic services for household members | 22.5 | 80.0 | 51.4 | 22.9 | 74.9 | 48.9 | 22.6 | 78.8 | 50.9 |
| Unpaid caregiving services for household members | 19.6 | 30.5 | 25.1 | 16.7 | 31.2 | 24.0 | 18.9 | 30.7 | 24.8 |
| Unpaid volunteer, trainee and other unpaid work | 0.6 | 1.0 | 0.8 | 0.7 | 0.6 | 0.7 | 0.6 | 0.9 | 0.8 |
| Learning | 19.9 | 20.9 | 20.4 | 23.7 | 26.0 | 24.8 | 20.8 | 22.0 | 21.4 |
| Socializing and communication, community participation and religious practice | 90.3 | 88.5 | 89.4 | 90.6 | 89.3 | 89.9 | 90.4 | 88.6 | 89.5 |
| Culture, leisure, mass-media and sports practices | 93.0 | 86.8 | 89.9 | 95.7 | 95.1 | 95.4 | 93.6 | 88.6 | 91.1 |
| Self-care and maintenance | 100.0 | 100.0 | 100.0 | 100.0 | 100.0 | 100.0 | 100.0 | 100.0 | 100.0 |
| Delhi | |||||||||
| Employment and related activities | 79.8 | 14.8 | 53.4 | 70.0 | 11.3 | 44.2 | 70.5 | 11.5 | 44.7 |
| Production of goods for own final use | – | – | – | 0.1 | 0.4 | 0.2 | 0.1 | 0.4 | 0.2 |
| Unpaid domestic services for household members | 40.9 | 85.7 | 59.2 | 32.2 | 79.5 | 53.0 | 32.7 | 79.8 | 53.3 |
| Unpaid caregiving services for household members | 24.3 | 45.8 | 32.9 | 19.1 | 36.0 | 26.5 | 19.4 | 36.5 | 26.9 |
| Unpaid volunteer, trainee and other unpaid work | – | – | – | 0.3 | 0.1 | 0.2 | 0.3 | 0.1 | 0.2 |
| Learning | 9.9 | 23.3 | 15.3 | 18.5 | 21.1 | 19.7 | 18.1 | 21.2 | 19.5 |
| Socializing and communication, community participation and religious practice | 91.1 | 87.8 | 89.8 | 88.6 | 88.2 | 88.5 | 88.8 | 88.2 | 88.5 |
| Culture, leisure, mass-media and sports practices | 89.9 | 89.5 | 89.8 | 92.3 | 92.4 | 92.4 | 92.2 | 92.3 | 92.2 |
| Self-care and maintenance | 100.0 | 100.0 | 100.0 | 100.0 | 100.0 | 100.0 | 100.0 | 100.0 | 100.0 |
| Goa | |||||||||
| Employment and related activities | 59.3 | 20.5 | 39.4 | 67.2 | 28.3 | 48.2 | 64.2 | 25.2 | 44.7 |
| Production of goods for own final use | 7.0 | 9.6 | 8.3 | 3.9 | 3.0 | 3.5 | 5.0 | 5.7 | 5.4 |
| Unpaid domestic services for household members | 27.3 | 74.2 | 51.4 | 28.1 | 65.7 | 46.5 | 27.8 | 69.1 | 48.4 |
| Unpaid caregiving services for household members | 10.9 | 20.9 | 16.1 | 15.8 | 22.5 | 19.1 | 13.9 | 21.9 | 17.9 |
| Unpaid volunteer, trainee and other unpaid work | – | – | – | 0.5 | – | 0.2 | 0.3 | – | 0.1 |
| Learning | 13.6 | 17.2 | 15.4 | 18.5 | 18.4 | 18.4 | 16.6 | 17.9 | 17.3 |
| Socializing and communication, community participation and religious practice | 85.0 | 90.3 | 87.7 | 86.8 | 92.3 | 89.5 | 86.1 | 91.5 | 88.8 |
| Culture, leisure, mass-media and sports practices | 95.7 | 97.0 | 96.3 | 92.7 | 99.4 | 96.0 | 93.8 | 98.4 | 96.1 |
| Self-care and maintenance | 100.0 | 100.0 | 100.0 | 100.0 | 100.0 | 100.0 | 100.0 | 100.0 | 100.0 |
| Gujarat | |||||||||
| Employment and related activities | 69.1 | 32.8 | 51.3 | 64.9 | 19.6 | 43.6 | 67.2 | 27.1 | 47.9 |
| Production of goods for own final use | 7.1 | 22.0 | 14.5 | 1.1 | 8.2 | 4.5 | 4.4 | 16.1 | 10.1 |
| Unpaid domestic services for household members | 10.3 | 83.3 | 46.2 | 18.3 | 83.4 | 49.0 | 13.9 | 83.3 | 47.4 |
| Unpaid caregiving services for household members | 16.9 | 31.7 | 24.2 | 16.3 | 30.0 | 22.7 | 16.6 | 31.0 | 23.5 |
| Unpaid volunteer, trainee and other unpaid work | 0.7 | 0.5 | 0.6 | 0.4 | 1.1 | 0.7 | 0.5 | 0.8 | 0.6 |
| Learning | 17.8 | 14.9 | 16.4 | 16.4 | 15.5 | 16.0 | 17.2 | 15.1 | 16.2 |
| Socializing and communication, community participation and religious practice | 95.6 | 96.3 | 95.9 | 94.0 | 95.9 | 94.9 | 94.9 | 96.1 | 95.5 |
| Culture, leisure, mass-media and sports practices | 96.0 | 89.2 | 92.7 | 96.6 | 92.9 | 94.9 | 96.3 | 90.8 | 93.6 |
| Self-care and maintenance | 100.0 | 100.0 | 100.0 | 100.0 | 100.0 | 100.0 | 100.0 | 100.0 | 100.0 |
Statement 5.1: Percentage of persons of age 6 years and above participating in a day in activities of major divisions of TUS activity classification irrespective of whether it is a major activity or not (considering all the activities in a time slot)
| major divisions of TUS activity classification | rural | urban | rural+urban | ||||||
|---|---|---|---|---|---|---|---|---|---|
| male | female | person | male | female | person | male | female | person | |
| (1) | (2) | (3) | (4) | (5) | (6) | (7) | (8) | (9) | (10) |
| Haryana | |||||||||
| Employment and related activities | 57.4 | 14.2 | 36.4 | 64.1 | 13.7 | 41.0 | 60.6 | 14.0 | 38.5 |
| Production of goods for own final use | 19.2 | 25.8 | 22.4 | 1.6 | 3.2 | 2.3 | 10.9 | 15.8 | 13.2 |
| Unpaid domestic services for household members | 17.7 | 79.0 | 47.5 | 29.6 | 77.8 | 51.6 | 23.3 | 78.4 | 49.4 |
| Unpaid caregiving services for household members | 16.3 | 34.1 | 24.9 | 21.8 | 39.2 | 29.7 | 18.9 | 36.4 | 27.1 |
| Unpaid volunteer, trainee and other unpaid work | 0.4 | 0.4 | 0.4 | 1.7 | 0.1 | 1.0 | 1.1 | 0.3 | 0.7 |
| Learning | 26.6 | 22.6 | 24.7 | 21.8 | 22.1 | 22.0 | 24.3 | 22.4 | 23.4 |
| Socializing and communication, community participation and religious practice | 88.7 | 89.7 | 89.2 | 89.5 | 91.2 | 90.3 | 89.1 | 90.4 | 89.7 |
| Culture, leisure, mass-media and sports practices | 97.8 | 94.9 | 96.3 | 97.0 | 97.3 | 97.1 | 97.4 | 96.0 | 96.7 |
| Self-care and maintenance | 100.0 | 100.0 | 100.0 | 100.0 | 100.0 | 100.0 | 100.0 | 100.0 | 100.0 |
| Himachal Pradesh | |||||||||
| Employment and related activities | 53.8 | 16.6 | 34.4 | 65.8 | 22.9 | 45.0 | 55.3 | 17.3 | 35.7 |
| Production of goods for own final use | 31.1 | 49.9 | 40.9 | 3.5 | 5.1 | 4.3 | 27.5 | 44.8 | 36.4 |
| Unpaid domestic services for household members | 23.3 | 83.9 | 54.9 | 36.5 | 79.1 | 57.1 | 25.1 | 83.3 | 55.2 |
| Unpaid caregiving services for household members | 15.3 | 33.2 | 24.6 | 20.6 | 32.8 | 26.5 | 16.0 | 33.2 | 24.9 |
| Unpaid volunteer, trainee and other unpaid work | 1.1 | 1.3 | 1.2 | 0.7 | 0.9 | 0.8 | 1.1 | 1.3 | 1.2 |
| Learning | 21.7 | 18.7 | 20.1 | 20.9 | 22.7 | 21.7 | 21.6 | 19.2 | 20.3 |
| Socializing and communication, community participation and religious practice | 86.5 | 84.7 | 85.6 | 87.4 | 88.1 | 87.7 | 86.6 | 85.1 | 85.8 |
| Culture, leisure, mass-media and sports practices | 98.7 | 97.3 | 98.0 | 99.2 | 98.3 | 98.8 | 98.8 | 97.4 | 98.1 |
| Self-care and maintenance | 100.0 | 100.0 | 100.0 | 100.0 | 100.0 | 100.0 | 100.0 | 100.0 | 100.0 |
| Jharkhand | |||||||||
| Employment and related activities | 56.7 | 19.6 | 38.1 | 57.1 | 14.9 | 36.5 | 56.8 | 18.8 | 37.8 |
| Production of goods for own final use | 25.6 | 41.1 | 33.4 | 6.1 | 9.7 | 7.8 | 21.8 | 35.2 | 28.5 |
| Unpaid domestic services for household members | 29.2 | 81.9 | 55.7 | 35.2 | 81.3 | 57.7 | 30.4 | 81.8 | 56.1 |
| Unpaid caregiving services for household members | 22.7 | 38.6 | 30.7 | 15.4 | 31.6 | 23.3 | 21.2 | 37.3 | 29.3 |
| Unpaid volunteer, trainee and other unpaid work | 0.5 | 1.3 | 0.9 | 0.6 | 1.1 | 0.8 | 0.5 | 1.3 | 0.9 |
| Learning | 27.9 | 24.4 | 26.1 | 30.7 | 27.3 | 29.0 | 28.5 | 24.9 | 26.7 |
| Socializing and communication, community participation and religious practice | 88.1 | 89.7 | 88.9 | 85.3 | 89.7 | 87.5 | 87.6 | 89.7 | 88.7 |
| Culture, leisure, mass-media and sports practices | 93.0 | 84.8 | 88.8 | 95.0 | 94.0 | 94.5 | 93.4 | 86.5 | 89.9 |
| Self-care and maintenance | 100.0 | 100.0 | 100.0 | 100.0 | 100.0 | 100.0 | 100.0 | 100.0 | 100.0 |
| Karnataka | |||||||||
| Employment and related activities | 69.9 | 28.3 | 49.0 | 63.7 | 21.8 | 43.9 | 67.3 | 25.8 | 47.0 |
| Production of goods for own final use | 15.4 | 13.6 | 14.5 | 2.9 | 5.5 | 4.1 | 10.2 | 10.5 | 10.4 |
| Unpaid domestic services for household members | 25.3 | 84.2 | 54.9 | 28.7 | 80.2 | 53.1 | 26.7 | 82.7 | 54.2 |
| Unpaid caregiving services for household members | 19.8 | 37.0 | 28.4 | 18.6 | 35.1 | 26.4 | 19.3 | 36.3 | 27.6 |
| Unpaid volunteer, trainee and other unpaid work | 0.6 | 1.5 | 1.1 | 0.8 | 1.3 | 1.0 | 0.7 | 1.4 | 1.1 |
| Learning | 17.9 | 16.1 | 17.0 | 21.1 | 19.9 | 20.5 | 19.2 | 17.5 | 18.4 |
| Socializing and communication, community participation and religious practice | 95.6 | 95.0 | 95.3 | 96.0 | 95.5 | 95.7 | 95.7 | 95.2 | 95.5 |
| Culture, leisure, mass-media and sports practices | 97.5 | 95.1 | 96.3 | 97.6 | 96.4 | 97.0 | 97.6 | 95.6 | 96.6 |
| Self-care and maintenance | 100.0 | 100.0 | 100.0 | 100.0 | 100.0 | 100.0 | 100.0 | 100.0 | 100.0 |
Statement 5.1: Percentage of persons of age 6 years and above participating in a day in activities of major divisions of TUS activity classification irrespective of whether it is a major activity or not (considering all the activities in a time slot)
| major divisions of TUS activity classification | rural | urban | rural+urban | ||||||
|---|---|---|---|---|---|---|---|---|---|
| male | female | person | male | female | person | male | female | person | |
| (1) | (2) | (3) | (4) | (5) | (6) | (7) | (8) | (9) | (10) |
| Kerala | |||||||||
| Employment and related activities | 49.6 | 20.4 | 34.1 | 50.1 | 19.9 | 34.0 | 49.8 | 20.2 | 34.0 |
| Production of goods for own final use | 8.7 | 11.9 | 10.4 | 6.3 | 8.2 | 7.3 | 7.5 | 10.1 | 8.9 |
| Unpaid domestic services for household members | 42.4 | 84.4 | 64.7 | 43.6 | 82.1 | 64.1 | 43.0 | 83.3 | 64.4 |
| Unpaid caregiving services for household members | 18.1 | 31.0 | 25.0 | 16.1 | 29.2 | 23.1 | 17.2 | 30.2 | 24.1 |
| Unpaid volunteer, trainee and other unpaid work | 3.7 | 5.1 | 4.4 | 3.8 | 5.3 | 4.6 | 3.7 | 5.2 | 4.5 |
| Learning | 17.7 | 18.8 | 18.3 | 18.6 | 20.5 | 19.6 | 18.1 | 19.6 | 18.9 |
| Socializing and communication, community participation and religious practice | 96.4 | 97.1 | 96.8 | 92.7 | 93.9 | 93.4 | 94.7 | 95.6 | 95.1 |
| Culture, leisure, mass-media and sports practices | 99.0 | 96.6 | 97.7 | 98.2 | 96.1 | 97.1 | 98.6 | 96.4 | 97.4 |
| Self-care and maintenance | 100.0 | 100.0 | 100.0 | 100.0 | 100.0 | 100.0 | 100.0 | 100.0 | 100.0 |
| Madhya Pradesh | |||||||||
| Employment and related activities | 64.4 | 24.2 | 45.0 | 62.3 | 14.7 | 39.2 | 63.8 | 21.4 | 43.3 |
| Production of goods for own final use | 32.2 | 45.1 | 38.4 | 8.4 | 17.4 | 12.8 | 25.3 | 37.1 | 31.0 |
| Unpaid domestic services for household members | 25.1 | 84.8 | 53.9 | 23.5 | 81.7 | 51.8 | 24.6 | 83.9 | 53.3 |
| Unpaid caregiving services for household members | 20.6 | 36.7 | 28.3 | 19.1 | 33.5 | 26.1 | 20.1 | 35.8 | 27.7 |
| Unpaid volunteer, trainee and other unpaid work | 1.1 | 1.4 | 1.3 | 0.7 | 0.9 | 0.8 | 1.0 | 1.3 | 1.1 |
| Learning | 18.8 | 15.6 | 17.2 | 22.6 | 20.3 | 21.5 | 19.9 | 16.9 | 18.5 |
| Socializing and communication, community participation and religious practice | 90.7 | 87.5 | 89.1 | 86.1 | 89.3 | 87.7 | 89.4 | 88.0 | 88.7 |
| Culture, leisure, mass-media and sports practices | 94.7 | 86.0 | 90.5 | 96.6 | 95.2 | 95.9 | 95.2 | 88.6 | 92.0 |
| Self-care and maintenance | 100.0 | 100.0 | 100.0 | 100.0 | 100.0 | 100.0 | 100.0 | 100.0 | 100.0 |
| Maharashtra | |||||||||
| Employment and related activities | 66.3 | 35.7 | 51.3 | 63.2 | 19.1 | 42.2 | 65.0 | 28.7 | 47.4 |
| Production of goods for own final use | 8.9 | 18.7 | 13.7 | 2.0 | 14.3 | 7.9 | 5.9 | 16.8 | 11.2 |
| Unpaid domestic services for household members | 22.7 | 85.4 | 53.4 | 21.1 | 82.8 | 50.5 | 22.0 | 84.3 | 52.2 |
| Unpaid caregiving services for household members | 16.6 | 29.9 | 23.1 | 15.7 | 29.5 | 22.2 | 16.2 | 29.7 | 22.7 |
| Unpaid volunteer, trainee and other unpaid work | 0.8 | 0.9 | 0.9 | 0.6 | 0.8 | 0.7 | 0.7 | 0.9 | 0.8 |
| Learning | 19.6 | 16.5 | 18.1 | 18.2 | 17.8 | 18.0 | 19.0 | 17.1 | 18.1 |
| Socializing and communication, community participation and religious practice | 93.0 | 90.4 | 91.7 | 88.7 | 90.4 | 89.5 | 91.1 | 90.4 | 90.8 |
| Culture, leisure, mass-media and sports practices | 94.8 | 85.8 | 90.4 | 97.3 | 96.1 | 96.7 | 95.9 | 90.2 | 93.1 |
| Self-care and maintenance | 100.0 | 100.0 | 100.0 | 100.0 | 100.0 | 100.0 | 100.0 | 100.0 | 100.0 |
| Manipur | |||||||||
| Employment and related activities | 56.9 | 32.2 | 44.9 | 57.0 | 38.5 | 47.6 | 56.9 | 34.2 | 45.7 |
| Production of goods for own final use | 20.5 | 30.7 | 25.5 | 13.7 | 18.7 | 16.3 | 18.5 | 26.9 | 22.6 |
| Unpaid domestic services for household members | 27.6 | 78.3 | 52.3 | 38.2 | 79.2 | 59.1 | 30.8 | 78.6 | 54.4 |
| Unpaid caregiving services for household members | 32.2 | 41.0 | 36.5 | 33.4 | 40.8 | 37.2 | 32.6 | 40.9 | 36.7 |
| Unpaid volunteer, trainee and other unpaid work | 0.7 | 0.8 | 0.7 | 0.5 | 0.3 | 0.4 | 0.6 | 0.6 | 0.6 |
| Learning | 30.0 | 24.3 | 27.2 | 28.8 | 24.2 | 26.4 | 29.6 | 24.3 | 27.0 |
| Socializing and communication, community participation and religious practice | 93.9 | 94.5 | 94.2 | 92.5 | 96.0 | 94.3 | 93.5 | 95.0 | 94.2 |
| Culture, leisure, mass-media and sports practices | 98.9 | 94.4 | 96.7 | 98.3 | 94.3 | 96.3 | 98.7 | 94.4 | 96.6 |
| Self-care and maintenance | 100.0 | 100.0 | 100.0 | 100.0 | 100.0 | 100.0 | 100.0 | 100.0 | 100.0 |
Statement 5.1: Percentage of persons of age 6 years and above participating in a day in activities of major divisions of TUS activity classification irrespective of whether it is a major activity or not (considering all the activities in a time slot)
| major divisions of TUS activity classification | rural | urban | rural+urban | ||||||
|---|---|---|---|---|---|---|---|---|---|
| male | female | person | male | female | person | male | female | person | |
| (1) | (2) | (3) | (4) | (5) | (6) | (7) | (8) | (9) | (10) |
| Meghalaya | |||||||||
| Employment and related activities | 51.5 | 18.2 | 34.3 | 54.8 | 17.5 | 35.1 | 52.1 | 18.1 | 34.5 |
| Production of goods for own final use | 11.6 | 10.0 | 10.8 | 7.6 | 6.0 | 6.8 | 10.9 | 9.3 | 10.0 |
| Unpaid domestic services for household members | 40.1 | 82.0 | 61.7 | 42.8 | 81.9 | 63.4 | 40.6 | 82.0 | 62.0 |
| Unpaid caregiving services for household members | 17.8 | 46.5 | 32.6 | 13.8 | 31.0 | 22.9 | 17.1 | 43.6 | 30.8 |
| Unpaid volunteer, trainee and other unpaid work | 0.1 | 0.3 | 0.2 | 0.1 | – | 0.0 | 0.1 | 0.3 | 0.2 |
| Learning | 24.2 | 21.8 | 22.9 | 25.6 | 28.6 | 27.2 | 24.4 | 23.1 | 23.7 |
| Socializing and communication, community participation and religious practice | 84.7 | 84.1 | 84.4 | 80.7 | 79.9 | 80.3 | 84.0 | 83.3 | 83.6 |
| Culture, leisure, mass-media and sports practices | 89.2 | 85.7 | 87.4 | 93.8 | 92.7 | 93.2 | 90.1 | 87.0 | 88.5 |
| Self-care and maintenance | 100.0 | 100.0 | 100.0 | 100.0 | 100.0 | 100.0 | 100.0 | 100.0 | 100.0 |
| Mizoram | |||||||||
| Employment and related activities | 69.0 | 30.6 | 50.4 | 60.0 | 21.7 | 40.8 | 65.1 | 26.6 | 46.1 |
| Production of goods for own final use | 27.2 | 31.4 | 29.2 | 3.9 | 9.6 | 6.8 | 17.1 | 21.6 | 19.3 |
| Unpaid domestic services for household members | 34.6 | 91.2 | 62.1 | 37.1 | 89.5 | 63.4 | 35.7 | 90.5 | 62.7 |
| Unpaid caregiving services for household members | 28.5 | 54.2 | 41.0 | 31.4 | 53.2 | 42.4 | 29.7 | 53.8 | 41.6 |
| Unpaid volunteer, trainee and other unpaid work | 0.8 | 0.7 | 0.8 | 1.0 | 0.4 | 0.7 | 0.9 | 0.6 | 0.7 |
| Learning | 13.0 | 11.9 | 12.4 | 20.4 | 15.2 | 17.7 | 16.2 | 13.3 | 14.8 |
| Socializing and communication, community participation and religious practice | 83.5 | 75.4 | 79.6 | 85.5 | 76.3 | 80.9 | 84.3 | 75.8 | 80.1 |
| Culture, leisure, mass-media and sports practices | 94.9 | 86.3 | 90.8 | 94.8 | 89.2 | 92.0 | 94.9 | 87.6 | 91.3 |
| Self-care and maintenance | 100.0 | 100.0 | 100.0 | 100.0 | 100.0 | 100.0 | 100.0 | 100.0 | 100.0 |
| Nagaland | |||||||||
| Employment and related activities | 20.6 | 7.8 | 14.3 | 39.1 | 15.3 | 27.6 | 27.0 | 10.4 | 18.9 |
| Production of goods for own final use | 56.8 | 54.3 | 55.5 | 22.2 | 17.9 | 20.1 | 44.8 | 42.0 | 43.4 |
| Unpaid domestic services for household members | 52.2 | 86.0 | 68.8 | 51.6 | 84.7 | 67.7 | 52.0 | 85.6 | 68.4 |
| Unpaid caregiving services for household members | 30.7 | 41.1 | 35.8 | 31.2 | 43.6 | 37.2 | 30.9 | 41.9 | 36.3 |
| Unpaid volunteer, trainee and other unpaid work | 3.3 | 3.6 | 3.5 | 2.9 | 1.9 | 2.4 | 3.1 | 3.0 | 3.1 |
| Learning | 16.6 | 17.3 | 17.0 | 26.2 | 25.4 | 25.8 | 19.9 | 20.0 | 20.0 |
| Socializing and communication, community participation and religious practice | 87.3 | 86.5 | 86.9 | 88.9 | 85.7 | 87.4 | 87.9 | 86.2 | 87.1 |
| Culture, leisure, mass-media and sports practices | 99.2 | 97.4 | 98.3 | 98.2 | 96.6 | 97.4 | 98.8 | 97.1 | 98.0 |
| Self-care and maintenance | 100.0 | 100.0 | 100.0 | 100.0 | 100.0 | 100.0 | 100.0 | 100.0 | 100.0 |
| Odisha | |||||||||
| Employment and related activities | 56.2 | 15.2 | 35.3 | 59.2 | 13.6 | 35.6 | 56.7 | 14.9 | 35.4 |
| Production of goods for own final use | 19.6 | 38.1 | 29.0 | 3.8 | 11.9 | 8.0 | 17.0 | 33.7 | 25.5 |
| Unpaid domestic services for household members | 24.0 | 79.5 | 52.3 | 31.4 | 78.5 | 55.8 | 25.2 | 79.3 | 52.8 |
| Unpaid caregiving services for household members | 15.8 | 32.8 | 24.4 | 15.7 | 30.5 | 23.4 | 15.8 | 32.4 | 24.3 |
| Unpaid volunteer, trainee and other unpaid work | 1.5 | 2.0 | 1.7 | 1.6 | 1.9 | 1.7 | 1.5 | 2.0 | 1.7 |
| Learning | 21.5 | 19.1 | 20.3 | 22.3 | 25.2 | 23.8 | 21.6 | 20.1 | 20.8 |
| Socializing and communication, community participation and religious practice | 90.0 | 93.2 | 91.6 | 87.3 | 92.7 | 90.1 | 89.6 | 93.1 | 91.4 |
| Culture, leisure, mass-media and sports practices | 96.5 | 91.7 | 94.1 | 96.5 | 96.0 | 96.3 | 96.5 | 92.4 | 94.4 |
| Self-care and maintenance | 100.0 | 100.0 | 100.0 | 100.0 | 100.0 | 100.0 | 100.0 | 100.0 | 100.0 |
Statement 5.1: Percentage of persons of age 6 years and above participating in a day in activities of major divisions of TUS activity classification irrespective of whether it is a major activity or not (considering all the activities in a time slot)
| major divisions of TUS activity classification | rural | urban | rural+urban | ||||||
|---|---|---|---|---|---|---|---|---|---|
| male | female | person | male | female | person | male | female | person | |
| (1) | (2) | (3) | (4) | (5) | (6) | (7) | (8) | (9) | (10) |
| Punjab | |||||||||
| Employment and related activities | 64.2 | 19.9 | 43.2 | 64.7 | 19.1 | 43.3 | 64.4 | 19.6 | 43.2 |
| Production of goods for own final use | 10.5 | 12.9 | 11.6 | 1.8 | 2.0 | 1.9 | 7.0 | 8.6 | 7.7 |
| Unpaid domestic services for household members | 25.6 | 81.8 | 52.3 | 29.4 | 82.3 | 54.3 | 27.2 | 82.0 | 53.1 |
| Unpaid caregiving services for household members | 15.6 | 30.3 | 22.6 | 19.0 | 32.4 | 25.3 | 17.0 | 31.1 | 23.7 |
| Unpaid volunteer, trainee and other unpaid work | 1.0 | 0.9 | 1.0 | 0.7 | 0.9 | 0.8 | 0.9 | 0.9 | 0.9 |
| Learning | 20.2 | 19.0 | 19.6 | 19.9 | 21.4 | 20.6 | 20.1 | 20.0 | 20.0 |
| Socializing and communication, community participation and religious practice | 93.6 | 94.3 | 93.9 | 94.4 | 93.8 | 94.1 | 93.9 | 94.1 | 94.0 |
| Culture, leisure, mass-media and sports practices | 97.5 | 96.5 | 97.0 | 96.2 | 96.0 | 96.1 | 97.0 | 96.3 | 96.7 |
| Self-care and maintenance | 100.0 | 100.0 | 100.0 | 100.0 | 100.0 | 100.0 | 100.0 | 100.0 | 100.0 |
| Rajasthan | |||||||||
| Employment and related activities | 53.0 | 27.2 | 39.7 | 59.9 | 16.3 | 39.3 | 54.9 | 24.5 | 39.6 |
| Production of goods for own final use | 24.2 | 44.7 | 34.8 | 2.8 | 8.5 | 5.5 | 18.2 | 35.7 | 27.0 |
| Unpaid domestic services for household members | 27.4 | 82.7 | 55.9 | 29.6 | 79.8 | 53.3 | 28.0 | 82.0 | 55.2 |
| Unpaid caregiving services for household members | 18.5 | 34.2 | 26.6 | 15.6 | 32.6 | 23.6 | 17.7 | 33.8 | 25.8 |
| Unpaid volunteer, trainee and other unpaid work | 0.9 | 0.8 | 0.9 | 0.7 | 1.1 | 0.9 | 0.8 | 0.9 | 0.9 |
| Learning | 26.5 | 22.1 | 24.2 | 25.5 | 23.4 | 24.5 | 26.3 | 22.4 | 24.3 |
| Socializing and communication, community participation and religious practice | 94.1 | 94.1 | 94.1 | 92.6 | 95.0 | 93.7 | 93.7 | 94.3 | 94.0 |
| Culture, leisure, mass-media and sports practices | 93.8 | 82.2 | 87.8 | 96.2 | 92.5 | 94.5 | 94.5 | 84.8 | 89.6 |
| Self-care and maintenance | 100.0 | 100.0 | 100.0 | 100.0 | 100.0 | 100.0 | 100.0 | 100.0 | 100.0 |
| Sikkim | |||||||||
| Employment and related activities | 65.5 | 25.7 | 46.1 | 65.3 | 28.5 | 48.4 | 65.5 | 26.4 | 46.7 |
| Production of goods for own final use | 22.4 | 19.1 | 20.8 | 1.5 | 2.5 | 2.0 | 16.9 | 15.1 | 16.1 |
| Unpaid domestic services for household members | 56.8 | 88.4 | 72.2 | 61.2 | 92.8 | 75.8 | 58.0 | 89.5 | 73.1 |
| Unpaid caregiving services for household members | 26.3 | 38.0 | 32.0 | 20.7 | 35.1 | 27.3 | 24.9 | 37.3 | 30.8 |
| Unpaid volunteer, trainee and other unpaid work | 0.9 | 0.2 | 0.6 | – | 0.5 | 0.2 | 0.7 | 0.3 | 0.5 |
| Learning | 18.5 | 18.7 | 18.6 | 21.6 | 22.2 | 21.9 | 19.3 | 19.5 | 19.4 |
| Socializing and communication, community participation and religious practice | 90.9 | 89.7 | 90.3 | 81.7 | 83.2 | 82.4 | 88.5 | 88.2 | 88.3 |
| Culture, leisure, mass-media and sports practices | 97.6 | 94.8 | 96.2 | 97.6 | 97.1 | 97.4 | 97.6 | 95.4 | 96.5 |
| Self-care and maintenance | 100.0 | 100.0 | 100.0 | 100.0 | 100.0 | 100.0 | 100.0 | 100.0 | 100.0 |
| Tamil Nadu | |||||||||
| Employment and related activities | 62.6 | 37.9 | 49.7 | 63.6 | 25.4 | 44.4 | 63.1 | 32.0 | 47.1 |
| Production of goods for own final use | 9.4 | 24.8 | 17.4 | 4.6 | 10.5 | 7.6 | 7.0 | 18.1 | 12.7 |
| Unpaid domestic services for household members | 28.1 | 82.9 | 56.8 | 31.1 | 82.0 | 56.8 | 29.6 | 82.5 | 56.8 |
| Unpaid caregiving services for household members | 16.8 | 25.6 | 21.4 | 19.0 | 30.8 | 24.9 | 17.9 | 28.0 | 23.1 |
| Unpaid volunteer, trainee and other unpaid work | 2.4 | 3.8 | 3.2 | 1.9 | 3.0 | 2.5 | 2.2 | 3.5 | 2.8 |
| Learning | 18.0 | 15.9 | 16.9 | 16.3 | 15.7 | 16.0 | 17.2 | 15.8 | 16.5 |
| Socializing and communication, community participation and religious practice | 96.0 | 95.3 | 95.6 | 93.9 | 92.3 | 93.1 | 95.0 | 93.9 | 94.4 |
| Culture, leisure, mass-media and sports practices | 98.6 | 98.1 | 98.4 | 98.2 | 97.8 | 98.0 | 98.4 | 98.0 | 98.2 |
| Self-care and maintenance | 100.0 | 100.0 | 100.0 | 100.0 | 100.0 | 100.0 | 100.0 | 100.0 | 100.0 |
Statement 5.1: Percentage of persons of age 6 years and above participating in a day in activities of major divisions of TUS activity classification irrespective of whether it is a major activity or not (considering all the activities in a time slot)
| major divisions of TUS activity classification | rural | urban | rural+urban | ||||||
|---|---|---|---|---|---|---|---|---|---|
| male | female | person | male | female | person | male | female | person | |
| (1) | (2) | (3) | (4) | (5) | (6) | (7) | (8) | (9) | (10) |
| Telangana | |||||||||
| Employment and related activities | 66.9 | 42.8 | 54.6 | 59.3 | 24.0 | 42.0 | 63.6 | 35.1 | 49.3 |
| Production of goods for own final use | 10.5 | 9.2 | 9.8 | 4.0 | 3.7 | 3.8 | 7.7 | 6.9 | 7.3 |
| Unpaid domestic services for household members | 37.0 | 85.6 | 61.8 | 38.5 | 80.5 | 59.0 | 37.7 | 83.5 | 60.7 |
| Unpaid caregiving services for household members | 21.8 | 32.2 | 27.1 | 23.7 | 33.8 | 28.7 | 22.6 | 32.8 | 27.7 |
| Unpaid volunteer, trainee and other unpaid work | 1.0 | 1.2 | 1.1 | 1.0 | 1.1 | 1.0 | 1.0 | 1.2 | 1.1 |
| Learning | 21.1 | 19.3 | 20.2 | 27.2 | 22.1 | 24.7 | 23.7 | 20.4 | 22.1 |
| Socializing and communication, community participation and religious practice | 94.6 | 94.8 | 94.7 | 97.0 | 95.6 | 96.3 | 95.6 | 95.1 | 95.4 |
| Culture, leisure, mass-media and sports practices | 96.2 | 93.1 | 94.6 | 97.6 | 97.4 | 97.5 | 96.8 | 94.9 | 95.8 |
| Self-care and maintenance | 100.0 | 100.0 | 100.0 | 100.0 | 100.0 | 100.0 | 100.0 | 100.0 | 100.0 |
| Tripura | |||||||||
| Employment and related activities | 64.4 | 16.6 | 40.1 | 56.6 | 15.1 | 35.2 | 62.7 | 16.3 | 39.0 |
| Production of goods for own final use | 18.4 | 37.9 | 28.3 | 6.7 | 10.7 | 8.7 | 15.8 | 31.9 | 24.0 |
| Unpaid domestic services for household members | 35.2 | 83.4 | 59.7 | 34.6 | 81.7 | 58.9 | 35.0 | 83.0 | 59.5 |
| Unpaid caregiving services for household members | 22.1 | 36.5 | 29.5 | 18.4 | 29.6 | 24.2 | 21.3 | 35.0 | 28.3 |
| Unpaid volunteer, trainee and other unpaid work | 0.8 | 0.5 | 0.6 | 0.6 | 0.8 | 0.7 | 0.8 | 0.6 | 0.7 |
| Learning | 17.9 | 17.7 | 17.8 | 22.7 | 18.8 | 20.7 | 18.9 | 17.9 | 18.4 |
| Socializing and communication, community participation and religious practice | 96.4 | 97.7 | 97.1 | 95.5 | 97.0 | 96.3 | 96.2 | 97.5 | 96.9 |
| Culture, leisure, mass-media and sports practices | 97.7 | 96.0 | 96.9 | 97.1 | 96.1 | 96.6 | 97.6 | 96.0 | 96.8 |
| Self-care and maintenance | 100.0 | 100.0 | 100.0 | 100.0 | 100.0 | 100.0 | 100.0 | 100.0 | 100.0 |
| Uttar Pradesh | |||||||||
| Employment and related activities | 56.9 | 14.0 | 35.2 | 60.9 | 10.3 | 36.1 | 57.7 | 13.3 | 35.4 |
| Production of goods for own final use | 23.4 | 21.8 | 22.6 | 3.3 | 3.8 | 3.5 | 19.2 | 18.2 | 18.7 |
| Unpaid domestic services for household members | 26.8 | 80.5 | 54.0 | 24.9 | 80.7 | 52.2 | 26.4 | 80.6 | 53.6 |
| Unpaid caregiving services for household members | 17.6 | 38.6 | 28.2 | 19.9 | 36.0 | 27.8 | 18.1 | 38.0 | 28.1 |
| Unpaid volunteer, trainee and other unpaid work | 0.5 | 0.4 | 0.4 | 0.4 | 0.3 | 0.4 | 0.5 | 0.4 | 0.4 |
| Learning | 25.7 | 22.1 | 23.9 | 23.9 | 22.1 | 23.0 | 25.3 | 22.1 | 23.7 |
| Socializing and communication, community participation and religious practice | 83.9 | 85.1 | 84.5 | 83.4 | 85.2 | 84.3 | 83.8 | 85.1 | 84.5 |
| Culture, leisure, mass-media and sports practices | 91.8 | 87.3 | 89.5 | 94.5 | 93.9 | 94.2 | 92.4 | 88.6 | 90.5 |
| Self-care and maintenance | 100.0 | 100.0 | 100.0 | 100.0 | 100.0 | 100.0 | 100.0 | 100.0 | 100.0 |
| Uttarakhand | |||||||||
| Employment and related activities | 50.1 | 8.4 | 29.2 | 56.4 | 12.1 | 34.7 | 51.7 | 9.4 | 30.6 |
| Production of goods for own final use | 17.3 | 36.3 | 26.8 | 1.9 | 6.1 | 3.9 | 13.2 | 28.5 | 20.8 |
| Unpaid domestic services for household members | 29.6 | 80.3 | 55.0 | 32.7 | 80.3 | 56.1 | 30.5 | 80.3 | 55.3 |
| Unpaid caregiving services for household members | 19.0 | 36.1 | 27.6 | 22.5 | 34.2 | 28.2 | 19.9 | 35.6 | 27.7 |
| Unpaid volunteer, trainee and other unpaid work | 0.8 | 0.7 | 0.7 | 0.6 | 1.0 | 0.8 | 0.7 | 0.8 | 0.7 |
| Learning | 26.5 | 21.8 | 24.1 | 29.4 | 25.7 | 27.6 | 27.3 | 22.8 | 25.0 |
| Socializing and communication, community participation and religious practice | 98.6 | 98.5 | 98.6 | 99.3 | 98.8 | 99.1 | 98.8 | 98.6 | 98.7 |
| Culture, leisure, mass-media and sports practices | 99.2 | 98.7 | 99.0 | 99.8 | 99.3 | 99.5 | 99.4 | 98.9 | 99.1 |
| Self-care and maintenance | 100.0 | 100.0 | 100.0 | 100.0 | 100.0 | 100.0 | 100.0 | 100.0 | 100.0 |
Statement 5.1: Percentage of persons of age 6 years and above participating in a day in activities of major divisions of TUS activity classification irrespective of whether it is a major activity or not (considering all the activities in a time slot)
| major divisions of TUS activity classification | rural | urban | rural+urban | ||||||
|---|---|---|---|---|---|---|---|---|---|
| male | female | person | male | female | person | male | female | person | |
| (1) | (2) | (3) | (4) | (5) | (6) | (7) | (8) | (9) | (10) |
| West Bengal | |||||||||
| Employment and related activities | 65.5 | 17.6 | 41.3 | 62.0 | 20.4 | 41.1 | 64.4 | 18.4 | 41.2 |
| Production of goods for own final use | 12.4 | 32.7 | 22.7 | 3.7 | 13.1 | 8.4 | 9.8 | 26.8 | 18.3 |
| Unpaid domestic services for household members | 32.0 | 81.7 | 57.1 | 34.7 | 80.1 | 57.5 | 32.8 | 81.2 | 57.2 |
| Unpaid caregiving services for household members | 14.1 | 33.0 | 23.7 | 12.0 | 27.5 | 19.8 | 13.4 | 31.4 | 22.5 |
| Unpaid volunteer, trainee and other unpaid work | 0.9 | 1.2 | 1.0 | 0.7 | 1.0 | 0.8 | 0.8 | 1.1 | 1.0 |
| Learning | 20.1 | 18.7 | 19.4 | 19.6 | 18.4 | 19.0 | 20.0 | 18.6 | 19.3 |
| Socializing and communication, community participation and religious practice | 90.4 | 92.7 | 91.6 | 87.3 | 92.5 | 89.9 | 89.5 | 92.6 | 91.1 |
| Culture, leisure, mass-media and sports practices | 92.5 | 83.8 | 88.1 | 93.4 | 91.8 | 92.6 | 92.8 | 86.3 | 89.5 |
| Self-care and maintenance | 100.0 | 100.0 | 100.0 | 100.0 | 100.0 | 100.0 | 100.0 | 100.0 | 100.0 |
| A \& N Islands | |||||||||
| Employment and related activities | 56.0 | 14.0 | 36.6 | 50.9 | 19.0 | 35.7 | 54.1 | 15.9 | 36.3 |
| Production of goods for own final use | 30.8 | 35.9 | 33.2 | 2.3 | 15.3 | 8.5 | 20.4 | 28.1 | 24.0 |
| Unpaid domestic services for household members | 35.1 | 84.4 | 57.9 | 26.1 | 76.7 | 50.3 | 31.9 | 81.5 | 55.1 |
| Unpaid caregiving services for household members | 9.5 | 23.6 | 16.0 | 12.5 | 24.2 | 18.1 | 10.6 | 23.9 | 16.8 |
| Unpaid volunteer, trainee and other unpaid work | 0.2 | 1.4 | 0.7 | – | 0.7 | 0.3 | 0.1 | 1.1 | 0.6 |
| Learning | 19.5 | 16.7 | 18.2 | 33.1 | 28.3 | 30.8 | 24.5 | 21.1 | 22.9 |
| Socializing and communication, community participation and religious practice | 88.1 | 90.7 | 89.3 | 87.3 | 89.8 | 88.5 | 87.8 | 90.4 | 89.0 |
| Culture, leisure, mass-media and sports practices | 98.7 | 98.8 | 98.8 | 98.9 | 99.2 | 99.0 | 98.8 | 98.9 | 98.8 |
| Self-care and maintenance | 100.0 | 100.0 | 100.0 | 100.0 | 100.0 | 100.0 | 100.0 | 100.0 | 100.0 |
| Chandigarh | |||||||||
| Employment and related activities | – | 66.6 | 22.1 | 45.5 | 66.6 | 22.1 | 45.5 | ||
| Production of goods for own final use | – | 0.2 | 2.3 | 1.2 | 0.2 | 2.3 | 1.2 | ||
| Unpaid domestic services for household members | – | 29.5 | 77.9 | 52.4 | 29.5 | 77.9 | 52.4 | ||
| Unpaid caregiving services for household members | – | 19.7 | 32.6 | 25.8 | 19.7 | 32.6 | 25.8 | ||
| Unpaid volunteer, trainee and other unpaid work | – | 0.3 | – | 0.1 | 0.3 | – | 0.1 | ||
| Learning | – | 17.8 | 24.9 | 21.2 | 17.8 | 24.9 | 21.2 | ||
| Socializing and communication, community participation and religious practice | – | 96.2 | 97.9 | 97.0 | 96.2 | 97.9 | 97.0 | ||
| Culture, leisure, mass-media and sports practices | – | 97.1 | 99.1 | 98.0 | 97.1 | 99.1 | 98.0 | ||
| Self-care and maintenance | – | 100.0 | 100.0 | 100.0 | 100.0 | 100.0 | 100.0 | ||
| Dadra \& Nagar Haveli and Daman \& Diu | |||||||||
| Employment and related activities | 57.7 | 35.4 | 47.0 | 72.2 | 33.2 | 56.0 | 67.4 | 34.1 | 52.7 |
| Production of goods for own final use | 9.2 | 27.7 | 18.1 | 5.4 | 3.8 | 4.9 | 6.7 | 13.2 | 9.7 |
| Unpaid domestic services for household members | 25.8 | 81.8 | 52.8 | 38.3 | 82.6 | 56.9 | 34.1 | 82.3 | 55.4 |
| Unpaid caregiving services for household members | 13.0 | 28.4 | 20.4 | 11.2 | 27.8 | 18.1 | 11.8 | 28.0 | 19.0 |
| Unpaid volunteer, trainee and other unpaid work | 0.4 | 0.9 | 0.6 | 0.2 | 0.3 | 0.2 | 0.3 | 0.5 | 0.4 |
| Learning | 22.3 | 22.8 | 22.6 | 19.2 | 21.9 | 20.3 | 20.3 | 22.2 | 21.1 |
| Socializing and communication, community participation and religious practice | 95.9 | 97.6 | 96.7 | 94.5 | 97.8 | 95.9 | 95.0 | 97.7 | 96.2 |
| Culture, leisure, mass-media and sports practices | 99.3 | 99.0 | 99.2 | 99.7 | 98.1 | 99.0 | 99.6 | 98.4 | 99.1 |
| Self-care and maintenance | 100.0 | 100.0 | 100.0 | 100.0 | 100.0 | 100.0 | 100.0 | 100.0 | 100.0 |
Statement 5.1: Percentage of persons of age 6 years and above participating in a day in activites of major divisions of TUS activity classification irrespective of whether it is a major activity or not (considering all the activities in a time slot)
| major divisions of TUS activity classification | rural | urban | rural+urban | ||||||
|---|---|---|---|---|---|---|---|---|---|
| male | female | person | male | female | person | male | female | person | |
| (1) | (2) | (3) | (4) | (5) | (6) | (7) | (8) | (9) | (10) |
| Jammu \& Kashmir | |||||||||
| Employment and related activities | 53.1 | 4.3 | 29.4 | 63.1 | 17.2 | 40.9 | 55.6 | 7.6 | 32.3 |
| Production of goods for own final use | 26.5 | 38.1 | 32.1 | 7.9 | 9.4 | 8.6 | 21.7 | 30.8 | 26.1 |
| Unpaid domestic services for household members | 25.6 | 76.4 | 50.2 | 17.6 | 78.7 | 47.1 | 23.6 | 77.0 | 49.4 |
| Unpaid caregiving services for household members | 13.9 | 35.2 | 24.3 | 12.4 | 34.9 | 23.3 | 13.6 | 35.1 | 24.0 |
| Unpaid volunteer, trainee and other unpaid work | 0.1 | 0.1 | 0.1 | 0.0 | 0.2 | 0.1 | 0.0 | 0.1 | 0.1 |
| Learning | 30.3 | 30.0 | 30.2 | 25.7 | 22.7 | 24.2 | 29.2 | 28.1 | 28.6 |
| Socializing and communication, community participation and religious practice | 85.2 | 86.0 | 85.6 | 67.7 | 76.7 | 72.1 | 80.7 | 83.7 | 82.1 |
| Culture, leisure, mass-media and sports practices | 97.6 | 96.5 | 97.1 | 97.3 | 93.2 | 95.3 | 97.5 | 95.7 | 96.6 |
| Self-care and maintenance | 100.0 | 100.0 | 100.0 | 100.0 | 100.0 | 100.0 | 100.0 | 100.0 | 100.0 |
| Ladakh | |||||||||
| Employment and related activities | 62.4 | 5.5 | 35.3 | 62.3 | 11.4 | 38.9 | 62.3 | 6.1 | 35.7 |
| Production of goods for own final use | 16.2 | 35.0 | 25.1 | 3.1 | 11.0 | 6.7 | 14.7 | 32.4 | 23.1 |
| Unpaid domestic services for household members | 29.6 | 81.4 | 54.2 | 27.4 | 87.6 | 55.0 | 29.3 | 82.1 | 54.3 |
| Unpaid caregiving services for household members | 28.3 | 55.7 | 41.3 | 23.2 | 44.7 | 33.1 | 27.7 | 54.5 | 40.4 |
| Unpaid volunteer, trainee and other unpaid work | – | 0.3 | 0.1 | – | – | – | – | 0.3 | 0.1 |
| Learning | 26.9 | 20.9 | 24.1 | 27.3 | 19.8 | 23.9 | 27.0 | 20.8 | 24.1 |
| Socializing and communication, community participation and religious practice | 85.6 | 84.7 | 85.2 | 81.8 | 86.1 | 83.8 | 85.2 | 84.9 | 85.0 |
| Culture, leisure, mass-media and sports practices | 99.0 | 96.9 | 98.0 | 96.2 | 96.6 | 96.4 | 98.6 | 96.9 | 97.8 |
| Self-care and maintenance | 100.0 | 100.0 | 100.0 | 100.0 | 100.0 | 100.0 | 100.0 | 100.0 | 100.0 |
| Lakshadweep | |||||||||
| Employment and related activities | 52.4 | 14.2 | 32.2 | 51.8 | 14.5 | 31.2 | 52.0 | 14.4 | 31.4 |
| Production of goods for own final use | 14.2 | 12.8 | 13.5 | 14.7 | 9.1 | 11.6 | 14.6 | 9.8 | 12.0 |
| Unpaid domestic services for household members | 23.7 | 83.2 | 55.2 | 39.6 | 83.4 | 63.8 | 36.2 | 83.4 | 62.1 |
| Unpaid caregiving services for household members | 19.1 | 62.9 | 42.3 | 14.8 | 43.7 | 30.8 | 15.7 | 47.5 | 33.1 |
| Unpaid volunteer, trainee and other unpaid work | 3.5 | 1.2 | 2.3 | 7.3 | 6.0 | 6.6 | 6.5 | 5.1 | 5.7 |
| Learning | 14.9 | 12.2 | 13.5 | 19.5 | 15.1 | 17.1 | 18.5 | 14.6 | 16.3 |
| Socializing and communication, community participation and religious practice | 99.8 | 100.0 | 99.9 | 98.6 | 98.9 | 98.7 | 98.8 | 99.1 | 99.0 |
| Culture, leisure, mass-media and sports practices | 96.6 | 86.9 | 91.5 | 97.6 | 94.5 | 95.9 | 97.4 | 93.0 | 95.0 |
| Self-care and maintenance | 100.0 | 100.0 | 100.0 | 100.0 | 100.0 | 100.0 | 100.0 | 100.0 | 100.0 |
| Puducherry | |||||||||
| Employment and related activities | 60.4 | 26.1 | 42.5 | 51.5 | 20.1 | 34.4 | 54.5 | 22.0 | 37.0 |
| Production of goods for own final use | 12.5 | 23.6 | 18.3 | 9.0 | 16.3 | 13.0 | 10.2 | 18.7 | 14.8 |
| Unpaid domestic services for household members | 43.0 | 86.3 | 65.6 | 37.8 | 82.0 | 61.9 | 39.6 | 83.4 | 63.1 |
| Unpaid caregiving services for household members | 25.7 | 31.3 | 28.6 | 20.5 | 30.8 | 26.1 | 22.3 | 31.0 | 27.0 |
| Unpaid volunteer, trainee and other unpaid work | 0.7 | 0.7 | 0.7 | 1.5 | 2.0 | 1.8 | 1.2 | 1.6 | 1.4 |
| Learning | 19.5 | 14.6 | 17.0 | 18.3 | 18.8 | 18.6 | 18.7 | 17.5 | 18.1 |
| Socializing and communication, community participation and religious practice | 92.0 | 88.2 | 90.0 | 91.0 | 87.7 | 89.2 | 91.4 | 87.9 | 89.5 |
| Culture, leisure, mass-media and sports practices | 91.2 | 89.2 | 90.1 | 93.7 | 91.0 | 92.2 | 92.8 | 90.4 | 91.5 |
| Self-care and maintenance | 100.0 | 100.0 | 100.0 | 100.0 | 100.0 | 100.0 | 100.0 | 100.0 | 100.0 |
Statement 5.1: Percentage of persons of age 6 years and above participating in a day in activities of major divisions of TUS activity classification irrespective of whether it is a major activity or not (considering all the activities in a time slot)
| major divisions of TUS activity classification | rural | urban | rural+urban | ||||||
|---|---|---|---|---|---|---|---|---|---|
| male | female | person | male | female | person | male | female | person | |
| (1) | (2) | (3) | (4) | (5) | (6) | (7) | (8) | (9) | (10) |
| All India | |||||||||
| Employment and related activities | 60.4 | 21.9 | 41.1 | 61.7 | 18.2 | 40.5 | 60.8 | 20.7 | 40.9 |
| Production of goods for own final use | 17.4 | 25.8 | 21.6 | 3.4 | 9.1 | 6.2 | 13.0 | 20.7 | 16.8 |
| Unpaid domestic services for household members | 26.5 | 81.8 | 54.2 | 28.4 | 80.9 | 53.9 | 27.1 | 81.5 | 54.1 |
| Unpaid caregiving services for household members | 18.2 | 34.8 | 26.5 | 17.5 | 32.0 | 24.5 | 17.9 | 34.0 | 25.9 |
| Unpaid volunteer, trainee and other unpaid work | 0.9 | 1.1 | 1.0 | 0.9 | 1.2 | 1.1 | 0.9 | 1.1 | 1.0 |
| Learning | 23.2 | 20.3 | 21.7 | 21.3 | 20.1 | 20.7 | 22.6 | 20.2 | 21.4 |
| Socializing and communication, community participation and religious practice | 89.7 | 90.4 | 90.1 | 90.1 | 91.5 | 90.8 | 89.8 | 90.7 | 90.3 |
| Culture, leisure, mass-media and sports practices | 94.8 | 88.8 | 91.8 | 96.4 | 95.1 | 95.8 | 95.3 | 90.7 | 93.0 |
| Self-care and maintenance | 100.0 | 100.0 | 100.0 | 100.0 | 100.0 | 100.0 | 100.0 | 100.0 | 100.0 |
Statement 6.1: Minutes spent in a day on an average per participant of age 6 years and above in the activities of major divisions of TUS activity classification irrespective of whether it is a major activity or not (considering all the activities in a time slot)
| major divisions of TUS activity classification | rural | urban | rural +urban | ||||||
|---|---|---|---|---|---|---|---|---|---|
| male | female | person | male | female | person | male | female | person | |
| (1) | (2) | (3) | (4) | (5) | (6) | (7) | (8) | (9) | (10) |
| Andhra Pradesh | |||||||||
| Employment and related activities | 489 | 401 | 458 | 503 | 387 | 472 | 493 | 398 | 462 |
| Production of goods for own final use | 76 | 61 | 67 | 42 | 44 | 44 | 70 | 56 | 61 |
| Unpaid domestic services for household members | 86 | 246 | 219 | 86 | 274 | 231 | 86 | 255 | 223 |
| Unpaid caregiving services for household members | 66 | 135 | 114 | 77 | 150 | 126 | 70 | 140 | 118 |
| Unpaid volunteer, trainee and other unpaid work | 137 | 145 | 141 | 146 | 129 | 136 | 139 | 140 | 139 |
| Learning | 475 | 455 | 466 | 471 | 456 | 464 | 474 | 455 | 465 |
| Socializing and communication, community participation and religious practice | 134 | 120 | 127 | 127 | 122 | 125 | 132 | 121 | 126 |
| Culture, leisure, mass-media and sports practices | 169 | 167 | 168 | 191 | 189 | 190 | 176 | 174 | 173 |
| Self-care and maintenance | 721 | 717 | 719 | 712 | 715 | 714 | 718 | 716 | 717 |
| Arunachal Pradesh | |||||||||
| Employment and related activities | 396 | 312 | 384 | 436 | 384 | 428 | 404 | 328 | 393 |
| Production of goods for own final use | 131 | 162 | 151 | 105 | 99 | 100 | 130 | 156 | 147 |
| Unpaid domestic services for household members | 101 | 357 | 258 | 97 | 361 | 255 | 100 | 358 | 257 |
| Unpaid caregiving services for household members | 75 | 100 | 91 | 88 | 128 | 117 | 77 | 105 | 95 |
| Unpaid volunteer, trainee and other unpaid work | 300 | 75 | 188 | – | – | – | 300 | 75 | 188 |
| Learning | 441 | 433 | 438 | 409 | 382 | 399 | 432 | 420 | 428 |
| Socializing and communication, community participation and religious practice | 92 | 90 | 91 | 93 | 80 | 87 | 92 | 88 | 90 |
| Culture, leisure, mass-media and sports practices | 167 | 116 | 142 | 204 | 170 | 188 | 174 | 126 | 152 |
| Self-care and maintenance | 722 | 690 | 706 | 687 | 657 | 673 | 714 | 684 | 700 |
| Assam | |||||||||
| Employment and related activities | 448 | 312 | 426 | 494 | 397 | 478 | 453 | 321 | 432 |
| Production of goods for own final use | 81 | 80 | 80 | 70 | 75 | 73 | 80 | 80 | 80 |
| Unpaid domestic services for household members | 90 | 324 | 254 | 101 | 319 | 240 | 92 | 323 | 253 |
| Unpaid caregiving services for household members | 70 | 127 | 106 | 74 | 131 | 109 | 71 | 127 | 106 |
| Unpaid volunteer, trainee and other unpaid work | 265 | 145 | 199 | 271 | 102 | 167 | 266 | 141 | 196 |
| Learning | 399 | 420 | 409 | 433 | 429 | 431 | 403 | 421 | 412 |
| Socializing and communication, community participation and religious practice | 125 | 136 | 131 | 102 | 123 | 112 | 123 | 134 | 129 |
| Culture, leisure, mass-media and sports practices | 183 | 159 | 171 | 201 | 191 | 196 | 185 | 162 | 174 |
| Self-care and maintenance | 704 | 697 | 701 | 692 | 687 | 689 | 703 | 696 | 699 |
| Bihar | |||||||||
| Employment and related activities | 433 | 248 | 402 | 500 | 341 | 480 | 441 | 256 | 411 |
| Production of goods for own final use | 152 | 119 | 136 | 157 | 85 | 112 | 152 | 118 | 135 |
| Unpaid domestic services for household members | 84 | 321 | 258 | 93 | 317 | 248 | 85 | 321 | 257 |
| Unpaid caregiving services for household members | 84 | 148 | 126 | 84 | 160 | 133 | 84 | 149 | 127 |
| Unpaid volunteer, trainee and other unpaid work | 112 | 109 | 110 | 81 | 101 | 91 | 110 | 108 | 109 |
| Learning | 430 | 423 | 427 | 428 | 400 | 416 | 430 | 421 | 426 |
| Socializing and communication, community participation and religious practice | 139 | 149 | 144 | 119 | 138 | 128 | 136 | 148 | 142 |
| Culture, leisure, mass-media and sports practices | 175 | 152 | 164 | 179 | 170 | 175 | 176 | 154 | 166 |
| Self-care and maintenance | 715 | 707 | 711 | 695 | 705 | 699 | 713 | 707 | 710 |
Statement 6.1: Minutes spent in a day on an average per participant of age 6 years and above in the activities of major divisions of TUS activity classification irrespective of whether it is a major activity or not (considering all the activities in a time slot)
| major divisions of TUS activity classification | rural | urban | rural $>u$ than | ||||||
|---|---|---|---|---|---|---|---|---|---|
| male | female | person | male | female | person | male | female | person | |
| (1) | (2) | (3) | (4) | (5) | (6) | (7) | (8) | (9) | (10) |
| Chhattisgarh | |||||||||
| Employment and related activities | 463 | 375 | 432 | 531 | 393 | 493 | 479 | 378 | 445 |
| Production of goods for own final use | 247 | 115 | 169 | 73 | 53 | 57 | 240 | 109 | 160 |
| Unpaid domestic services for household members | 96 | 255 | 221 | 97 | 262 | 223 | 96 | 257 | 221 |
| Unpaid caregiving services for household members | 89 | 123 | 110 | 77 | 127 | 110 | 87 | 124 | 110 |
| Unpaid volunteer, trainee and other unpaid work | 145 | 207 | 184 | 275 | 233 | 255 | 179 | 211 | 198 |
| Learning | 403 | 389 | 395 | 396 | 373 | 384 | 401 | 385 | 393 |
| Socializing and communication, community participation and religious practice | 135 | 121 | 128 | 112 | 121 | 116 | 130 | 121 | 126 |
| Culture, leisure, mass-media and sports practices | 170 | 162 | 166 | 184 | 193 | 189 | 174 | 169 | 172 |
| Self-care and maintenance | 728 | 719 | 724 | 710 | 718 | 714 | 724 | 718 | 721 |
| Delhi | |||||||||
| Employment and related activities | 578 | 516 | 571 | 575 | 467 | 563 | 575 | 470 | 563 |
| Production of goods for own final use | – | – | – | 259 | 132 | 162 | 259 | 132 | 162 |
| Unpaid domestic services for household members | 146 | 319 | 249 | 100 | 313 | 241 | 103 | 313 | 241 |
| Unpaid caregiving services for household members | 108 | 238 | 181 | 77 | 187 | 143 | 79 | 191 | 145 |
| Unpaid volunteer, trainee and other unpaid work | – | – | – | 90 | 63 | 84 | 90 | 63 | 84 |
| Learning | 533 | 392 | 447 | 470 | 440 | 456 | 472 | 438 | 456 |
| Socializing and communication, community participation and religious practice | 104 | 108 | 106 | 105 | 134 | 118 | 105 | 133 | 117 |
| Culture, leisure, mass-media and sports practices | 127 | 172 | 145 | 160 | 186 | 172 | 159 | 186 | 171 |
| Self-care and maintenance | 631 | 640 | 635 | 662 | 686 | 673 | 660 | 684 | 671 |
| Goa | |||||||||
| Employment and related activities | 541 | 498 | 529 | 549 | 515 | 539 | 546 | 509 | 536 |
| Production of goods for own final use | 191 | 148 | 165 | 120 | 68 | 98 | 157 | 122 | 139 |
| Unpaid domestic services for household members | 105 | 268 | 226 | 75 | 260 | 203 | 86 | 263 | 212 |
| Unpaid caregiving services for household members | 74 | 166 | 136 | 61 | 162 | 119 | 64 | 164 | 125 |
| Unpaid volunteer, trainee and other unpaid work | – | – | – | 135 | – | 135 | 135 | – | 135 |
| Learning | 372 | 407 | 392 | 409 | 418 | 413 | 397 | 414 | 406 |
| Socializing and communication, community participation and religious practice | 124 | 138 | 132 | 118 | 121 | 120 | 121 | 128 | 124 |
| Culture, leisure, mass-media and sports practices | 176 | 169 | 172 | 148 | 161 | 154 | 159 | 164 | 161 |
| Self-care and maintenance | 745 | 731 | 738 | 720 | 736 | 728 | 730 | 734 | 732 |
| Gujarat | |||||||||
| Employment and related activities | 459 | 319 | 415 | 536 | 372 | 501 | 492 | 335 | 449 |
| Production of goods for own final use | 148 | 81 | 98 | 72 | 41 | 45 | 139 | 72 | 87 |
| Unpaid domestic services for household members | 100 | 303 | 280 | 98 | 304 | 263 | 99 | 303 | 272 |
| Unpaid caregiving services for household members | 67 | 119 | 101 | 74 | 133 | 111 | 70 | 125 | 105 |
| Unpaid volunteer, trainee and other unpaid work | 95 | 78 | 88 | 110 | 81 | 89 | 99 | 80 | 88 |
| Learning | 424 | 413 | 419 | 399 | 397 | 398 | 413 | 406 | 410 |
| Socializing and communication, community participation and religious practice | 148 | 142 | 145 | 152 | 158 | 155 | 150 | 149 | 149 |
| Culture, leisure, mass-media and sports practices | 159 | 132 | 146 | 173 | 170 | 172 | 165 | 149 | 158 |
| Self-care and maintenance | 721 | 712 | 716 | 685 | 698 | 692 | 705 | 706 | 705 |
Statement 6.1: Minutes spent in a day on an average per participant of age 6 years and above in the activities of major divisions of TUS activity classification irrespective of whether it is a major activity or not (considering all the activities in a time slot)
| major divisions of TUS activity classification | rural | urban | rural $>u$ than | ||||||
|---|---|---|---|---|---|---|---|---|---|
| male | female | person | male | female | person | male | female | person | |
| (1) | (2) | (3) | (4) | (5) | (6) | (7) | (8) | (9) | (10) |
| Haryana | |||||||||
| Employment and related activities | 473 | 302 | 440 | 548 | 417 | 528 | 510 | 352 | 483 |
| Production of goods for own final use | 128 | 143 | 136 | 86 | 124 | 109 | 125 | 141 | 134 |
| Unpaid domestic services for household members | 79 | 300 | 258 | 85 | 304 | 236 | 83 | 302 | 248 |
| Unpaid caregiving services for household members | 64 | 119 | 101 | 65 | 139 | 110 | 65 | 129 | 105 |
| Unpaid volunteer, trainee and other unpaid work | 251 | 110 | 183 | 130 | 117 | 129 | 156 | 112 | 147 |
| Learning | 402 | 408 | 405 | 425 | 410 | 418 | 412 | 409 | 410 |
| Socializing and communication, community participation and religious practice | 125 | 138 | 131 | 109 | 139 | 123 | 118 | 138 | 127 |
| Culture, leisure, mass-media and sports practices | 196 | 175 | 186 | 191 | 203 | 197 | 194 | 188 | 191 |
| Self-care and maintenance | 709 | 701 | 705 | 670 | 672 | 671 | 690 | 688 | 689 |
| Himachal Pradesh | |||||||||
| Employment and related activities | 481 | 269 | 428 | 498 | 421 | 479 | 483 | 292 | 436 |
| Production of goods for own final use | 144 | 151 | 149 | 111 | 127 | 120 | 143 | 151 | 148 |
| Unpaid domestic services for household members | 91 | 282 | 243 | 90 | 257 | 202 | 91 | 279 | 238 |
| Unpaid caregiving services for household members | 78 | 140 | 122 | 78 | 130 | 109 | 78 | 139 | 120 |
| Unpaid volunteer, trainee and other unpaid work | 215 | 107 | 155 | 224 | 56 | 130 | 216 | 103 | 153 |
| Learning | 427 | 411 | 419 | 412 | 413 | 412 | 425 | 411 | 419 |
| Socializing and communication, community participation and religious practice | 125 | 126 | 126 | 129 | 143 | 136 | 126 | 128 | 127 |
| Culture, leisure, mass-media and sports practices | 207 | 176 | 191 | 215 | 220 | 217 | 208 | 181 | 194 |
| Self-care and maintenance | 696 | 681 | 688 | 645 | 656 | 650 | 689 | 678 | 683 |
| Jharkhand | |||||||||
| Employment and related activities | 462 | 264 | 411 | 524 | 366 | 493 | 475 | 280 | 426 |
| Production of goods for own final use | 155 | 135 | 143 | 84 | 84 | 84 | 152 | 132 | 139 |
| Unpaid domestic services for household members | 83 | 304 | 246 | 90 | 318 | 247 | 85 | 306 | 246 |
| Unpaid caregiving services for household members | 84 | 140 | 120 | 80 | 146 | 124 | 83 | 141 | 120 |
| Unpaid volunteer, trainee and other unpaid work | 109 | 95 | 99 | 256 | 178 | 206 | 141 | 109 | 119 |
| Learning | 410 | 404 | 407 | 438 | 427 | 433 | 416 | 409 | 412 |
| Socializing and communication, community participation and religious practice | 135 | 140 | 138 | 118 | 138 | 128 | 132 | 140 | 136 |
| Culture, leisure, mass-media and sports practices | 170 | 136 | 154 | 187 | 169 | 178 | 174 | 143 | 159 |
| Self-care and maintenance | 702 | 689 | 695 | 678 | 672 | 675 | 697 | 686 | 691 |
| Karnataka | |||||||||
| Employment and related activities | 446 | 351 | 418 | 496 | 385 | 470 | 465 | 362 | 438 |
| Production of goods for own final use | 78 | 59 | 69 | 49 | 59 | 56 | 75 | 59 | 67 |
| Unpaid domestic services for household members | 78 | 283 | 236 | 86 | 284 | 228 | 82 | 283 | 233 |
| Unpaid caregiving services for household members | 61 | 117 | 97 | 65 | 131 | 106 | 62 | 122 | 101 |
| Unpaid volunteer, trainee and other unpaid work | 121 | 87 | 97 | 84 | 106 | 97 | 104 | 94 | 97 |
| Learning | 414 | 418 | 416 | 375 | 426 | 399 | 396 | 422 | 408 |
| Socializing and communication, community participation and religious practice | 144 | 130 | 137 | 130 | 122 | 126 | 138 | 127 | 133 |
| Culture, leisure, mass-media and sports practices | 165 | 156 | 161 | 178 | 169 | 174 | 171 | 161 | 166 |
| Self-care and maintenance | 711 | 711 | 711 | 707 | 714 | 710 | 709 | 712 | 711 |
Statement 6.1: Minutes spent in a day on an average per participant of age 6 years and above in the activities of major divisions of TUS activity classification irrespective of whether it is a major activity or not (considering all the activities in a time slot)
| major divisions of TUS activity classification | rural | urban | rural $>u$ than | ||||||
|---|---|---|---|---|---|---|---|---|---|
| male | female | person | male | female | person | male | female | person | |
| (1) | (2) | (3) | (4) | (5) | (6) | (7) | (8) | (9) | (10) |
| Kerala | |||||||||
| Employment and related activities | 473 | 384 | 444 | 486 | 392 | 457 | 479 | 388 | 450 |
| Production of goods for own final use | 99 | 70 | 81 | 94 | 64 | 76 | 97 | 68 | 79 |
| Unpaid domestic services for household members | 81 | 268 | 211 | 82 | 260 | 204 | 82 | 264 | 207 |
| Unpaid caregiving services for household members | 74 | 144 | 120 | 80 | 156 | 132 | 77 | 150 | 126 |
| Unpaid volunteer, trainee and other unpaid work | 147 | 128 | 135 | 142 | 134 | 137 | 144 | 131 | 136 |
| Learning | 425 | 395 | 409 | 415 | 421 | 418 | 420 | 408 | 413 |
| Socializing and communication, community participation and religious practice | 166 | 159 | 162 | 161 | 154 | 157 | 163 | 157 | 160 |
| Culture, leisure, mass-media and sports practices | 211 | 172 | 191 | 214 | 182 | 197 | 213 | 177 | 194 |
| Self-care and maintenance | 700 | 681 | 690 | 700 | 684 | 691 | 700 | 682 | 691 |
| Madhya Pradesh | |||||||||
| Employment and related activities | 430 | 328 | 404 | 497 | 370 | 474 | 449 | 337 | 422 |
| Production of goods for own final use | 118 | 109 | 113 | 86 | 63 | 71 | 115 | 103 | 108 |
| Unpaid domestic services for household members | 107 | 312 | 262 | 96 | 306 | 257 | 104 | 310 | 261 |
| Unpaid caregiving services for household members | 77 | 125 | 107 | 76 | 137 | 114 | 77 | 128 | 109 |
| Unpaid volunteer, trainee and other unpaid work | 130 | 88 | 108 | 150 | 107 | 127 | 134 | 92 | 112 |
| Learning | 382 | 384 | 383 | 400 | 387 | 394 | 388 | 385 | 386 |
| Socializing and communication, community participation and religious practice | 141 | 122 | 132 | 120 | 122 | 121 | 135 | 122 | 129 |
| Culture, leisure, mass-media and sports practices | 176 | 152 | 165 | 193 | 194 | 193 | 181 | 165 | 173 |
| Self-care and maintenance | 714 | 703 | 709 | 704 | 706 | 705 | 711 | 704 | 708 |
| Maharashtra | |||||||||
| Employment and related activities | 465 | 382 | 437 | 547 | 430 | 522 | 500 | 395 | 469 |
| Production of goods for own final use | 103 | 66 | 78 | 64 | 42 | 45 | 97 | 57 | 68 |
| Unpaid domestic services for household members | 92 | 280 | 239 | 86 | 281 | 239 | 90 | 281 | 239 |
| Unpaid caregiving services for household members | 75 | 128 | 109 | 66 | 125 | 104 | 71 | 127 | 106 |
| Unpaid volunteer, trainee and other unpaid work | 124 | 101 | 112 | 151 | 101 | 123 | 134 | 101 | 116 |
| Learning | 410 | 418 | 414 | 420 | 414 | 417 | 414 | 416 | 415 |
| Socializing and communication, community participation and religious practice | 147 | 125 | 137 | 124 | 128 | 126 | 137 | 127 | 132 |
| Culture, leisure, mass-media and sports practices | 166 | 144 | 156 | 184 | 178 | 181 | 174 | 159 | 167 |
| Self-care and maintenance | 713 | 707 | 710 | 698 | 720 | 709 | 707 | 712 | 709 |
| Manipur | |||||||||
| Employment and related activities | 426 | 294 | 380 | 444 | 313 | 390 | 431 | 301 | 383 |
| Production of goods for own final use | 104 | 124 | 116 | 98 | 101 | 100 | 102 | 119 | 112 |
| Unpaid domestic services for household members | 66 | 258 | 206 | 71 | 258 | 199 | 68 | 258 | 203 |
| Unpaid caregiving services for household members | 98 | 151 | 127 | 94 | 148 | 124 | 97 | 150 | 126 |
| Unpaid volunteer, trainee and other unpaid work | 172 | 109 | 140 | 192 | 91 | 149 | 177 | 106 | 142 |
| Learning | 493 | 501 | 496 | 469 | 454 | 462 | 486 | 486 | 486 |
| Socializing and communication, community participation and religious practice | 114 | 105 | 110 | 113 | 109 | 111 | 114 | 106 | 110 |
| Culture, leisure, mass-media and sports practices | 187 | 149 | 169 | 202 | 158 | 180 | 191 | 152 | 172 |
| Self-care and maintenance | 686 | 681 | 684 | 676 | 673 | 674 | 683 | 678 | 681 |
Statement 6.1: Minutes spent in a day on an average per participant of age 6 years and above in the activities of major divisions of TUS activity classification irrespective of whether it is a major activity or not (considering all the activities in a time slot)
| major divisions of TUS activity classification | rural | urban | rural +urban | ||||||
|---|---|---|---|---|---|---|---|---|---|
| male | female | person | male | female | person | male | female | person | |
| (1) | (2) | (3) | (4) | (5) | (6) | (7) | (8) | (9) | (10) |
| Meghalaya | |||||||||
| Employment and related activities | 464 | 389 | 444 | 478 | 431 | 466 | 467 | 397 | 448 |
| Production of goods for own final use | 172 | 120 | 147 | 95 | 110 | 102 | 163 | 119 | 142 |
| Unpaid domestic services for household members | 82 | 267 | 209 | 102 | 263 | 212 | 86 | 266 | 209 |
| Unpaid caregiving services for household members | 90 | 141 | 127 | 83 | 136 | 121 | 89 | 140 | 127 |
| Unpaid volunteer, trainee and other unpaid work | 208 | 169 | 178 | 150 | – | 150 | 198 | 169 | 177 |
| Learning | 423 | 426 | 424 | 442 | 424 | 432 | 427 | 425 | 426 |
| Socializing and communication, community participation and religious practice | 152 | 138 | 145 | 136 | 125 | 130 | 149 | 136 | 142 |
| Culture, leisure, mass-media and sports practices | 161 | 153 | 157 | 175 | 180 | 178 | 164 | 158 | 161 |
| Self-care and maintenance | 757 | 732 | 744 | 728 | 713 | 720 | 752 | 729 | 740 |
| Mizoram | |||||||||
| Employment and related activities | 418 | 372 | 404 | 433 | 392 | 422 | 424 | 379 | 411 |
| Production of goods for own final use | 73 | 120 | 98 | 97 | 106 | 103 | 75 | 117 | 98 |
| Unpaid domestic services for household members | 59 | 209 | 166 | 74 | 221 | 178 | 66 | 214 | 171 |
| Unpaid caregiving services for household members | 90 | 202 | 162 | 92 | 211 | 167 | 91 | 206 | 164 |
| Unpaid volunteer, trainee and other unpaid work | 104 | 90 | 98 | 80 | 123 | 93 | 92 | 101 | 96 |
| Learning | 435 | 427 | 431 | 439 | 429 | 435 | 437 | 428 | 433 |
| Socializing and communication, community participation and religious practice | 152 | 135 | 144 | 148 | 139 | 143 | 150 | 137 | 144 |
| Culture, leisure, mass-media and sports practices | 171 | 130 | 152 | 174 | 152 | 163 | 172 | 140 | 157 |
| Self-care and maintenance | 739 | 723 | 731 | 738 | 728 | 733 | 739 | 725 | 732 |
| Nagaland | |||||||||
| Employment and related activities | 329 | 211 | 297 | 383 | 304 | 362 | 356 | 257 | 329 |
| Production of goods for own final use | 245 | 208 | 227 | 119 | 116 | 118 | 223 | 195 | 210 |
| Unpaid domestic services for household members | 81 | 198 | 153 | 101 | 235 | 183 | 88 | 211 | 163 |
| Unpaid caregiving services for household members | 110 | 182 | 150 | 113 | 201 | 163 | 111 | 188 | 155 |
| Unpaid volunteer, trainee and other unpaid work | 158 | 114 | 135 | 145 | 112 | 133 | 154 | 113 | 134 |
| Learning | 363 | 351 | 357 | 382 | 381 | 382 | 372 | 364 | 368 |
| Socializing and communication, community participation and religious practice | 181 | 147 | 164 | 175 | 144 | 160 | 179 | 146 | 163 |
| Culture, leisure, mass-media and sports practices | 204 | 162 | 184 | 211 | 172 | 192 | 206 | 165 | 187 |
| Self-care and maintenance | 732 | 715 | 723 | 710 | 698 | 704 | 724 | 709 | 717 |
| Odisha | |||||||||
| Employment and related activities | 412 | 312 | 390 | 488 | 371 | 465 | 425 | 321 | 403 |
| Production of goods for own final use | 167 | 100 | 122 | 83 | 55 | 61 | 164 | 97 | 119 |
| Unpaid domestic services for household members | 98 | 293 | 249 | 92 | 277 | 226 | 97 | 290 | 245 |
| Unpaid caregiving services for household members | 85 | 136 | 120 | 80 | 136 | 118 | 84 | 136 | 119 |
| Unpaid volunteer, trainee and other unpaid work | 145 | 99 | 118 | 153 | 57 | 98 | 146 | 92 | 115 |
| Learning | 398 | 402 | 400 | 397 | 407 | 402 | 397 | 403 | 400 |
| Socializing and communication, community participation and religious practice | 148 | 150 | 149 | 129 | 149 | 140 | 145 | 150 | 148 |
| Culture, leisure, mass-media and sports practices | 189 | 161 | 175 | 196 | 187 | 191 | 190 | 165 | 178 |
| Self-care and maintenance | 735 | 711 | 723 | 714 | 703 | 708 | 732 | 709 | 720 |
Statement 6.1: Minutes spent in a day on an average per participant of age 6 years and above in the activities of major divisions of TUS activity classification irrespective of whether it is a major activity or not (considering all the activities in a time slot)
| major divisions of TUS activity classification | rural | urban | rural +urban | ||||||
|---|---|---|---|---|---|---|---|---|---|
| male | female | person | male | female | person | male | female | person | |
| (1) | (2) | (3) | (4) | (5) | (6) | (7) | (8) | (9) | (10) |
| Punjab | |||||||||
| Employment and related activities | 484 | 293 | 442 | 512 | 388 | 486 | 495 | 330 | 460 |
| Production of goods for own final use | 138 | 121 | 129 | 233 | 138 | 186 | 148 | 122 | 134 |
| Unpaid domestic services for household members | 92 | 299 | 246 | 100 | 286 | 232 | 95 | 294 | 240 |
| Unpaid caregiving services for household members | 69 | 126 | 106 | 71 | 133 | 108 | 70 | 129 | 107 |
| Unpaid volunteer, trainee and other unpaid work | 178 | 108 | 146 | 149 | 126 | 137 | 169 | 115 | 143 |
| Learning | 418 | 405 | 412 | 408 | 405 | 407 | 414 | 405 | 410 |
| Socializing and communication, community participation and religious practice | 123 | 144 | 133 | 120 | 146 | 132 | 122 | 145 | 133 |
| Culture, leisure, mass-media and sports practices | 185 | 175 | 181 | 184 | 179 | 182 | 185 | 177 | 181 |
| Self-care and maintenance | 699 | 700 | 699 | 690 | 688 | 689 | 695 | 695 | 695 |
| Rajasthan | |||||||||
| Employment and related activities | 457 | 288 | 398 | 517 | 357 | 486 | 476 | 299 | 421 |
| Production of goods for own final use | 162 | 171 | 168 | 113 | 87 | 94 | 160 | 166 | 164 |
| Unpaid domestic services for household members | 70 | 249 | 207 | 79 | 276 | 218 | 73 | 256 | 210 |
| Unpaid caregiving services for household members | 72 | 123 | 106 | 72 | 130 | 110 | 72 | 125 | 107 |
| Unpaid volunteer, trainee and other unpaid work | 190 | 103 | 147 | 230 | 126 | 170 | 200 | 110 | 153 |
| Learning | 392 | 380 | 387 | 410 | 389 | 401 | 397 | 383 | 390 |
| Socializing and communication, community participation and religious practice | 160 | 142 | 151 | 140 | 158 | 149 | 154 | 146 | 150 |
| Culture, leisure, mass-media and sports practices | 169 | 140 | 155 | 170 | 168 | 169 | 169 | 148 | 159 |
| Self-care and maintenance | 711 | 703 | 707 | 694 | 714 | 703 | 706 | 706 | 706 |
| Sikkim | |||||||||
| Employment and related activities | 411 | 316 | 385 | 537 | 425 | 507 | 444 | 345 | 417 |
| Production of goods for own final use | 182 | 124 | 156 | 63 | 74 | 69 | 179 | 122 | 153 |
| Unpaid domestic services for household members | 86 | 276 | 199 | 112 | 285 | 210 | 93 | 278 | 202 |
| Unpaid caregiving services for household members | 81 | 140 | 115 | 76 | 176 | 135 | 80 | 148 | 120 |
| Unpaid volunteer, trainee and other unpaid work | 210 | 290 | 227 | – | 160 | 160 | 210 | 241 | 219 |
| Learning | 397 | 384 | 391 | 418 | 408 | 413 | 403 | 391 | 397 |
| Socializing and communication, community participation and religious practice | 112 | 108 | 110 | 93 | 91 | 92 | 108 | 104 | 106 |
| Culture, leisure, mass-media and sports practices | 143 | 130 | 137 | 155 | 141 | 148 | 146 | 132 | 140 |
| Self-care and maintenance | 743 | 746 | 744 | 686 | 687 | 686 | 728 | 732 | 730 |
| Tamil Nadu | |||||||||
| Employment and related activities | 463 | 352 | 419 | 504 | 406 | 476 | 483 | 372 | 445 |
| Production of goods for own final use | 73 | 47 | 53 | 46 | 41 | 43 | 64 | 45 | 50 |
| Unpaid domestic services for household members | 71 | 212 | 179 | 72 | 233 | 189 | 71 | 222 | 184 |
| Unpaid caregiving services for household members | 68 | 132 | 108 | 70 | 138 | 112 | 69 | 135 | 110 |
| Unpaid volunteer, trainee and other unpaid work | 105 | 99 | 101 | 106 | 93 | 98 | 105 | 96 | 100 |
| Learning | 473 | 467 | 470 | 452 | 455 | 453 | 463 | 462 | 462 |
| Socializing and communication, community participation and religious practice | 136 | 132 | 134 | 124 | 122 | 123 | 130 | 128 | 129 |
| Culture, leisure, mass-media and sports practices | 195 | 187 | 191 | 193 | 203 | 198 | 195 | 194 | 194 |
| Self-care and maintenance | 700 | 697 | 699 | 699 | 714 | 707 | 700 | 705 | 703 |
Statement 6.1: Minutes spent in a day on an average per participant of age 6 years and above in the activities of major divisions of TUS activity classification irrespective of whether it is a major activity or not (considering all the activities in a time slot)
| major divisions of TUS activity classification | rural | urban | rural +urban | ||||||
|---|---|---|---|---|---|---|---|---|---|
| male | female | person | male | female | person | male | female | person | |
| (1) | (2) | (3) | (4) | (5) | (6) | (7) | (8) | (9) | (10) |
| Telangana | |||||||||
| Employment and related activities | 447 | 354 | 410 | 498 | 401 | 471 | 467 | 367 | 432 |
| Production of goods for own final use | 54 | 58 | 56 | 34 | 46 | 40 | 50 | 56 | 53 |
| Unpaid domestic services for household members | 72 | 240 | 191 | 73 | 264 | 201 | 72 | 250 | 195 |
| Unpaid caregiving services for household members | 73 | 133 | 110 | 73 | 150 | 118 | 73 | 140 | 113 |
| Unpaid volunteer, trainee and other unpaid work | 86 | 87 | 87 | 109 | 92 | 100 | 96 | 89 | 92 |
| Learning | 426 | 443 | 434 | 459 | 456 | 457 | 442 | 449 | 445 |
| Socializing and communication, community participation and religious practice | 142 | 125 | 133 | 122 | 118 | 120 | 133 | 122 | 128 |
| Culture, leisure, mass-media and sports practices | 160 | 140 | 150 | 171 | 179 | 175 | 165 | 156 | 161 |
| Self-care and maintenance | 713 | 700 | 707 | 687 | 690 | 689 | 702 | 696 | 699 |
| Tripura | |||||||||
| Employment and related activities | 424 | 314 | 401 | 477 | 346 | 448 | 435 | 321 | 410 |
| Production of goods for own final use | 109 | 101 | 103 | 101 | 60 | 75 | 108 | 98 | 101 |
| Unpaid domestic services for household members | 91 | 258 | 210 | 93 | 265 | 216 | 92 | 259 | 211 |
| Unpaid caregiving services for household members | 69 | 126 | 105 | 66 | 138 | 111 | 69 | 128 | 106 |
| Unpaid volunteer, trainee and other unpaid work | 165 | 56 | 124 | 66 | 60 | 62 | 148 | 57 | 109 |
| Learning | 387 | 392 | 390 | 400 | 427 | 413 | 390 | 400 | 395 |
| Socializing and communication, community participation and religious practice | 137 | 154 | 146 | 129 | 160 | 145 | 135 | 155 | 146 |
| Culture, leisure, mass-media and sports practices | 192 | 171 | 181 | 207 | 195 | 201 | 195 | 176 | 185 |
| Self-care and maintenance | 710 | 705 | 707 | 703 | 700 | 702 | 708 | 704 | 706 |
| Uttar Pradesh | |||||||||
| Employment and related activities | 455 | 251 | 414 | 514 | 379 | 495 | 468 | 271 | 431 |
| Production of goods for own final use | 170 | 136 | 154 | 125 | 113 | 119 | 169 | 135 | 152 |
| Unpaid domestic services for household members | 93 | 320 | 264 | 94 | 319 | 265 | 93 | 320 | 264 |
| Unpaid caregiving services for household members | 79 | 142 | 123 | 82 | 150 | 125 | 80 | 144 | 123 |
| Unpaid volunteer, trainee and other unpaid work | 172 | 134 | 155 | 131 | 134 | 132 | 164 | 134 | 151 |
| Learning | 399 | 396 | 398 | 404 | 403 | 403 | 400 | 397 | 399 |
| Socializing and communication, community participation and religious practice | 140 | 147 | 144 | 125 | 135 | 130 | 137 | 144 | 141 |
| Culture, leisure, mass-media and sports practices | 175 | 159 | 167 | 190 | 191 | 190 | 178 | 166 | 172 |
| Self-care and maintenance | 720 | 711 | 715 | 703 | 701 | 702 | 716 | 709 | 713 |
| Uttarakhand | |||||||||
| Employment and related activities | 444 | 303 | 424 | 480 | 380 | 463 | 454 | 329 | 435 |
| Production of goods for own final use | 181 | 191 | 188 | 111 | 73 | 82 | 178 | 185 | 183 |
| Unpaid domestic services for household members | 91 | 252 | 209 | 96 | 268 | 217 | 92 | 256 | 211 |
| Unpaid caregiving services for household members | 64 | 111 | 95 | 65 | 118 | 96 | 64 | 113 | 95 |
| Unpaid volunteer, trainee and other unpaid work | 91 | 130 | 109 | 118 | 56 | 80 | 97 | 105 | 101 |
| Learning | 371 | 380 | 375 | 360 | 376 | 367 | 368 | 378 | 372 |
| Socializing and communication, community participation and religious practice | 154 | 160 | 157 | 141 | 166 | 153 | 151 | 161 | 156 |
| Culture, leisure, mass-media and sports practices | 204 | 177 | 191 | 209 | 213 | 211 | 206 | 186 | 196 |
| Self-care and maintenance | 694 | 687 | 690 | 666 | 661 | 664 | 686 | 680 | 683 |
Statement 6.1: Minutes spent in a day on an average per participant of age 6 years and above in the activities of major divisions of TUS activity classification irrespective of whether it is a major activity or not (considering all the activities in a time slot)
| major divisions of TUS activity classification | rural | urban | rural $>u$ than | ||||||
|---|---|---|---|---|---|---|---|---|---|
| male | female | person | male | female | person | male | female | person | |
| (1) | (2) | (3) | (4) | (5) | (6) | (7) | (8) | (9) | (10) |
| West Bengal | |||||||||
| Employment and related activities | 439 | 275 | 404 | 509 | 354 | 471 | 460 | 301 | 424 |
| Production of goods for own final use | 117 | 81 | 91 | 65 | 48 | 52 | 111 | 76 | 85 |
| Unpaid domestic services for household members | 90 | 299 | 241 | 91 | 289 | 230 | 91 | 296 | 238 |
| Unpaid caregiving services for household members | 73 | 152 | 129 | 80 | 156 | 133 | 75 | 153 | 130 |
| Unpaid volunteer, trainee and other unpaid work | 147 | 96 | 118 | 211 | 129 | 163 | 163 | 105 | 129 |
| Learning | 422 | 439 | 431 | 440 | 425 | 433 | 428 | 435 | 431 |
| Socializing and communication, community participation and religious practice | 157 | 162 | 160 | 135 | 144 | 140 | 151 | 157 | 154 |
| Culture, leisure, mass-media and sports practices | 158 | 138 | 148 | 175 | 169 | 172 | 163 | 148 | 156 |
| Self-care and maintenance | 724 | 722 | 723 | 711 | 719 | 715 | 720 | 721 | 721 |
| A \& N Islands | |||||||||
| Employment and related activities | 484 | 440 | 477 | 548 | 462 | 526 | 506 | 450 | 495 |
| Production of goods for own final use | 150 | 126 | 138 | 125 | 27 | 41 | 149 | 106 | 125 |
| Unpaid domestic services for household members | 91 | 287 | 223 | 86 | 260 | 212 | 90 | 278 | 220 |
| Unpaid caregiving services for household members | 73 | 103 | 93 | 69 | 94 | 85 | 71 | 99 | 90 |
| Unpaid volunteer, trainee and other unpaid work | 75 | 47 | 52 | – | 30 | 30 | 75 | 43 | 47 |
| Learning | 377 | 362 | 371 | 379 | 412 | 394 | 378 | 387 | 382 |
| Socializing and communication, community participation and religious practice | 134 | 140 | 137 | 120 | 143 | 131 | 129 | 141 | 135 |
| Culture, leisure, mass-media and sports practices | 194 | 187 | 191 | 205 | 204 | 205 | 198 | 194 | 196 |
| Self-care and maintenance | 701 | 693 | 697 | 694 | 678 | 686 | 698 | 688 | 693 |
| Chandigarh | |||||||||
| Employment and related activities | – | – | – | 527 | 423 | 503 | 527 | 423 | 503 |
| Production of goods for own final use | – | – | – | 45 | 93 | 88 | 45 | 93 | 88 |
| Unpaid domestic services for household members | – | – | – | 109 | 243 | 203 | 109 | 243 | 203 |
| Unpaid caregiving services for household members | – | – | – | 81 | 176 | 138 | 81 | 176 | 138 |
| Unpaid volunteer, trainee and other unpaid work | – | – | – | 150 | – | 150 | 150 | – | 150 |
| Learning | – | – | – | 368 | 365 | 366 | 368 | 365 | 366 |
| Socializing and communication, community participation and religious practice | – | – | – | 111 | 136 | 123 | 111 | 136 | 123 |
| Culture, leisure, mass-media and sports practices | – | – | – | 181 | 193 | 187 | 181 | 193 | 187 |
| Self-care and maintenance | – | – | – | 692 | 682 | 687 | 692 | 682 | 687 |
| Dadra \& Nagar Haveli and Daman \& Diu | |||||||||
| Employment and related activities | 565 | 445 | 522 | 623 | 497 | 591 | 606 | 476 | 568 |
| Production of goods for own final use | 128 | 113 | 117 | 47 | 120 | 75 | 84 | 114 | 104 |
| Unpaid domestic services for household members | 69 | 223 | 184 | 105 | 245 | 190 | 96 | 236 | 188 |
| Unpaid caregiving services for household members | 71 | 94 | 86 | 62 | 126 | 103 | 65 | 113 | 96 |
| Unpaid volunteer, trainee and other unpaid work | 183 | 83 | 114 | 90 | 15 | 53 | 135 | 62 | 90 |
| Learning | 445 | 477 | 461 | 435 | 401 | 420 | 438 | 432 | 435 |
| Socializing and communication, community participation and religious practice | 136 | 133 | 135 | 108 | 164 | 132 | 117 | 152 | 133 |
| Culture, leisure, mass-media and sports practices | 199 | 162 | 181 | 174 | 204 | 186 | 183 | 187 | 185 |
| Self-care and maintenance | 647 | 642 | 644 | 581 | 585 | 583 | 603 | 608 | 605 |
Statement 6.1: Minutes spent in a day on an average per participant of age 6 years and above in the activities of major divisions of TUS activity classification irrespective of whether it is a major activity or not (considering all the activities in a time slot)
| major divisions of TUS activity classification | rural | urban | rural +urban | ||||||
|---|---|---|---|---|---|---|---|---|---|
| male | female | person | male | female | person | male | female | person | |
| (1) | (2) | (3) | (4) | (5) | (6) | (7) | (8) | (9) | (10) |
| Jammu \& Kashmir | |||||||||
| Employment and related activities | 434 | 326 | 427 | 513 | 355 | 481 | 457 | 343 | 444 |
| Production of goods for own final use | 177 | 121 | 145 | 132 | 118 | 124 | 173 | 121 | 143 |
| Unpaid domestic services for household members | 84 | 293 | 238 | 80 | 323 | 277 | 83 | 301 | 247 |
| Unpaid caregiving services for household members | 55 | 127 | 105 | 55 | 110 | 95 | 55 | 122 | 103 |
| Unpaid volunteer, trainee and other unpaid work | 20 | 50 | 35 | 60 | 147 | 135 | 26 | 99 | 72 |
| Learning | 390 | 385 | 387 | 389 | 434 | 409 | 389 | 395 | 392 |
| Socializing and communication, community participation and religious practice | 143 | 138 | 140 | 123 | 136 | 130 | 139 | 137 | 138 |
| Culture, leisure, mass-media and sports practices | 152 | 144 | 148 | 161 | 159 | 160 | 155 | 148 | 151 |
| Self-care and maintenance | 745 | 739 | 742 | 745 | 724 | 735 | 745 | 735 | 740 |
| Ladakh | |||||||||
| Employment and related activities | 430 | 324 | 422 | 470 | 390 | 459 | 434 | 337 | 427 |
| Production of goods for own final use | 125 | 111 | 116 | 118 | 79 | 88 | 125 | 110 | 115 |
| Unpaid domestic services for household members | 69 | 311 | 242 | 91 | 326 | 263 | 71 | 313 | 244 |
| Unpaid caregiving services for household members | 64 | 129 | 106 | 76 | 124 | 106 | 65 | 129 | 106 |
| Unpaid volunteer, trainee and other unpaid work | 30 | 30 | – | – | – | 30 | 30 | ||
| Learning | 447 | 439 | 444 | 403 | 424 | 411 | 442 | 437 | 440 |
| Socializing and communication, community participation and religious practice | 137 | 125 | 132 | 123 | 131 | 127 | 136 | 126 | 131 |
| Culture, leisure, mass-media and sports practices | 154 | 158 | 156 | 162 | 161 | 162 | 155 | 158 | 157 |
| Self-care and maintenance | 723 | 707 | 715 | 734 | 693 | 715 | 724 | 705 | 715 |
| Lakshadweep | |||||||||
| Employment and related activities | 401 | 264 | 369 | 405 | 274 | 371 | 404 | 272 | 371 |
| Production of goods for own final use | 144 | 79 | 111 | 112 | 80 | 98 | 119 | 80 | 101 |
| Unpaid domestic services for household members | 62 | 222 | 190 | 85 | 250 | 204 | 82 | 244 | 202 |
| Unpaid caregiving services for household members | 91 | 178 | 160 | 68 | 153 | 135 | 74 | 160 | 141 |
| Unpaid volunteer, trainee and other unpaid work | 248 | 83 | 201 | 132 | 71 | 101 | 145 | 72 | 109 |
| Learning | 435 | 411 | 424 | 459 | 426 | 443 | 455 | 424 | 440 |
| Socializing and communication, community participation and religious practice | 253 | 242 | 247 | 184 | 194 | 189 | 199 | 204 | 201 |
| Culture, leisure, mass-media and sports practices | 206 | 151 | 178 | 184 | 158 | 170 | 189 | 157 | 172 |
| Self-care and maintenance | 652 | 671 | 662 | 710 | 708 | 709 | 698 | 700 | 699 |
| Puducherry | |||||||||
| Employment and related activities | 556 | 465 | 527 | 548 | 434 | 512 | 551 | 446 | 518 |
| Production of goods for own final use | 57 | 50 | 52 | 52 | 54 | 54 | 54 | 53 | 53 |
| Unpaid domestic services for household members | 107 | 289 | 232 | 101 | 282 | 232 | 103 | 284 | 232 |
| Unpaid caregiving services for household members | 96 | 181 | 144 | 102 | 153 | 135 | 99 | 162 | 138 |
| Unpaid volunteer, trainee and other unpaid work | 154 | 120 | 137 | 112 | 130 | 123 | 121 | 129 | 126 |
| Learning | 456 | 469 | 462 | 503 | 508 | 506 | 486 | 497 | 492 |
| Socializing and communication, community participation and religious practice | 92 | 83 | 87 | 101 | 97 | 99 | 98 | 93 | 95 |
| Culture, leisure, mass-media and sports practices | 169 | 179 | 174 | 194 | 190 | 192 | 186 | 187 | 186 |
| Self-care and maintenance | 698 | 699 | 698 | 726 | 709 | 717 | 717 | 706 | 711 |
Statement 6.1: Minutes spent in a day on an average per participant of age 6 years and above in the activities of major divisions of TUS activity classification irrespective of whether it is a major activity or not (considering all the activities in a time slot)
| major divisions of TUS activity classification | rural | urban | rural $>$ urban | ||||||
|---|---|---|---|---|---|---|---|---|---|
| male | female | person | male | female | person | male | female | person | |
| (1) | (2) | (3) | (4) | (5) | (6) | (7) | (8) | (9) | (10) |
| All India | |||||||||
| Employment and related activities | 451 | 322 | 417 | 518 | 391 | 490 | 473 | 341 | 440 |
| Production of goods for own final use | 142 | 111 | 123 | 81 | 57 | 64 | 137 | 104 | 116 |
| Unpaid domestic services for household members | 88 | 291 | 241 | 88 | 285 | 232 | 88 | 289 | 238 |
| Unpaid caregiving services for household members | 76 | 135 | 115 | 74 | 142 | 117 | 75 | 137 | 116 |
| Unpaid volunteer, trainee and other unpaid work | 140 | 107 | 121 | 139 | 110 | 123 | 139 | 108 | 122 |
| Learning | 413 | 412 | 413 | 421 | 417 | 419 | 415 | 413 | 414 |
| Socializing and communication, community participation and religious practice | 143 | 140 | 142 | 128 | 135 | 131 | 138 | 139 | 138 |
| Culture, leisure, mass-media and sports practices | 174 | 155 | 165 | 184 | 183 | 183 | 177 | 164 | 171 |
| Self-care and maintenance | 715 | 707 | 711 | 697 | 705 | 701 | 710 | 706 | 708 |
Statement 7.1: Minutes spent in a day on an average per person of age 6 years and above in the activities of major divisions of TUS activity classification irrespective of whether it is a major activity or not (considering all the activities in a time slot)
| major divisions of TUS activity classification | rural | urban | rural>urban | ||||||
|---|---|---|---|---|---|---|---|---|---|
| male | female | person | male | female | person | male | female | person | |
| (1) | (2) | (3) | (4) | (5) | (6) | (7) | (8) | (9) | (10) |
| Andhra Pradesh | |||||||||
| Employment and related activities | 322 | 143 | 231 | 291 | 80 | 185 | 312 | 122 | 216 |
| Production of goods for own final use | 8 | 10 | 9 | 2 | 7 | 4 | 6 | 9 | 7 |
| Unpaid domestic services for household members | 15 | 209 | 113 | 21 | 223 | 122 | 17 | 214 | 116 |
| Unpaid caregiving services for household members | 9 | 38 | 24 | 10 | 40 | 25 | 9 | 39 | 24 |
| Unpaid volunteer, trainee and other unpaid work | 2 | 1 | 1 | 1 | 1 | 1 | 1 | 1 | 1 |
| Learning | 83 | 62 | 72 | 104 | 84 | 94 | 90 | 69 | 79 |
| Socializing and communication, community participation and religious practice | 118 | 103 | 110 | 114 | 108 | 111 | 117 | 105 | 111 |
| Culture, leisure, mass-media and sports practices | 164 | 156 | 160 | 185 | 182 | 184 | 171 | 165 | 168 |
| Self-care and maintenance | 721 | 717 | 719 | 712 | 715 | 714 | 718 | 716 | 717 |
| Arunachal Pradesh | |||||||||
| Employment and related activities | 273 | 36 | 159 | 277 | 54 | 173 | 274 | 40 | 161 |
| Production of goods for own final use | 38 | 89 | 63 | 7 | 23 | 14 | 32 | 76 | 53 |
| Unpaid domestic services for household members | 53 | 318 | 182 | 52 | 328 | 181 | 53 | 320 | 182 |
| Unpaid caregiving services for household members | 27 | 66 | 46 | 18 | 73 | 44 | 25 | 67 | 45 |
| Unpaid volunteer, trainee and other unpaid work | 0 | 0 | 0 | – | – | – | 0 | 0 | 0 |
| Learning | 89 | 58 | 74 | 115 | 72 | 95 | 95 | 61 | 78 |
| Socializing and communication, community participation and religious practice | 73 | 72 | 73 | 81 | 68 | 75 | 75 | 71 | 73 |
| Culture, leisure, mass-media and sports practices | 165 | 110 | 138 | 202 | 164 | 184 | 173 | 121 | 148 |
| Self-care and maintenance | 722 | 690 | 706 | 687 | 657 | 673 | 714 | 684 | 700 |
| Assam | |||||||||
| Employment and related activities | 287 | 40 | 165 | 295 | 52 | 182 | 288 | 41 | 167 |
| Production of goods for own final use | 14 | 22 | 18 | 3 | 6 | 5 | 13 | 20 | 16 |
| Unpaid domestic services for household members | 30 | 262 | 145 | 40 | 257 | 141 | 31 | 261 | 145 |
| Unpaid caregiving services for household members | 16 | 50 | 33 | 13 | 43 | 27 | 16 | 49 | 32 |
| Unpaid volunteer, trainee and other unpaid work | 1 | 0 | 1 | 0 | 0 | 0 | 1 | 0 | 0 |
| Learning | 95 | 94 | 94 | 107 | 91 | 99 | 96 | 94 | 95 |
| Socializing and communication, community participation and religious practice | 114 | 126 | 120 | 91 | 115 | 102 | 111 | 125 | 118 |
| Culture, leisure, mass-media and sports practices | 179 | 149 | 164 | 199 | 188 | 194 | 181 | 153 | 167 |
| Self-care and maintenance | 704 | 697 | 701 | 692 | 687 | 689 | 703 | 696 | 699 |
| Bihar | |||||||||
| Employment and related activities | 237 | 27 | 132 | 273 | 29 | 157 | 241 | 27 | 135 |
| Production of goods for own final use | 22 | 18 | 20 | 4 | 4 | 4 | 20 | 17 | 18 |
| Unpaid domestic services for household members | 23 | 248 | 135 | 29 | 246 | 133 | 24 | 248 | 135 |
| Unpaid caregiving services for household members | 18 | 59 | 38 | 15 | 58 | 35 | 17 | 59 | 38 |
| Unpaid volunteer, trainee and other unpaid work | 0 | 1 | 0 | 0 | 0 | 0 | 0 | 0 | 0 |
| Learning | 144 | 121 | 132 | 146 | 113 | 130 | 144 | 120 | 132 |
| Socializing and communication, community participation and religious practice | 116 | 131 | 124 | 104 | 125 | 114 | 115 | 130 | 123 |
| Culture, leisure, mass-media and sports practices | 165 | 129 | 147 | 174 | 160 | 167 | 166 | 132 | 149 |
| Self-care and maintenance | 715 | 707 | 711 | 695 | 705 | 699 | 713 | 707 | 710 |
Statement 7.1: Minutes spent in a day on an average per person of age 6 years and above in the activities of major divisions of TUS activity classification irrespective of whether it is a major activity or not (considering all the activities in a time slot)
| major divisions of TUS activity classification | rural | urban | rural+urban | ||||||
|---|---|---|---|---|---|---|---|---|---|
| male | female | person | male | female | person | male | female | person | |
| (1) | (2) | (3) | (4) | (5) | (6) | (7) | (8) | (9) | (10) |
| Chhattisgarh | |||||||||
| Employment and related activities | 260 | 115 | 187 | 320 | 90 | 205 | 273 | 109 | 191 |
| Production of goods for own final use | 51 | 34 | 42 | 2 | 7 | 4 | 40 | 28 | 34 |
| Unpaid domestic services for household members | 22 | 204 | 113 | 22 | 196 | 109 | 22 | 202 | 112 |
| Unpaid caregiving services for household members | 17 | 37 | 27 | 13 | 40 | 26 | 16 | 38 | 27 |
| Unpaid volunteer, trainee and other unpaid work | 1 | 2 | 1 | 2 | 1 | 2 | 1 | 2 | 1 |
| Learning | 80 | 81 | 81 | 94 | 97 | 95 | 83 | 85 | 84 |
| Socializing and communication, community participation and religious practice | 122 | 107 | 115 | 101 | 108 | 104 | 118 | 107 | 113 |
| Culture, leisure, mass-media and sports practices | 159 | 141 | 150 | 176 | 184 | 180 | 163 | 150 | 156 |
| Self-care and maintenance | 728 | 719 | 724 | 710 | 718 | 714 | 724 | 718 | 721 |
| Delhi | |||||||||
| Employment and related activities | 461 | 76 | 305 | 403 | 53 | 249 | 406 | 54 | 252 |
| Production of goods for own final use | – | – | – | 0 | 1 | 0 | 0 | 0 | 0 |
| Unpaid domestic services for household members | 60 | 274 | 147 | 32 | 249 | 127 | 34 | 250 | 128 |
| Unpaid caregiving services for household members | 26 | 109 | 60 | 15 | 68 | 38 | 15 | 69 | 39 |
| Unpaid volunteer, trainee and other unpaid work | – | – | – | 0 | 0 | 0 | 0 | 0 | 0 |
| Learning | 53 | 91 | 68 | 87 | 93 | 90 | 85 | 93 | 89 |
| Socializing and communication, community participation and religious practice | 95 | 95 | 96 | 93 | 118 | 104 | 93 | 117 | 104 |
| Culture, leisure, mass-media and sports practices | 114 | 154 | 130 | 148 | 172 | 159 | 146 | 171 | 157 |
| Self-care and maintenance | 631 | 640 | 635 | 662 | 686 | 673 | 660 | 684 | 671 |
| Goa | |||||||||
| Employment and related activities | 321 | 102 | 208 | 369 | 146 | 259 | 351 | 128 | 240 |
| Production of goods for own final use | 13 | 14 | 14 | 5 | 2 | 3 | 8 | 7 | 7 |
| Unpaid domestic services for household members | 29 | 199 | 116 | 21 | 171 | 94 | 24 | 182 | 103 |
| Unpaid caregiving services for household members | 8 | 35 | 22 | 10 | 37 | 23 | 9 | 36 | 22 |
| Unpaid volunteer, trainee and other unpaid work | – | – | – | 1 | – | 0 | 0 | – | 0 |
| Learning | 51 | 70 | 61 | 75 | 77 | 76 | 66 | 74 | 70 |
| Socializing and communication, community participation and religious practice | 105 | 125 | 115 | 103 | 111 | 107 | 104 | 117 | 110 |
| Culture, leisure, mass-media and sports practices | 168 | 164 | 166 | 137 | 160 | 148 | 149 | 162 | 155 |
| Self-care and maintenance | 745 | 731 | 738 | 720 | 736 | 728 | 730 | 734 | 732 |
| Gujarat | |||||||||
| Employment and related activities | 317 | 105 | 213 | 348 | 73 | 218 | 331 | 91 | 215 |
| Production of goods for own final use | 11 | 18 | 14 | 1 | 3 | 2 | 6 | 12 | 9 |
| Unpaid domestic services for household members | 10 | 252 | 129 | 18 | 254 | 129 | 14 | 253 | 129 |
| Unpaid caregiving services for household members | 11 | 38 | 24 | 12 | 40 | 25 | 12 | 39 | 25 |
| Unpaid volunteer, trainee and other unpaid work | 1 | 0 | 1 | 0 | 1 | 1 | 1 | 1 | 1 |
| Learning | 76 | 62 | 69 | 66 | 61 | 64 | 71 | 61 | 66 |
| Socializing and communication, community participation and religious practice | 141 | 136 | 139 | 143 | 152 | 147 | 142 | 143 | 142 |
| Culture, leisure, mass-media and sports practices | 153 | 118 | 136 | 167 | 158 | 163 | 159 | 135 | 148 |
| Self-care and maintenance | 721 | 712 | 716 | 685 | 698 | 692 | 705 | 706 | 705 |
Statement 7.1: Minutes spent in a day on an average per person of age 6 years and above in the activities of major divisions of TUS activity classification irrespective of whether it is a major activity or not (considering all the activities in a time slot)
| major divisions of TUS activity classification | rural | urban | rural+urban | ||||||
|---|---|---|---|---|---|---|---|---|---|
| male | female | person | male | female | person | male | female | person | |
| (1) | (2) | (3) | (4) | (5) | (6) | (7) | (8) | (9) | (10) |
| Haryana | |||||||||
| Employment and related activities | 271 | 43 | 160 | 351 | 57 | 217 | 309 | 49 | 186 |
| Production of goods for own final use | 25 | 37 | 31 | 1 | 4 | 3 | 14 | 22 | 18 |
| Unpaid domestic services for household members | 14 | 237 | 123 | 25 | 236 | 122 | 19 | 237 | 122 |
| Unpaid caregiving services for household members | 10 | 41 | 25 | 14 | 55 | 33 | 12 | 47 | 29 |
| Unpaid volunteer, trainee and other unpaid work | 1 | 0 | 1 | 2 | 0 | 1 | 2 | 0 | 1 |
| Learning | 107 | 92 | 100 | 93 | 91 | 92 | 100 | 92 | 96 |
| Socializing and communication, community participation and religious practice | 111 | 123 | 117 | 98 | 127 | 111 | 105 | 125 | 114 |
| Culture, leisure, mass-media and sports practices | 192 | 166 | 179 | 185 | 198 | 191 | 189 | 180 | 185 |
| Self-care and maintenance | 709 | 701 | 705 | 670 | 672 | 671 | 690 | 688 | 689 |
| Himachal Pradesh | |||||||||
| Employment and related activities | 259 | 45 | 147 | 328 | 96 | 216 | 268 | 50 | 155 |
| Production of goods for own final use | 45 | 76 | 61 | 4 | 6 | 5 | 39 | 68 | 54 |
| Unpaid domestic services for household members | 21 | 237 | 134 | 33 | 203 | 115 | 23 | 233 | 131 |
| Unpaid caregiving services for household members | 12 | 46 | 30 | 16 | 42 | 29 | 12 | 46 | 30 |
| Unpaid volunteer, trainee and other unpaid work | 2 | 1 | 2 | 2 | 1 | 1 | 2 | 1 | 2 |
| Learning | 93 | 77 | 84 | 86 | 94 | 90 | 92 | 79 | 85 |
| Socializing and communication, community participation and religious practice | 108 | 107 | 107 | 113 | 126 | 119 | 109 | 109 | 109 |
| Culture, leisure, mass-media and sports practices | 205 | 171 | 187 | 214 | 216 | 215 | 206 | 176 | 190 |
| Self-care and maintenance | 696 | 681 | 688 | 645 | 656 | 650 | 689 | 678 | 683 |
| Jharkhand | |||||||||
| Employment and related activities | 262 | 52 | 157 | 299 | 55 | 180 | 270 | 52 | 161 |
| Production of goods for own final use | 40 | 55 | 48 | 5 | 8 | 7 | 33 | 46 | 40 |
| Unpaid domestic services for household members | 24 | 249 | 137 | 32 | 258 | 142 | 26 | 251 | 138 |
| Unpaid caregiving services for household members | 19 | 54 | 37 | 12 | 46 | 29 | 18 | 53 | 35 |
| Unpaid volunteer, trainee and other unpaid work | 1 | 1 | 1 | 2 | 2 | 2 | 1 | 1 | 1 |
| Learning | 114 | 98 | 106 | 135 | 117 | 126 | 118 | 102 | 110 |
| Socializing and communication, community participation and religious practice | 119 | 126 | 123 | 101 | 124 | 112 | 116 | 125 | 121 |
| Culture, leisure, mass-media and sports practices | 158 | 115 | 137 | 177 | 159 | 168 | 162 | 124 | 143 |
| Self-care and maintenance | 702 | 689 | 695 | 678 | 672 | 675 | 697 | 686 | 691 |
| Karnataka | |||||||||
| Employment and related activities | 311 | 99 | 205 | 316 | 84 | 206 | 313 | 93 | 206 |
| Production of goods for own final use | 12 | 8 | 10 | 1 | 3 | 2 | 8 | 6 | 7 |
| Unpaid domestic services for household members | 20 | 239 | 130 | 25 | 227 | 121 | 22 | 234 | 126 |
| Unpaid caregiving services for household members | 12 | 43 | 28 | 12 | 46 | 28 | 12 | 44 | 28 |
| Unpaid volunteer, trainee and other unpaid work | 1 | 1 | 1 | 1 | 1 | 1 | 1 | 1 | 1 |
| Learning | 74 | 67 | 71 | 79 | 85 | 82 | 76 | 74 | 75 |
| Socializing and communication, community participation and religious practice | 137 | 123 | 130 | 125 | 116 | 121 | 132 | 121 | 127 |
| Culture, leisure, mass-media and sports practices | 161 | 148 | 155 | 174 | 163 | 169 | 166 | 154 | 160 |
| Self-care and maintenance | 711 | 711 | 711 | 707 | 714 | 710 | 709 | 712 | 711 |
Statement 7.1: Minutes spent in a day on an average per person of age 6 years and above in the activities of major divisions of TUS activity classification irrespective of whether it is a major activity or not (considering all the activities in a time slot)
| major divisions of TUS activity classification | rural | urban | rural>urban | ||||||
|---|---|---|---|---|---|---|---|---|---|
| male | female | person | male | female | person | male | female | person | |
| (1) | (2) | (3) | (4) | (5) | (6) | (7) | (8) | (9) | (10) |
| Kerala | |||||||||
| Employment and related activities | 234 | 78 | 151 | 243 | 78 | 155 | 239 | 78 | 153 |
| Production of goods for own final use | 9 | 8 | 8 | 6 | 5 | 6 | 7 | 7 | 7 |
| Unpaid domestic services for household members | 34 | 226 | 136 | 36 | 214 | 131 | 35 | 220 | 134 |
| Unpaid caregiving services for household members | 13 | 45 | 30 | 13 | 46 | 30 | 13 | 45 | 30 |
| Unpaid volunteer, trainee and other unpaid work | 5 | 6 | 6 | 5 | 7 | 6 | 5 | 7 | 6 |
| Learning | 75 | 74 | 75 | 77 | 86 | 82 | 76 | 80 | 78 |
| Socializing and communication, community participation and religious practice | 160 | 154 | 157 | 149 | 145 | 147 | 155 | 150 | 152 |
| Culture, leisure, mass-media and sports practices | 209 | 166 | 186 | 210 | 175 | 192 | 210 | 171 | 189 |
| Self-care and maintenance | 700 | 681 | 690 | 700 | 684 | 691 | 700 | 682 | 691 |
| Madhya Pradesh | |||||||||
| Employment and related activities | 277 | 79 | 182 | 310 | 54 | 186 | 286 | 72 | 183 |
| Production of goods for own final use | 38 | 49 | 43 | 7 | 11 | 9 | 29 | 38 | 33 |
| Unpaid domestic services for household members | 27 | 264 | 141 | 23 | 250 | 133 | 26 | 260 | 139 |
| Unpaid caregiving services for household members | 16 | 46 | 30 | 15 | 46 | 30 | 15 | 46 | 30 |
| Unpaid volunteer, trainee and other unpaid work | 1 | 1 | 1 | 1 | 1 | 1 | 1 | 1 | 1 |
| Learning | 72 | 60 | 66 | 90 | 79 | 85 | 77 | 65 | 71 |
| Socializing and communication, community participation and religious practice | 128 | 107 | 118 | 104 | 109 | 106 | 121 | 107 | 114 |
| Culture, leisure, mass-media and sports practices | 167 | 130 | 149 | 186 | 184 | 185 | 172 | 146 | 160 |
| Self-care and maintenance | 714 | 703 | 709 | 704 | 706 | 705 | 711 | 704 | 708 |
| Maharashtra | |||||||||
| Employment and related activities | 308 | 136 | 224 | 346 | 82 | 220 | 325 | 114 | 222 |
| Production of goods for own final use | 9 | 12 | 11 | 1 | 6 | 4 | 6 | 10 | 8 |
| Unpaid domestic services for household members | 21 | 239 | 128 | 18 | 233 | 121 | 20 | 237 | 125 |
| Unpaid caregiving services for household members | 12 | 38 | 25 | 10 | 37 | 23 | 11 | 38 | 24 |
| Unpaid volunteer, trainee and other unpaid work | 1 | 1 | 1 | 1 | 1 | 1 | 1 | 1 | 1 |
| Learning | 81 | 69 | 75 | 77 | 74 | 75 | 79 | 71 | 75 |
| Socializing and communication, community participation and religious practice | 137 | 113 | 125 | 110 | 116 | 113 | 125 | 114 | 120 |
| Culture, leisure, mass-media and sports practices | 158 | 124 | 141 | 179 | 171 | 175 | 167 | 143 | 156 |
| Self-care and maintenance | 713 | 707 | 710 | 698 | 720 | 709 | 707 | 712 | 709 |
| Manipur | |||||||||
| Employment and related activities | 242 | 95 | 170 | 253 | 120 | 186 | 246 | 103 | 175 |
| Production of goods for own final use | 21 | 38 | 29 | 13 | 19 | 16 | 19 | 32 | 25 |
| Unpaid domestic services for household members | 18 | 202 | 108 | 27 | 204 | 117 | 21 | 203 | 111 |
| Unpaid caregiving services for household members | 32 | 62 | 46 | 31 | 60 | 46 | 32 | 61 | 46 |
| Unpaid volunteer, trainee and other unpaid work | 1 | 1 | 1 | 1 | 0 | 1 | 1 | 1 | 1 |
| Learning | 148 | 122 | 135 | 135 | 110 | 122 | 144 | 118 | 131 |
| Socializing and communication, community participation and religious practice | 107 | 99 | 103 | 105 | 104 | 105 | 106 | 101 | 104 |
| Culture, leisure, mass-media and sports practices | 185 | 141 | 163 | 198 | 149 | 173 | 189 | 143 | 166 |
| Self-care and maintenance | 686 | 681 | 684 | 676 | 673 | 674 | 683 | 678 | 681 |
Statement 7.1: Minutes spent in a day on an average per person of age 6 years and above in the activities of major divisions of TUS activity classification irrespective of whether it is a major activity or not (considering all the activities in a time slot)
| major divisions of TUS activity classification | rural | urban | rural>urban | ||||||
|---|---|---|---|---|---|---|---|---|---|
| male | female | person | male | female | person | male | female | person | |
| (1) | (2) | (3) | (4) | (5) | (6) | (7) | (8) | (9) | (10) |
| Meghalaya | |||||||||
| Employment and related activities | 239 | 71 | 152 | 262 | 75 | 164 | 243 | 72 | 155 |
| Production of goods for own final use | 20 | 12 | 16 | 7 | 7 | 7 | 18 | 11 | 14 |
| Unpaid domestic services for household members | 33 | 219 | 129 | 44 | 215 | 134 | 35 | 218 | 130 |
| Unpaid caregiving services for household members | 16 | 66 | 42 | 11 | 42 | 28 | 15 | 61 | 39 |
| Unpaid volunteer, trainee and other unpaid work | 0 | 1 | 0 | 0 | – | 0 | 0 | 0 | 0 |
| Learning | 102 | 93 | 97 | 113 | 121 | 117 | 104 | 98 | 101 |
| Socializing and communication, community participation and religious practice | 129 | 116 | 122 | 110 | 100 | 104 | 125 | 113 | 119 |
| Culture, leisure, mass-media and sports practices | 143 | 131 | 137 | 164 | 167 | 166 | 147 | 138 | 142 |
| Self-care and maintenance | 757 | 732 | 744 | 728 | 713 | 720 | 752 | 729 | 740 |
| Mizoram | |||||||||
| Employment and related activities | 288 | 114 | 204 | 259 | 85 | 172 | 276 | 101 | 190 |
| Production of goods for own final use | 20 | 38 | 29 | 4 | 10 | 7 | 13 | 25 | 19 |
| Unpaid domestic services for household members | 20 | 191 | 103 | 28 | 198 | 113 | 23 | 194 | 107 |
| Unpaid caregiving services for household members | 26 | 109 | 66 | 29 | 112 | 71 | 27 | 111 | 68 |
| Unpaid volunteer, trainee and other unpaid work | 1 | 1 | 1 | 1 | 1 | 1 | 1 | 1 | 1 |
| Learning | 56 | 51 | 54 | 89 | 65 | 77 | 71 | 57 | 64 |
| Socializing and communication, community participation and religious practice | 127 | 102 | 115 | 126 | 106 | 116 | 127 | 104 | 115 |
| Culture, leisure, mass-media and sports practices | 162 | 113 | 138 | 165 | 135 | 150 | 164 | 123 | 143 |
| Self-care and maintenance | 739 | 723 | 731 | 738 | 728 | 733 | 739 | 725 | 732 |
| Nagaland | |||||||||
| Employment and related activities | 68 | 17 | 43 | 150 | 47 | 100 | 96 | 27 | 62 |
| Production of goods for own final use | 139 | 113 | 126 | 26 | 21 | 24 | 100 | 82 | 91 |
| Unpaid domestic services for household members | 42 | 171 | 105 | 52 | 199 | 124 | 46 | 180 | 112 |
| Unpaid caregiving services for household members | 34 | 75 | 54 | 35 | 87 | 61 | 34 | 79 | 56 |
| Unpaid volunteer, trainee and other unpaid work | 5 | 4 | 5 | 4 | 2 | 3 | 5 | 3 | 4 |
| Learning | 60 | 61 | 60 | 100 | 97 | 99 | 74 | 73 | 74 |
| Socializing and communication, community participation and religious practice | 158 | 127 | 143 | 155 | 124 | 140 | 157 | 126 | 142 |
| Culture, leisure, mass-media and sports practices | 203 | 158 | 181 | 207 | 166 | 187 | 204 | 161 | 183 |
| Self-care and maintenance | 732 | 715 | 723 | 710 | 698 | 704 | 724 | 709 | 717 |
| Odisha | |||||||||
| Employment and related activities | 232 | 47 | 138 | 289 | 50 | 166 | 241 | 48 | 142 |
| Production of goods for own final use | 33 | 38 | 35 | 3 | 7 | 5 | 28 | 33 | 30 |
| Unpaid domestic services for household members | 24 | 233 | 130 | 29 | 217 | 126 | 24 | 230 | 130 |
| Unpaid caregiving services for household members | 13 | 45 | 29 | 13 | 41 | 27 | 13 | 44 | 29 |
| Unpaid volunteer, trainee and other unpaid work | 2 | 2 | 2 | 2 | 1 | 2 | 2 | 2 | 2 |
| Learning | 85 | 77 | 81 | 89 | 103 | 96 | 86 | 81 | 83 |
| Socializing and communication, community participation and religious practice | 133 | 140 | 137 | 113 | 138 | 126 | 130 | 140 | 135 |
| Culture, leisure, mass-media and sports practices | 182 | 147 | 165 | 189 | 180 | 184 | 183 | 153 | 168 |
| Self-care and maintenance | 735 | 711 | 723 | 714 | 703 | 708 | 732 | 709 | 720 |
Statement 7.1: Minutes spent in a day on an average per person of age 6 years and above in the activities of major divisions of TUS activity classification irrespective of whether it is a major activity or not (considering all the activities in a time slot)
| major divisions of TUS activity classification | rural | urban | rural>urban | ||||||
|---|---|---|---|---|---|---|---|---|---|
| male | female | person | male | female | person | male | female | person | |
| (2) | (3) | (4) | (5) | (6) | (7) | (8) | (9) | (10) | |
| Punjab | |||||||||
| Employment and related activities | 311 | 58 | 191 | 331 | 74 | 210 | 319 | 65 | 199 |
| Production of goods for own final use | 14 | 16 | 15 | 4 | 3 | 4 | 10 | 10 | 10 |
| Unpaid domestic services for household members | 24 | 245 | 129 | 29 | 235 | 126 | 26 | 241 | 128 |
| Unpaid caregiving services for household members | 11 | 38 | 24 | 13 | 43 | 27 | 12 | 40 | 25 |
| Unpaid volunteer, trainee and other unpaid work | 2 | 1 | 1 | 1 | 1 | 1 | 2 | 1 | 1 |
| Learning | 84 | 77 | 81 | 81 | 87 | 84 | 83 | 81 | 82 |
| Socializing and communication, community participation and religious practice | 115 | 136 | 125 | 113 | 137 | 124 | 114 | 136 | 125 |
| Culture, leisure, mass-media and sports practices | 180 | 169 | 175 | 177 | 172 | 175 | 179 | 170 | 175 |
| Self-care and maintenance | 699 | 700 | 699 | 690 | 688 | 689 | 695 | 695 | 695 |
| Rajasthan | |||||||||
| Employment and related activities | 243 | 78 | 158 | 309 | 58 | 191 | 261 | 73 | 167 |
| Production of goods for own final use | 39 | 76 | 58 | 3 | 7 | 5 | 29 | 59 | 44 |
| Unpaid domestic services for household members | 19 | 206 | 116 | 23 | 220 | 116 | 20 | 210 | 116 |
| Unpaid caregiving services for household members | 13 | 42 | 28 | 11 | 43 | 26 | 13 | 42 | 28 |
| Unpaid volunteer, trainee and other unpaid work | 2 | 1 | 1 | 2 | 1 | 2 | 2 | 1 | 1 |
| Learning | 104 | 84 | 94 | 104 | 91 | 98 | 104 | 86 | 95 |
| Socializing and communication, community participation and religious practice | 150 | 134 | 142 | 130 | 150 | 139 | 144 | 138 | 141 |
| Culture, leisure, mass-media and sports practices | 158 | 115 | 136 | 163 | 156 | 160 | 160 | 125 | 142 |
| Self-care and maintenance | 711 | 703 | 707 | 694 | 714 | 703 | 706 | 706 | 706 |
| Sikkim | |||||||||
| Employment and related activities | 269 | 81 | 178 | 351 | 121 | 245 | 291 | 91 | 195 |
| Production of goods for own final use | 41 | 24 | 32 | 1 | 2 | 1 | 30 | 18 | 25 |
| Unpaid domestic services for household members | 49 | 244 | 144 | 68 | 265 | 159 | 54 | 249 | 148 |
| Unpaid caregiving services for household members | 21 | 53 | 37 | 16 | 62 | 37 | 20 | 55 | 37 |
| Unpaid volunteer, trainee and other unpaid work | 2 | 1 | 1 | – | 1 | 0 | 1 | 1 | 1 |
| Learning | 73 | 72 | 73 | 90 | 91 | 90 | 78 | 76 | 77 |
| Socializing and communication, community participation and religious practice | 102 | 97 | 100 | 76 | 75 | 76 | 95 | 92 | 94 |
| Culture, leisure, mass-media and sports practices | 140 | 123 | 131 | 151 | 137 | 145 | 143 | 126 | 135 |
| Self-care and maintenance | 743 | 746 | 744 | 686 | 687 | 686 | 728 | 732 | 730 |
| Tamil Nadu | |||||||||
| Employment and related activities | 290 | 133 | 208 | 321 | 103 | 211 | 305 | 119 | 210 |
| Production of goods for own final use | 7 | 12 | 9 | 2 | 4 | 3 | 5 | 8 | 6 |
| Unpaid domestic services for household members | 20 | 176 | 102 | 22 | 191 | 107 | 21 | 183 | 104 |
| Unpaid caregiving services for household members | 11 | 34 | 23 | 13 | 42 | 28 | 12 | 38 | 25 |
| Unpaid volunteer, trainee and other unpaid work | 3 | 4 | 3 | 2 | 3 | 2 | 2 | 3 | 3 |
| Learning | 85 | 74 | 79 | 74 | 71 | 73 | 80 | 73 | 76 |
| Socializing and communication, community participation and religious practice | 131 | 126 | 128 | 116 | 113 | 115 | 124 | 120 | 122 |
| Culture, leisure, mass-media and sports practices | 193 | 184 | 188 | 190 | 198 | 194 | 191 | 191 | 191 |
| Self-care and maintenance | 700 | 697 | 699 | 699 | 714 | 707 | 700 | 705 | 703 |
Statement 7.1: Minutes spent in a day on an average per person of age 6 years and above in the activities of major divisions of TUS activity classification irrespective of whether it is a major activity or not (considering all the activities in a time slot)
| major divisions of TUS activity classification | rural | urban | rural+urban | ||||||
|---|---|---|---|---|---|---|---|---|---|
| male | female | person | male | female | person | male | female | person | |
| (2) | (3) | (4) | (5) | (6) | (7) | (8) | (9) | (10) | |
| Telangana | |||||||||
| Employment and related activities | 299 | 151 | 224 | 295 | 96 | 198 | 297 | 129 | 213 |
| Production of goods for own final use | 6 | 5 | 6 | 1 | 2 | 2 | 4 | 4 | 4 |
| Unpaid domestic services for household members | 27 | 205 | 118 | 28 | 213 | 118 | 27 | 208 | 118 |
| Unpaid caregiving services for household members | 16 | 43 | 30 | 17 | 51 | 34 | 17 | 46 | 31 |
| Unpaid volunteer, trainee and other unpaid work | 1 | 1 | 1 | 1 | 1 | 1 | 1 | 1 | 1 |
| Learning | 90 | 85 | 88 | 125 | 101 | 113 | 105 | 92 | 98 |
| Socializing and communication, community participation and religious practice | 134 | 118 | 126 | 118 | 113 | 115 | 127 | 116 | 122 |
| Culture, leisure, mass-media and sports practices | 154 | 130 | 142 | 167 | 174 | 170 | 160 | 148 | 154 |
| Self-care and maintenance | 713 | 700 | 707 | 687 | 690 | 689 | 702 | 696 | 699 |
| Tripura | |||||||||
| Employment and related activities | 273 | 52 | 161 | 270 | 52 | 158 | 273 | 52 | 160 |
| Production of goods for own final use | 20 | 38 | 29 | 7 | 6 | 7 | 17 | 31 | 24 |
| Unpaid domestic services for household members | 32 | 215 | 125 | 32 | 216 | 127 | 32 | 215 | 126 |
| Unpaid caregiving services for household members | 15 | 46 | 31 | 12 | 41 | 27 | 15 | 45 | 30 |
| Unpaid volunteer, trainee and other unpaid work | 1 | 0 | 1 | 0 | 0 | 0 | 1 | 0 | 1 |
| Learning | 69 | 69 | 69 | 91 | 81 | 85 | 74 | 72 | 73 |
| Socializing and communication, community participation and religious practice | 132 | 150 | 141 | 123 | 156 | 140 | 130 | 152 | 141 |
| Culture, leisure, mass-media and sports practices | 187 | 164 | 175 | 201 | 188 | 194 | 190 | 169 | 180 |
| Self-care and maintenance | 710 | 705 | 707 | 703 | 700 | 702 | 708 | 704 | 706 |
| Uttar Pradesh | |||||||||
| Employment and related activities | 259 | 35 | 146 | 313 | 39 | 179 | 270 | 36 | 153 |
| Production of goods for own final use | 40 | 30 | 35 | 4 | 4 | 4 | 32 | 25 | 28 |
| Unpaid domestic services for household members | 25 | 257 | 143 | 23 | 258 | 138 | 25 | 258 | 142 |
| Unpaid caregiving services for household members | 14 | 55 | 35 | 16 | 54 | 35 | 14 | 55 | 35 |
| Unpaid volunteer, trainee and other unpaid work | 1 | 1 | 1 | 1 | 0 | 0 | 1 | 0 | 1 |
| Learning | 103 | 88 | 95 | 96 | 89 | 93 | 101 | 88 | 95 |
| Socializing and communication, community participation and religious practice | 118 | 125 | 121 | 104 | 115 | 109 | 115 | 123 | 119 |
| Culture, leisure, mass-media and sports practices | 161 | 139 | 150 | 179 | 179 | 179 | 165 | 147 | 156 |
| Self-care and maintenance | 720 | 711 | 715 | 703 | 701 | 702 | 716 | 709 | 713 |
| Uttarakhand | |||||||||
| Employment and related activities | 222 | 26 | 124 | 270 | 46 | 160 | 235 | 31 | 133 |
| Production of goods for own final use | 31 | 69 | 50 | 2 | 4 | 3 | 24 | 53 | 38 |
| Unpaid domestic services for household members | 27 | 203 | 115 | 31 | 215 | 122 | 28 | 206 | 117 |
| Unpaid caregiving services for household members | 12 | 40 | 26 | 15 | 40 | 27 | 13 | 40 | 26 |
| Unpaid volunteer, trainee and other unpaid work | 1 | 1 | 1 | 1 | 1 | 1 | 1 | 1 | 1 |
| Learning | 98 | 83 | 90 | 106 | 97 | 101 | 100 | 86 | 93 |
| Socializing and communication, community participation and religious practice | 152 | 157 | 155 | 140 | 164 | 152 | 149 | 159 | 154 |
| Culture, leisure, mass-media and sports practices | 203 | 175 | 189 | 209 | 212 | 210 | 204 | 184 | 194 |
| Self-care and maintenance | 694 | 687 | 690 | 666 | 661 | 664 | 686 | 680 | 683 |
Statement 7.1: Minutes spent in a day on an average per person of age 6 years and above in the activities of major divisions of TUS activity classification irrespective of whether it is a major activity or not (considering all the activities in a time slot)
| major divisions of TUS activity classification | rural | urban | rural+urban | ||||||
|---|---|---|---|---|---|---|---|---|---|
| male | female | person | male | female | person | male | female | person | |
| (1) | (2) | (3) | (4) | (5) | (6) | (7) | (8) | (9) | (10) |
| West Bengal | |||||||||
| Employment and related activities | 288 | 48 | 167 | 316 | 72 | 193 | 296 | 56 | 175 |
| Production of goods for own final use | 15 | 26 | 21 | 2 | 6 | 4 | 11 | 20 | 16 |
| Unpaid domestic services for household members | 29 | 244 | 138 | 32 | 232 | 132 | 30 | 240 | 136 |
| Unpaid caregiving services for household members | 10 | 50 | 30 | 10 | 43 | 26 | 10 | 48 | 29 |
| Unpaid volunteer, trainee and other unpaid work | 1 | 1 | 1 | 1 | 1 | 1 | 1 | 1 | 1 |
| Learning | 85 | 82 | 83 | 86 | 78 | 82 | 85 | 81 | 83 |
| Socializing and communication, community participation and religious practice | 142 | 151 | 146 | 118 | 133 | 126 | 135 | 145 | 140 |
| Culture, leisure, mass-media and sports practices | 146 | 115 | 131 | 164 | 155 | 159 | 151 | 127 | 139 |
| Self-care and maintenance | 724 | 722 | 723 | 711 | 719 | 715 | 720 | 721 | 721 |
| A \& N Islands | |||||||||
| Employment and related activities | 271 | 61 | 174 | 279 | 88 | 188 | 274 | 72 | 179 |
| Production of goods for own final use | 46 | 45 | 46 | 3 | 4 | 3 | 30 | 30 | 30 |
| Unpaid domestic services for household members | 32 | 243 | 129 | 22 | 199 | 107 | 29 | 226 | 121 |
| Unpaid caregiving services for household members | 7 | 24 | 15 | 9 | 23 | 15 | 8 | 24 | 15 |
| Unpaid volunteer, trainee and other unpaid work | 0 | 1 | 0 | – | 0 | 0 | 0 | 0 | 0 |
| Learning | 73 | 61 | 68 | 126 | 117 | 121 | 92 | 82 | 88 |
| Socializing and communication, community participation and religious practice | 118 | 127 | 122 | 105 | 128 | 116 | 113 | 127 | 120 |
| Culture, leisure, mass-media and sports practices | 191 | 185 | 188 | 203 | 203 | 203 | 196 | 192 | 194 |
| Self-care and maintenance | 701 | 693 | 697 | 694 | 678 | 686 | 698 | 688 | 693 |
| Chandigarh | |||||||||
| Employment and related activities | – | – | – | 351 | 93 | 229 | 351 | 93 | 229 |
| Production of goods for own final use | – | – | – | 0 | 2 | 1 | 0 | 2 | 1 |
| Unpaid domestic services for household members | – | – | – | 32 | 189 | 107 | 32 | 189 | 107 |
| Unpaid caregiving services for household members | – | – | – | 16 | 57 | 36 | 16 | 57 | 36 |
| Unpaid volunteer, trainee and other unpaid work | – | – | – | 0 | – | 0 | 0 | – | 0 |
| Learning | – | – | – | 66 | 91 | 78 | 66 | 91 | 78 |
| Socializing and communication, community participation and religious practice | – | – | – | 107 | 134 | 120 | 107 | 134 | 120 |
| Culture, leisure, mass-media and sports practices | – | – | – | 176 | 191 | 183 | 176 | 191 | 183 |
| Self-care and maintenance | – | – | – | 692 | 682 | 687 | 692 | 682 | 687 |
| Dadra \& Nagar Haveli and Daman \& Diu | |||||||||
| Employment and related activities | 326 | 157 | 245 | 450 | 165 | 331 | 408 | 162 | 300 |
| Production of goods for own final use | 12 | 31 | 21 | 3 | 5 | 4 | 6 | 15 | 10 |
| Unpaid domestic services for household members | 18 | 182 | 97 | 40 | 202 | 108 | 33 | 194 | 104 |
| Unpaid caregiving services for household members | 9 | 27 | 18 | 7 | 35 | 19 | 8 | 32 | 18 |
| Unpaid volunteer, trainee and other unpaid work | 1 | 1 | 1 | 0 | 0 | 0 | 0 | 0 | 0 |
| Learning | 99 | 109 | 104 | 84 | 88 | 85 | 89 | 96 | 92 |
| Socializing and communication, community participation and religious practice | 131 | 130 | 130 | 102 | 160 | 126 | 111 | 148 | 128 |
| Culture, leisure, mass-media and sports practices | 198 | 161 | 180 | 174 | 200 | 185 | 182 | 184 | 183 |
| Self-care and maintenance | 647 | 642 | 644 | 581 | 585 | 583 | 603 | 608 | 605 |
Statement 7.1: Minutes spent in a day on an average per person of age 6 years and above in the activities of major divisions of TUS activity classification irrespective of whether it is a major activity or not (considering all the activities in a time slot)
| major divisions of TUS activity classification | rural | urban | rural>urban | ||||||
|---|---|---|---|---|---|---|---|---|---|
| male | female | person | male | female | person | male | female | person | |
| (1) | (2) | (3) | (4) | (5) | (6) | (7) | (8) | (9) | (10) |
| Jammu \& Kashmir | |||||||||
| Employment and related activities | 230 | 14 | 125 | 324 | 61 | 197 | 254 | 26 | 144 |
| Production of goods for own final use | 47 | 46 | 47 | 10 | 11 | 11 | 38 | 37 | 37 |
| Unpaid domestic services for household members | 21 | 224 | 119 | 14 | 255 | 130 | 20 | 231 | 122 |
| Unpaid caregiving services for household members | 8 | 45 | 26 | 7 | 38 | 22 | 7 | 43 | 25 |
| Unpaid volunteer, trainee and other unpaid work | 0 | 0 | 0 | 0 | 0 | 0 | 0 | 0 | 0 |
| Learning | 118 | 115 | 117 | 100 | 98 | 99 | 114 | 111 | 112 |
| Socializing and communication, community participation and religious practice | 122 | 118 | 120 | 83 | 104 | 93 | 112 | 115 | 113 |
| Culture, leisure, mass-media and sports practices | 149 | 139 | 144 | 157 | 149 | 153 | 151 | 141 | 146 |
| Self-care and maintenance | 745 | 739 | 742 | 745 | 724 | 735 | 745 | 735 | 740 |
| Ladakh | |||||||||
| Employment and related activities | 268 | 18 | 149 | 293 | 45 | 179 | 271 | 21 | 152 |
| Production of goods for own final use | 20 | 39 | 29 | 4 | 9 | 6 | 18 | 36 | 27 |
| Unpaid domestic services for household members | 20 | 253 | 131 | 25 | 286 | 145 | 21 | 257 | 133 |
| Unpaid caregiving services for household members | 18 | 72 | 44 | 18 | 56 | 35 | 18 | 70 | 43 |
| Unpaid volunteer, trainee and other unpaid work | – | 0 | 0 | – | – | – | – | 0 | 0 |
| Learning | 120 | 92 | 107 | 110 | 84 | 98 | 119 | 91 | 106 |
| Socializing and communication, community participation and religious practice | 118 | 106 | 112 | 101 | 113 | 106 | 116 | 107 | 111 |
| Culture, leisure, mass-media and sports practices | 152 | 153 | 153 | 156 | 156 | 156 | 153 | 153 | 153 |
| Self-care and maintenance | 723 | 707 | 715 | 734 | 693 | 715 | 724 | 705 | 715 |
| Lakshadweep | |||||||||
| Employment and related activities | 210 | 37 | 119 | 210 | 40 | 116 | 210 | 39 | 116 |
| Production of goods for own final use | 20 | 10 | 15 | 16 | 7 | 11 | 17 | 8 | 12 |
| Unpaid domestic services for household members | 15 | 185 | 105 | 34 | 209 | 130 | 30 | 204 | 125 |
| Unpaid caregiving services for household members | 18 | 112 | 68 | 10 | 67 | 42 | 12 | 76 | 47 |
| Unpaid volunteer, trainee and other unpaid work | 9 | 1 | 5 | 10 | 4 | 7 | 9 | 4 | 6 |
| Learning | 65 | 50 | 57 | 89 | 64 | 76 | 84 | 62 | 72 |
| Socializing and communication, community participation and religious practice | 253 | 242 | 247 | 181 | 192 | 187 | 196 | 202 | 199 |
| Culture, leisure, mass-media and sports practices | 199 | 131 | 163 | 180 | 149 | 163 | 184 | 146 | 163 |
| Self-care and maintenance | 652 | 671 | 662 | 710 | 708 | 709 | 698 | 700 | 699 |
| Puducherry | |||||||||
| Employment and related activities | 336 | 121 | 224 | 282 | 87 | 176 | 301 | 98 | 192 |
| Production of goods for own final use | 7 | 12 | 10 | 5 | 9 | 7 | 6 | 10 | 8 |
| Unpaid domestic services for household members | 46 | 249 | 152 | 38 | 231 | 143 | 41 | 237 | 146 |
| Unpaid caregiving services for household members | 25 | 57 | 41 | 21 | 47 | 35 | 22 | 50 | 37 |
| Unpaid volunteer, trainee and other unpaid work | 1 | 1 | 1 | 2 | 3 | 2 | 1 | 2 | 2 |
| Learning | 89 | 69 | 78 | 92 | 96 | 94 | 91 | 87 | 89 |
| Socializing and communication, community participation and religious practice | 84 | 73 | 79 | 92 | 85 | 88 | 89 | 82 | 85 |
| Culture, leisure, mass-media and sports practices | 154 | 160 | 157 | 182 | 173 | 177 | 173 | 169 | 171 |
| Self-care and maintenance | 698 | 699 | 698 | 726 | 709 | 717 | 717 | 706 | 711 |
Statement 7.1: Minutes spent in a day on an average per person of age 6 years and above in the activities of major divisions of TUS activity classification irrespective of whether it is a major activity or not (considering all the activities in a time slot)
| major divisions of TUS activity classification | rural | urban | rural>urban | ||||||
|---|---|---|---|---|---|---|---|---|---|
| male | female | person | male | female | person | male | female | person | |
| (1) | (2) | (3) | (4) | (5) | (6) | (7) | (8) | (9) | (10) |
| All India | |||||||||
| Employment and related activities | 273 | 70 | 171 | 320 | 71 | 199 | 287 | 71 | 180 |
| Production of goods for own final use | 25 | 29 | 27 | 3 | 5 | 4 | 18 | 21 | 20 |
| Unpaid domestic services for household members | 23 | 238 | 131 | 25 | 231 | 125 | 24 | 236 | 129 |
| Unpaid caregiving services for household members | 14 | 47 | 30 | 13 | 46 | 29 | 13 | 47 | 30 |
| Unpaid volunteer, trainee and other unpaid work | 1 | 1 | 1 | 1 | 1 | 1 | 1 | 1 | 1 |
| Learning | 96 | 84 | 90 | 89 | 84 | 87 | 94 | 84 | 89 |
| Socializing and communication, community participation and religious practice | 128 | 127 | 128 | 115 | 124 | 119 | 124 | 126 | 125 |
| Culture, leisure, mass-media and sports practices | 165 | 137 | 151 | 177 | 174 | 176 | 169 | 148 | 159 |
| Self-care and maintenance | 715 | 707 | 711 | 697 | 705 | 701 | 710 | 706 | 708 |
Statement 8.1: Percentage of persons of age 6 years and above participating in a day in self development activities, unpaid activities and paid activities as a major activity (considering only the major activity of the time slots)
| Activity | rural | urban | rural+urban | ||||||
|---|---|---|---|---|---|---|---|---|---|
| male | female | person | male | female | person | male | female | person | |
| (1) | (2) | (3) | (4) | (5) | (6) | (7) | (8) | (9) | (10) |
| Andhra Pradesh | |||||||||
| self development/ self care/ self maintenance, etc. | 100.0 | 100.0 | 100.0 | 100.0 | 100.0 | 100.0 | 100.0 | 100.0 | 100.0 |
| all unpaid | 33.3 | 86.6 | 60.3 | 34.6 | 82.3 | 58.5 | 33.8 | 85.2 | 59.7 |
| all paid | 65.5 | 35.4 | 50.3 | 57.4 | 20.4 | 38.9 | 62.8 | 30.5 | 46.5 |
| all unpaid/paid | 73.8 | 87.9 | 81.0 | 69.1 | 83.5 | 76.3 | 72.2 | 86.5 | 79.4 |
| Arunachal Pradesh | |||||||||
| self development/ self care/ self maintenance, etc. | 100.0 | 100.0 | 100.0 | 100.0 | 100.0 | 100.0 | 100.0 | 100.0 | 100.0 |
| all unpaid | 71.8 | 90.5 | 80.9 | 61.1 | 91.3 | 75.2 | 69.6 | 90.7 | 79.7 |
| all paid | 69.0 | 11.5 | 41.1 | 63.0 | 14.1 | 40.1 | 67.7 | 12.0 | 40.9 |
| all unpaid/paid | 83.1 | 90.8 | 86.8 | 79.7 | 92.2 | 85.5 | 82.4 | 91.0 | 86.5 |
| Assam | |||||||||
| self development/ self care/ self maintenance, etc. | 100.0 | 100.0 | 100.0 | 100.0 | 100.0 | 100.0 | 100.0 | 100.0 | 100.0 |
| all unpaid | 52.2 | 82.2 | 67.0 | 49.3 | 81.9 | 64.5 | 51.8 | 82.2 | 66.7 |
| all paid | 63.8 | 12.5 | 38.4 | 59.5 | 13.1 | 37.9 | 63.3 | 12.6 | 38.3 |
| all unpaid/paid | 75.4 | 82.5 | 78.9 | 74.4 | 82.8 | 78.3 | 75.2 | 82.5 | 78.8 |
| Bihar | |||||||||
| self development/ self care/ self maintenance, etc. | 100.0 | 100.0 | 100.0 | 100.0 | 100.0 | 100.0 | 100.0 | 100.0 | 100.0 |
| all unpaid | 44.8 | 79.4 | 62.1 | 40.1 | 79.4 | 58.8 | 44.3 | 79.4 | 61.7 |
| all paid | 54.3 | 10.8 | 32.6 | 54.3 | 8.5 | 32.5 | 54.3 | 10.6 | 32.6 |
| all unpaid/paid | 66.7 | 79.7 | 73.2 | 69.1 | 80.2 | 74.4 | 66.9 | 79.7 | 73.3 |
| Chhattisgarh | |||||||||
| self development/ self care/ self maintenance, etc. | 100.0 | 100.0 | 100.0 | 100.0 | 100.0 | 100.0 | 100.0 | 100.0 | 100.0 |
| all unpaid | 45.2 | 82.8 | 64.1 | 34.0 | 76.8 | 55.5 | 42.7 | 81.5 | 62.2 |
| all paid | 55.9 | 30.6 | 43.2 | 59.5 | 22.9 | 41.2 | 56.7 | 28.9 | 42.7 |
| all unpaid/paid | 75.0 | 84.0 | 79.6 | 70.9 | 79.0 | 74.9 | 74.1 | 82.9 | 78.5 |
| Delhi | |||||||||
| self development/ self care/ self maintenance, etc. | 100.0 | 100.0 | 100.0 | 100.0 | 100.0 | 100.0 | 100.0 | 100.0 | 100.0 |
| all unpaid | 58.2 | 86.2 | 69.6 | 43.1 | 80.5 | 59.5 | 43.9 | 80.8 | 60.0 |
| all paid | 78.7 | 14.8 | 52.7 | 69.4 | 11.2 | 43.9 | 69.9 | 11.4 | 44.3 |
| all unpaid/paid | 82.7 | 86.2 | 84.2 | 77.1 | 81.5 | 79.0 | 77.4 | 81.8 | 79.3 |
| Goa | |||||||||
| self development/ self care/ self maintenance, etc. | 100.0 | 100.0 | 100.0 | 100.0 | 100.0 | 100.0 | 100.0 | 100.0 | 100.0 |
| all unpaid | 37.4 | 77.6 | 58.0 | 37.7 | 66.1 | 51.6 | 37.6 | 70.7 | 54.1 |
| all paid | 58.7 | 19.7 | 38.7 | 66.6 | 27.4 | 47.4 | 63.6 | 24.3 | 44.0 |
| all unpaid/paid | 80.5 | 86.9 | 83.8 | 78.1 | 81.9 | 80.0 | 79.0 | 83.9 | 81.5 |
| Gujarat | |||||||||
| self development/ self care/ self maintenance, etc. | 100.0 | 100.0 | 100.0 | 100.0 | 100.0 | 100.0 | 100.0 | 100.0 | 100.0 |
| all unpaid | 28.6 | 85.4 | 56.5 | 31.1 | 84.5 | 56.2 | 29.7 | 85.0 | 56.4 |
| all paid | 69.0 | 32.3 | 51.0 | 64.3 | 19.4 | 43.1 | 66.9 | 26.7 | 47.5 |
| all unpaid/paid | 76.1 | 87.2 | 81.5 | 72.9 | 86.0 | 79.1 | 74.6 | 86.7 | 80.4 |
| Haryana | |||||||||
| self development/ self care/ self maintenance, etc. | 100.0 | 100.0 | 100.0 | 100.0 | 100.0 | 100.0 | 100.0 | 100.0 | 100.0 |
| all unpaid | 38.1 | 81.4 | 59.1 | 42.7 | 80.5 | 59.9 | 40.2 | 81.0 | 59.5 |
| all paid | 57.0 | 14.1 | 36.2 | 63.7 | 13.6 | 40.8 | 60.2 | 13.9 | 38.3 |
| all unpaid/paid | 69.2 | 82.2 | 75.5 | 74.6 | 81.3 | 77.6 | 71.7 | 81.8 | 76.5 |
Statement 8.1: Percentage of persons of age 6 years and above participating in a day in self development activities, unpaid activities and paid activities as a major activity (considering only the major activity of the time slots)
| Activity | rural | urban | rural+urban | ||||||
|---|---|---|---|---|---|---|---|---|---|
| male | female | person | male | female | person | male | female | person | |
| (1) | (2) | (3) | (4) | (5) | (6) | (7) | (8) | (9) | (10) |
| Himachal Pradesh | |||||||||
| self development/ self care/ self maintenance, etc. | 100.0 | 100.0 | 100.0 | 100.0 | 100.0 | 100.0 | 100.0 | 100.0 | 100.0 |
| all unpaid | 50.9 | 86.1 | 69.3 | 49.0 | 79.8 | 63.9 | 50.7 | 85.4 | 68.6 |
| all paid | 53.5 | 16.3 | 34.1 | 65.2 | 22.9 | 44.7 | 55.1 | 17.1 | 35.4 |
| all unpaid/paid | 76.2 | 86.6 | 81.6 | 76.1 | 83.4 | 79.6 | 76.2 | 86.2 | 81.4 |
| Jharkhand | |||||||||
| self development/ self care/ self maintenance, etc. | 100.0 | 100.0 | 100.0 | 100.0 | 100.0 | 100.0 | 100.0 | 100.0 | 100.0 |
| all unpaid | 52.4 | 84.5 | 68.5 | 43.1 | 81.8 | 62.0 | 50.6 | 84.0 | 67.3 |
| all paid | 56.4 | 19.3 | 37.8 | 56.5 | 14.9 | 36.2 | 56.4 | 18.5 | 37.5 |
| all unpaid/paid | 71.9 | 84.8 | 78.4 | 69.7 | 83.0 | 76.2 | 71.5 | 84.5 | 78.0 |
| Karnataka | |||||||||
| self development/ self care/ self maintenance, etc. | 100.0 | 100.0 | 100.0 | 100.0 | 100.0 | 100.0 | 100.0 | 100.0 | 100.0 |
| all unpaid | 45.1 | 85.7 | 65.5 | 39.5 | 81.2 | 59.3 | 42.8 | 84.0 | 63.0 |
| all paid | 69.6 | 28.2 | 48.8 | 63.2 | 21.5 | 43.5 | 67.0 | 25.6 | 46.7 |
| all unpaid/paid | 78.4 | 86.9 | 82.6 | 75.9 | 84.1 | 79.8 | 77.3 | 85.8 | 81.5 |
| Kerala | |||||||||
| self development/ self care/ self maintenance, etc. | 100.0 | 100.0 | 100.0 | 100.0 | 100.0 | 100.0 | 100.0 | 100.0 | 100.0 |
| all unpaid | 51.9 | 85.2 | 69.6 | 50.9 | 83.2 | 68.1 | 51.4 | 84.2 | 68.9 |
| all paid | 49.1 | 20.0 | 33.7 | 49.6 | 19.8 | 33.7 | 49.3 | 19.9 | 33.7 |
| all unpaid/paid | 74.7 | 86.0 | 80.7 | 73.8 | 84.0 | 79.2 | 74.3 | 85.1 | 80.0 |
| Madhya Pradesh | |||||||||
| self development/ self care/ self maintenance, etc. | 100.0 | 100.0 | 100.0 | 100.0 | 100.0 | 100.0 | 100.0 | 100.0 | 100.0 |
| all unpaid | 55.6 | 87.5 | 71.0 | 40.0 | 83.8 | 61.3 | 51.1 | 86.4 | 68.2 |
| all paid | 64.1 | 24.2 | 44.8 | 61.7 | 14.5 | 38.8 | 63.4 | 21.4 | 43.1 |
| all unpaid/paid | 78.4 | 87.9 | 83.0 | 73.9 | 84.9 | 79.3 | 77.1 | 87.1 | 81.9 |
| Maharashtra | |||||||||
| self development/ self care/ self maintenance, etc. | 100.0 | 100.0 | 100.0 | 100.0 | 100.0 | 100.0 | 100.0 | 100.0 | 100.0 |
| all unpaid | 37.1 | 86.8 | 61.4 | 32.2 | 83.8 | 56.8 | 35.0 | 85.6 | 59.5 |
| all paid | 66.0 | 35.6 | 51.2 | 62.5 | 18.9 | 41.7 | 64.5 | 28.6 | 47.1 |
| all unpaid/paid | 75.4 | 87.5 | 81.3 | 73.1 | 85.6 | 79.1 | 74.4 | 86.7 | 80.4 |
| Manipur | |||||||||
| self development/ self care/ self maintenance, etc. | 100.0 | 100.0 | 100.0 | 100.0 | 100.0 | 100.0 | 100.0 | 100.0 | 100.0 |
| all unpaid | 52.5 | 81.3 | 66.5 | 58.4 | 80.4 | 69.6 | 54.2 | 81.0 | 67.4 |
| all paid | 56.8 | 31.9 | 44.7 | 56.9 | 38.2 | 47.4 | 56.8 | 33.9 | 45.5 |
| all unpaid/paid | 71.8 | 82.3 | 76.9 | 74.2 | 82.2 | 78.3 | 72.5 | 82.2 | 77.3 |
| Meghalaya | |||||||||
| self development/ self care/ self maintenance, etc. | 100.0 | 100.0 | 100.0 | 100.0 | 100.0 | 100.0 | 100.0 | 100.0 | 100.0 |
| all unpaid | 51.7 | 83.4 | 68.0 | 51.3 | 80.9 | 66.9 | 51.6 | 82.9 | 67.8 |
| all paid | 51.0 | 17.9 | 33.9 | 53.6 | 17.3 | 34.4 | 51.5 | 17.8 | 34.0 |
| all unpaid/paid | 74.2 | 84.1 | 79.3 | 78.3 | 82.6 | 80.6 | 75.0 | 83.9 | 79.5 |
| Mizoram | |||||||||
| self development/ self care/ self maintenance, etc. | 100.0 | 100.0 | 100.0 | 100.0 | 100.0 | 100.0 | 100.0 | 100.0 | 100.0 |
| all unpaid | 57.5 | 91.9 | 74.2 | 51.0 | 89.3 | 70.2 | 54.7 | 90.8 | 72.4 |
| all paid | 69.0 | 30.6 | 50.4 | 60.0 | 21.7 | 40.8 | 65.1 | 26.6 | 46.1 |
| all unpaid/paid | 80.9 | 92.5 | 86.5 | 75.3 | 91.5 | 83.5 | 78.5 | 92.0 | 85.2 |
Statement 8.1: Percentage of persons of age 6 years and above participating in a day in self development activities, unpaid activities and paid activities as a major activity (considering only the major activity of the time slots)
| Activity | rural | urban | rural+urban | ||||||
|---|---|---|---|---|---|---|---|---|---|
| male | female | person | male | female | person | male | female | person | |
| (1) | (2) | (3) | (4) | (5) | (6) | (7) | (8) | (9) | (10) |
| Nagaland | |||||||||
| self development/ self care/ self maintenance, etc. | 100.0 | 100.0 | 100.0 | 100.0 | 100.0 | 100.0 | 100.0 | 100.0 | 100.0 |
| all unpaid | 81.3 | 88.1 | 84.7 | 73.4 | 84.8 | 78.9 | 78.6 | 87.0 | 82.7 |
| all paid | 20.6 | 7.8 | 14.3 | 39.0 | 15.2 | 27.4 | 26.9 | 10.3 | 18.8 |
| all unpaid/paid | 84.2 | 88.6 | 86.4 | 80.6 | 86.3 | 83.4 | 83.0 | 87.8 | 85.4 |
| Odisha | |||||||||
| self development/ self care/ self maintenance, etc. | 100.0 | 100.0 | 100.0 | 100.0 | 100.0 | 100.0 | 100.0 | 100.0 | 100.0 |
| all unpaid | 43.5 | 82.5 | 63.3 | 41.9 | 79.9 | 61.5 | 43.2 | 82.0 | 63.0 |
| all paid | 55.9 | 15.1 | 35.1 | 58.9 | 13.3 | 35.3 | 56.4 | 14.8 | 35.2 |
| all unpaid/paid | 72.5 | 83.3 | 78.0 | 73.7 | 80.6 | 77.2 | 72.7 | 82.8 | 77.9 |
| Punjab | |||||||||
| self development/ self care/ self maintenance, etc. | 100.0 | 100.0 | 100.0 | 100.0 | 100.0 | 100.0 | 100.0 | 100.0 | 100.0 |
| all unpaid | 41.9 | 83.6 | 61.7 | 43.1 | 84.6 | 62.6 | 42.4 | 84.0 | 62.1 |
| all paid | 63.9 | 19.8 | 43.0 | 63.8 | 19.1 | 42.8 | 63.9 | 19.5 | 42.9 |
| all unpaid/paid | 75.6 | 84.4 | 79.8 | 77.1 | 85.3 | 81.0 | 76.2 | 84.8 | 80.3 |
| Rajasthan | |||||||||
| self development/ self care/ self maintenance, etc. | 100.0 | 100.0 | 100.0 | 100.0 | 100.0 | 100.0 | 100.0 | 100.0 | 100.0 |
| all unpaid | 45.9 | 84.8 | 66.0 | 35.9 | 81.3 | 57.3 | 43.1 | 83.9 | 63.7 |
| all paid | 52.8 | 27.1 | 39.5 | 59.5 | 16.2 | 39.0 | 54.7 | 24.4 | 39.4 |
| all unpaid/paid | 71.3 | 85.5 | 78.6 | 72.1 | 82.3 | 76.9 | 71.6 | 84.7 | 78.2 |
| Sikkim | |||||||||
| self development/ self care/ self maintenance, etc. | 100.0 | 100.0 | 100.0 | 100.0 | 100.0 | 100.0 | 100.0 | 100.0 | 100.0 |
| all unpaid | 70.8 | 89.9 | 80.1 | 68.8 | 94.8 | 80.8 | 70.3 | 91.1 | 80.2 |
| all paid | 64.9 | 25.2 | 45.5 | 65.2 | 28.5 | 48.3 | 65.0 | 26.0 | 46.2 |
| all unpaid/paid | 84.2 | 91.3 | 87.6 | 89.1 | 95.5 | 92.1 | 85.5 | 92.3 | 88.8 |
| Tamil Nadu | |||||||||
| self development/ self care/ self maintenance, etc. | 100.0 | 100.0 | 100.0 | 100.0 | 100.0 | 100.0 | 100.0 | 100.0 | 100.0 |
| all unpaid | 42.5 | 84.3 | 64.4 | 43.1 | 82.7 | 63.0 | 42.8 | 83.5 | 63.7 |
| all paid | 62.1 | 37.6 | 49.3 | 63.0 | 25.1 | 43.9 | 62.5 | 31.7 | 46.7 |
| all unpaid/paid | 75.7 | 85.8 | 81.0 | 77.7 | 84.8 | 81.3 | 76.7 | 85.3 | 81.1 |
| Telangana | |||||||||
| self development/ self care/ self maintenance, etc. | 100.0 | 100.0 | 100.0 | 100.0 | 100.0 | 100.0 | 100.0 | 100.0 | 100.0 |
| all unpaid | 50.8 | 85.9 | 68.7 | 50.4 | 80.6 | 65.2 | 50.6 | 83.7 | 67.2 |
| all paid | 66.7 | 42.5 | 54.3 | 58.5 | 23.7 | 41.5 | 63.2 | 34.8 | 48.9 |
| all unpaid/paid | 77.0 | 86.3 | 81.8 | 73.9 | 82.7 | 78.2 | 75.7 | 84.8 | 80.3 |
| Tripura | |||||||||
| self development/ self care/ self maintenance, etc. | 100.0 | 100.0 | 100.0 | 100.0 | 100.0 | 100.0 | 100.0 | 100.0 | 100.0 |
| all unpaid | 50.7 | 83.8 | 67.5 | 43.8 | 81.8 | 63.4 | 49.2 | 83.4 | 66.6 |
| all paid | 64.3 | 16.6 | 40.0 | 56.6 | 14.9 | 35.1 | 62.6 | 16.2 | 38.9 |
| all unpaid/paid | 76.6 | 84.5 | 80.6 | 71.7 | 82.9 | 77.5 | 75.6 | 84.2 | 79.9 |
| Uttar Pradesh | |||||||||
| self development/ self care/ self maintenance, etc. | 100.0 | 100.0 | 100.0 | 100.0 | 100.0 | 100.0 | 100.0 | 100.0 | 100.0 |
| all unpaid | 48.3 | 83.5 | 66.1 | 38.6 | 82.3 | 60.0 | 46.3 | 83.3 | 64.9 |
| all paid | 56.5 | 13.9 | 34.9 | 60.5 | 10.2 | 35.9 | 57.3 | 13.2 | 35.1 |
| all unpaid/paid | 73.2 | 84.3 | 78.8 | 72.6 | 83.2 | 77.8 | 73.0 | 84.1 | 78.6 |
Statement 8.1: Percentage of persons of age 6 years and above participating in a day in self development activities, unpaid activities and paid activities as a major activity (considering only the major activity of the time slots)
| Activity | rural | urban | rural+urban | ||||||
|---|---|---|---|---|---|---|---|---|---|
| male | female | person | male | female | person | male | female | person | |
| (1) | (2) | (3) | (4) | (5) | (6) | (7) | (8) | (9) | (10) |
| Uttarakhand | |||||||||
| self development/ self care/ self maintenance, etc. | 100.0 | 100.0 | 100.0 | 100.0 | 100.0 | 100.0 | 100.0 | 100.0 | 100.0 |
| all unpaid | 49.5 | 84.6 | 67.1 | 47.5 | 83.0 | 64.9 | 49.0 | 84.2 | 66.5 |
| all paid | 50.1 | 8.4 | 29.1 | 56.4 | 11.9 | 34.6 | 51.7 | 9.3 | 30.6 |
| all unpaid/paid | 73.8 | 85.4 | 79.6 | 75.6 | 84.1 | 79.8 | 74.3 | 85.0 | 79.7 |
| West Bengal | |||||||||
| self development/ self care/ self maintenance, etc. | 100.0 | 100.0 | 100.0 | 100.0 | 100.0 | 100.0 | 100.0 | 100.0 | 100.0 |
| all unpaid | 42.4 | 82.8 | 62.8 | 41.3 | 80.7 | 61.1 | 42.0 | 82.2 | 62.3 |
| all paid | 65.1 | 17.4 | 41.0 | 61.2 | 20.2 | 40.6 | 63.9 | 18.2 | 40.9 |
| all unpaid/paid | 76.4 | 83.4 | 79.9 | 74.8 | 83.2 | 79.0 | 75.9 | 83.4 | 79.7 |
| A \& N Islands | |||||||||
| self development/ self care/ self maintenance, etc. | 100.0 | 100.0 | 100.0 | 100.0 | 100.0 | 100.0 | 100.0 | 100.0 | 100.0 |
| all unpaid | 48.2 | 84.5 | 65.0 | 30.0 | 74.2 | 51.1 | 41.6 | 80.6 | 59.8 |
| all paid | 56.0 | 13.7 | 36.5 | 50.9 | 19.0 | 35.7 | 54.1 | 15.7 | 36.2 |
| all unpaid/paid | 74.4 | 84.9 | 79.3 | 65.1 | 75.3 | 70.0 | 71.0 | 81.3 | 75.8 |
| Chandigarh | |||||||||
| self development/ self care/ self maintenance, etc. | – | – | 100.0 | 100.0 | 100.0 | 100.0 | 100.0 | 100.0 | |
| all unpaid | – | – | – | 43.4 | 80.2 | 60.8 | 43.4 | 80.2 | 60.8 |
| all paid | – | – | – | 66.1 | 22.1 | 45.2 | 66.1 | 22.1 | 45.2 |
| all unpaid/paid | – | – | – | 77.1 | 81.4 | 79.1 | 77.1 | 81.4 | 79.1 |
| Dadra \& Nagar Haveli and Daman \& Diu | |||||||||
| self development/ self care/ self maintenance, etc. | 100.0 | 100.0 | 100.0 | 100.0 | 100.0 | 100.0 | 100.0 | 100.0 | 100.0 |
| all unpaid | 38.3 | 82.5 | 59.6 | 48.2 | 83.3 | 63.0 | 44.9 | 83.0 | 61.8 |
| all paid | 57.7 | 35.2 | 46.9 | 72.2 | 33.2 | 56.0 | 67.4 | 34.0 | 52.7 |
| all unpaid/paid | 70.1 | 84.4 | 77.0 | 78.7 | 83.5 | 80.7 | 75.8 | 83.9 | 79.4 |
| Jammu \& Kashmir | |||||||||
| self development/ self care/ self maintenance, etc. | 100.0 | 100.0 | 100.0 | 100.0 | 100.0 | 100.0 | 100.0 | 100.0 | 100.0 |
| all unpaid | 49.7 | 79.3 | 64.1 | 28.7 | 81.0 | 54.0 | 44.3 | 79.7 | 61.5 |
| all paid | 53.0 | 4.2 | 29.4 | 63.0 | 17.0 | 40.7 | 55.6 | 7.5 | 32.3 |
| all unpaid/paid | 73.0 | 80.0 | 76.4 | 73.3 | 81.9 | 77.5 | 73.1 | 80.4 | 76.6 |
| Ladakh | |||||||||
| self development/ self care/ self maintenance, etc. | 100.0 | 100.0 | 100.0 | 100.0 | 100.0 | 100.0 | 100.0 | 100.0 | 100.0 |
| all unpaid | 54.4 | 84.7 | 68.8 | 40.7 | 88.1 | 62.4 | 52.8 | 85.0 | 68.1 |
| all paid | 62.1 | 5.5 | 35.2 | 62.3 | 11.4 | 38.9 | 62.1 | 6.1 | 35.6 |
| all unpaid/paid | 78.0 | 85.1 | 81.4 | 74.7 | 88.3 | 81.0 | 77.6 | 85.5 | 81.3 |
| Lakshadweep | |||||||||
| self development/ self care/ self maintenance, etc. | 100.0 | 100.0 | 100.0 | 100.0 | 100.0 | 100.0 | 100.0 | 100.0 | 100.0 |
| all unpaid | 47.0 | 87.1 | 68.2 | 51.5 | 85.1 | 70.1 | 50.6 | 85.5 | 69.7 |
| all paid | 52.4 | 14.2 | 32.2 | 51.3 | 14.5 | 31.0 | 51.6 | 14.4 | 31.2 |
| all unpaid/paid | 77.6 | 88.3 | 83.3 | 76.9 | 85.1 | 81.4 | 77.0 | 85.7 | 81.8 |
| Puducherry | |||||||||
| self development/ self care/ self maintenance, etc. | 100.0 | 100.0 | 100.0 | 100.0 | 100.0 | 100.0 | 100.0 | 100.0 | 100.0 |
| all unpaid | 60.0 | 89.0 | 75.1 | 49.4 | 83.8 | 68.1 | 53.0 | 85.4 | 70.4 |
| all paid | 60.4 | 26.1 | 42.5 | 51.0 | 19.6 | 33.9 | 54.2 | 21.7 | 36.7 |
| all unpaid/paid | 80.6 | 90.0 | 85.5 | 75.8 | 85.2 | 80.9 | 77.5 | 86.7 | 82.5 |
| Statement 8.1: Percentage of persons of age 6 years and above participating in a day in self development activities, unpaid activities and paid activities as a major activity (considering only the major activity of the time slots) | |||||||||
|---|---|---|---|---|---|---|---|---|---|
| Activity | rural | urban | rural+urban | ||||||
| male | female | person | male | female | person | male | female | person | |
| (1) | (2) | (3) | (4) | (5) | (6) | (7) | (8) | (9) | (10) |
| All India | |||||||||
| self development/ self care/ self maintenance, etc. | 100.0 | 100.0 | 100.0 | 100.0 | 100.0 | 100.0 | 100.0 | 100.0 | 100.0 |
| all unpaid | 45.0 | 83.9 | 64.5 | 39.6 | 82.1 | 60.2 | 43.3 | 83.3 | 63.2 |
| all paid | 60.1 | 21.7 | 40.8 | 61.1 | 18.0 | 40.2 | 60.4 | 20.6 | 40.6 |
| all unpaid/paid | 73.8 | 84.6 | 79.3 | 73.9 | 83.7 | 78.7 | 73.9 | 84.4 | 79.1 |
Statement 9.1: Minutes spent in a day on an average per participant of age 6 years above in self development activity, unpaid activities and paid activities as a major activity (considering only the major activity of the time slots)
| Activities | rural | urban | rural+urban | ||||||
|---|---|---|---|---|---|---|---|---|---|
| male | female | person | male | female | person | male | female | person | |
| (1) | (2) | (3) | (4) | (5) | (6) | (7) | (8) | (9) | (10) |
| Andhra Pradesh | |||||||||
| self development/ self care/ self maintenance, etc. | 1117 | 1039 | 1078 | 1137 | 1080 | 1109 | 1124 | 1052 | 1088 |
| all unpaid | 102 | 314 | 256 | 102 | 346 | 274 | 102 | 324 | 262 |
| all paid | 441 | 364 | 414 | 466 | 370 | 441 | 449 | 366 | 421 |
| all unpaid/paid | 437 | 456 | 448 | 438 | 431 | 434 | 438 | 448 | 443 |
| Arunachal Pradesh | |||||||||
| self development/ self care/ self maintenance, etc. | 1088 | 933 | 1013 | 1117 | 967 | 1047 | 1094 | 940 | 1020 |
| all unpaid | 164 | 525 | 360 | 132 | 466 | 322 | 158 | 514 | 353 |
| all paid | 340 | 272 | 331 | 384 | 336 | 376 | 349 | 287 | 340 |
| all unpaid/paid | 424 | 559 | 492 | 405 | 513 | 459 | 420 | 549 | 486 |
| Assam | |||||||||
| self development/ self care/ self maintenance, etc. | 1124 | 1064 | 1094 | 1120 | 1083 | 1103 | 1123 | 1066 | 1095 |
| all unpaid | 119 | 415 | 299 | 116 | 380 | 272 | 119 | 411 | 296 |
| all paid | 398 | 282 | 380 | 442 | 349 | 427 | 403 | 289 | 385 |
| all unpaid/paid | 420 | 456 | 439 | 430 | 430 | 430 | 421 | 454 | 438 |
| Bihar | |||||||||
| self development/ self care/ self maintenance, etc. | 1162 | 1084 | 1123 | 1140 | 1095 | 1119 | 1159 | 1085 | 1123 |
| all unpaid | 142 | 417 | 318 | 122 | 401 | 301 | 140 | 415 | 316 |
| all paid | 395 | 233 | 368 | 462 | 316 | 444 | 403 | 240 | 376 |
| all unpaid/paid | 417 | 447 | 433 | 434 | 430 | 432 | 419 | 445 | 433 |
| Chhattisgarh | |||||||||
| self development/ self care/ self maintenance, etc. | 1123 | 1056 | 1089 | 1114 | 1108 | 1111 | 1121 | 1068 | 1094 |
| all unpaid | 202 | 342 | 293 | 119 | 327 | 264 | 187 | 339 | 287 |
| all paid | 404 | 327 | 377 | 480 | 353 | 444 | 422 | 331 | 391 |
| all unpaid/paid | 423 | 457 | 441 | 460 | 421 | 440 | 431 | 449 | 441 |
| Delhi | |||||||||
| self development/ self care/ self maintenance, etc. | 949 | 988 | 965 | 1036 | 1072 | 1051 | 1031 | 1068 | 1047 |
| all unpaid | 143 | 445 | 295 | 111 | 400 | 283 | 114 | 402 | 284 |
| all paid | 517 | 469 | 512 | 513 | 412 | 502 | 513 | 415 | 502 |
| all unpaid/paid | 593 | 525 | 565 | 525 | 452 | 492 | 529 | 455 | 496 |
| Goa | |||||||||
| self development/ self care/ self maintenance, etc. | 1109 | 1098 | 1103 | 1079 | 1101 | 1090 | 1090 | 1100 | 1095 |
| all unpaid | 137 | 328 | 268 | 98 | 326 | 241 | 112 | 327 | 253 |
| all paid | 477 | 442 | 468 | 486 | 450 | 476 | 483 | 447 | 473 |
| all unpaid/paid | 412 | 394 | 402 | 462 | 414 | 438 | 443 | 406 | 424 |
| Gujarat | |||||||||
| self development/ self care/ self maintenance, etc. | 1127 | 1035 | 1082 | 1088 | 1062 | 1075 | 1109 | 1047 | 1079 |
| all unpaid | 117 | 365 | 301 | 104 | 366 | 289 | 111 | 365 | 296 |
| all paid | 405 | 288 | 369 | 498 | 356 | 468 | 445 | 309 | 408 |
| all unpaid/paid | 412 | 464 | 439 | 483 | 440 | 461 | 443 | 454 | 449 |
| Haryana | |||||||||
| self development/ self care/ self maintenance, etc. | 1145 | 1066 | 1106 | 1086 | 1085 | 1086 | 1117 | 1074 | 1097 |
| all unpaid | 137 | 410 | 319 | 101 | 378 | 271 | 119 | 396 | 297 |
| all paid | 426 | 287 | 400 | 488 | 374 | 470 | 457 | 325 | 434 |
| all unpaid/paid | 427 | 455 | 442 | 474 | 437 | 457 | 450 | 447 | 449 |
Statement 9.1: Minutes spent in a day on an average per participant of age 6 years above in self development activity, unpaid activities and paid activities as a major activity (considering only the major activity of the time slots)
| Activities | rural | urban | rural+urban | ||||||
|---|---|---|---|---|---|---|---|---|---|
| male | female | person | male | female | person | male | female | person | |
| (1) | (2) | (3) | (4) | (5) | (6) | (7) | (8) | (9) | (10) |
| Himachal Pradesh | |||||||||
| self development/ self care/ self maintenance, etc. | 1127 | 1034 | 1078 | 1068 | 1085 | 1076 | 1119 | 1040 | 1078 |
| all unpaid | 158 | 425 | 331 | 116 | 331 | 246 | 153 | 415 | 321 |
| all paid | 435 | 249 | 388 | 484 | 398 | 463 | 442 | 271 | 400 |
| all unpaid/paid | 411 | 469 | 443 | 490 | 425 | 457 | 421 | 464 | 445 |
| Jharkhand | |||||||||
| self development/ self care/ self maintenance, etc. | 1121 | 1016 | 1068 | 1121 | 1064 | 1093 | 1121 | 1025 | 1073 |
| all unpaid | 163 | 446 | 338 | 118 | 400 | 300 | 156 | 437 | 331 |
| all paid | 414 | 246 | 371 | 475 | 331 | 446 | 426 | 259 | 385 |
| all unpaid/paid | 443 | 500 | 474 | 459 | 454 | 456 | 446 | 491 | 471 |
| Karnataka | |||||||||
| self development/ self care/ self maintenance, etc. | 1108 | 1039 | 1074 | 1099 | 1067 | 1084 | 1104 | 1050 | 1078 |
| all unpaid | 102 | 360 | 271 | 101 | 361 | 270 | 101 | 360 | 271 |
| all paid | 411 | 328 | 387 | 476 | 369 | 451 | 436 | 342 | 411 |
| all unpaid/paid | 423 | 461 | 443 | 449 | 443 | 446 | 434 | 455 | 445 |
| Kerala | |||||||||
| self development/ self care/ self maintenance, etc. | 1166 | 1075 | 1117 | 1159 | 1091 | 1122 | 1163 | 1082 | 1120 |
| all unpaid | 124 | 347 | 269 | 122 | 334 | 260 | 123 | 341 | 265 |
| all paid | 427 | 348 | 402 | 442 | 361 | 417 | 434 | 354 | 409 |
| all unpaid/paid | 367 | 425 | 400 | 381 | 416 | 401 | 374 | 421 | 400 |
| Madhya Pradesh | |||||||||
| self development/ self care/ self maintenance, etc. | 1115 | 1004 | 1062 | 1117 | 1075 | 1097 | 1116 | 1024 | 1072 |
| all unpaid | 149 | 418 | 309 | 117 | 377 | 290 | 142 | 406 | 304 |
| all paid | 377 | 293 | 355 | 447 | 339 | 428 | 397 | 302 | 374 |
| all unpaid/paid | 414 | 496 | 456 | 437 | 430 | 433 | 420 | 477 | 450 |
| Maharashtra | |||||||||
| self development/ self care/ self maintenance, etc. | 1121 | 1022 | 1072 | 1106 | 1084 | 1095 | 1115 | 1048 | 1082 |
| all unpaid | 120 | 341 | 273 | 97 | 338 | 267 | 111 | 340 | 270 |
| all paid | 415 | 342 | 391 | 485 | 386 | 463 | 445 | 355 | 418 |
| all unpaid/paid | 423 | 478 | 452 | 457 | 416 | 436 | 437 | 452 | 445 |
| Manipur | |||||||||
| self development/ self care/ self maintenance, etc. | 1149 | 1039 | 1096 | 1130 | 1029 | 1079 | 1143 | 1036 | 1090 |
| all unpaid | 142 | 377 | 282 | 127 | 358 | 263 | 137 | 371 | 276 |
| all paid | 382 | 296 | 352 | 414 | 323 | 376 | 391 | 306 | 360 |
| all unpaid/paid | 406 | 487 | 448 | 417 | 500 | 462 | 409 | 491 | 452 |
| Meghalaya | |||||||||
| self development/ self care/ self maintenance, etc. | 1161 | 1085 | 1122 | 1136 | 1110 | 1122 | 1157 | 1090 | 1122 |
| all unpaid | 133 | 349 | 270 | 121 | 321 | 249 | 131 | 344 | 266 |
| all paid | 413 | 355 | 397 | 450 | 405 | 438 | 420 | 364 | 405 |
| all unpaid/paid | 376 | 422 | 401 | 388 | 400 | 394 | 378 | 418 | 400 |
| Mizoram | |||||||||
| self development/ self care/ self maintenance, etc. | 1106 | 987 | 1048 | 1125 | 1031 | 1078 | 1114 | 1007 | 1061 |
| all unpaid | 126 | 378 | 278 | 132 | 367 | 282 | 128 | 373 | 280 |
| all paid | 380 | 343 | 369 | 413 | 375 | 403 | 393 | 355 | 382 |
| all unpaid/paid | 413 | 490 | 453 | 418 | 447 | 434 | 415 | 471 | 445 |
Statement 9.1: Minutes spent in a day on an average per participant of age 6 years above in self development activity, unpaid activities and paid activities as a major activity (considering only the major activity of the time slots)
| Activities | rural | urban | rural+urban | ||||||
|---|---|---|---|---|---|---|---|---|---|
| male | female | person | male | female | person | male | female | person | |
| (1) | (2) | (3) | (4) | (5) | (6) | (7) | (8) | (9) | (10) |
| Nagaland | |||||||||
| self development/ self care/ self maintenance, etc. | 1150 | 1049 | 1101 | 1171 | 1077 | 1126 | 1158 | 1059 | 1109 |
| all unpaid | 279 | 424 | 353 | 168 | 375 | 276 | 243 | 408 | 328 |
| all paid | 306 | 215 | 281 | 373 | 299 | 353 | 339 | 257 | 317 |
| all unpaid/paid | 344 | 441 | 393 | 333 | 420 | 377 | 340 | 434 | 388 |
| Odisha | |||||||||
| self development/ self care/ self maintenance, etc. | 1161 | 1071 | 1115 | 1133 | 1121 | 1127 | 1156 | 1080 | 1117 |
| all unpaid | 165 | 395 | 317 | 115 | 343 | 268 | 157 | 386 | 309 |
| all paid | 371 | 286 | 352 | 439 | 338 | 419 | 383 | 294 | 364 |
| all unpaid/paid | 385 | 443 | 416 | 416 | 396 | 405 | 390 | 435 | 414 |
| Punjab | |||||||||
| self development/ self care/ self maintenance, etc. | 1105 | 1075 | 1091 | 1081 | 1073 | 1077 | 1096 | 1075 | 1086 |
| all unpaid | 123 | 372 | 283 | 116 | 351 | 265 | 120 | 364 | 276 |
| all paid | 443 | 273 | 406 | 484 | 363 | 459 | 459 | 308 | 427 |
| all unpaid/paid | 443 | 432 | 437 | 466 | 430 | 448 | 452 | 431 | 442 |
| Rajasthan | |||||||||
| self development/ self care/ self maintenance, etc. | 1148 | 1037 | 1091 | 1120 | 1113 | 1117 | 1140 | 1056 | 1098 |
| all unpaid | 158 | 389 | 311 | 109 | 337 | 262 | 146 | 376 | 299 |
| all paid | 416 | 269 | 364 | 473 | 329 | 444 | 433 | 279 | 385 |
| all unpaid/paid | 409 | 471 | 444 | 444 | 398 | 421 | 419 | 453 | 438 |
| Sikkim | |||||||||
| self development/ self care/ self maintenance, etc. | 1080 | 1044 | 1063 | 1036 | 1006 | 1022 | 1069 | 1035 | 1052 |
| all unpaid | 160 | 359 | 269 | 128 | 344 | 245 | 152 | 355 | 263 |
| all paid | 380 | 290 | 355 | 485 | 379 | 456 | 407 | 314 | 382 |
| all unpaid/paid | 427 | 434 | 430 | 453 | 454 | 454 | 434 | 439 | 437 |
| Tamil Nadu | |||||||||
| self development/ self care/ self maintenance, etc. | 1124 | 1069 | 1095 | 1098 | 1081 | 1089 | 1111 | 1075 | 1092 |
| all unpaid | 101 | 288 | 229 | 99 | 316 | 242 | 100 | 301 | 235 |
| all paid | 440 | 341 | 400 | 475 | 391 | 451 | 457 | 359 | 423 |
| all unpaid/paid | 418 | 432 | 426 | 440 | 424 | 431 | 429 | 428 | 429 |
| Telangana | |||||||||
| self development/ self care/ self maintenance, etc. | 1121 | 1026 | 1073 | 1120 | 1074 | 1097 | 1121 | 1046 | 1083 |
| all unpaid | 102 | 314 | 237 | 98 | 343 | 246 | 101 | 325 | 241 |
| all paid | 400 | 339 | 376 | 462 | 380 | 439 | 425 | 351 | 398 |
| all unpaid/paid | 414 | 480 | 449 | 433 | 443 | 438 | 422 | 465 | 445 |
| Tripura | |||||||||
| self development/ self care/ self maintenance, etc. | 1131 | 1074 | 1102 | 1149 | 1111 | 1129 | 1135 | 1083 | 1108 |
| all unpaid | 135 | 382 | 291 | 118 | 345 | 269 | 132 | 374 | 286 |
| all paid | 374 | 274 | 353 | 424 | 313 | 400 | 384 | 282 | 362 |
| all unpaid/paid | 403 | 433 | 419 | 406 | 397 | 401 | 404 | 425 | 415 |
| Uttar Pradesh | |||||||||
| self development/ self care/ self maintenance, etc. | 1127 | 1058 | 1092 | 1110 | 1080 | 1096 | 1123 | 1062 | 1093 |
| all unpaid | 166 | 418 | 327 | 117 | 394 | 303 | 157 | 413 | 322 |
| all paid | 412 | 238 | 377 | 471 | 348 | 454 | 425 | 255 | 393 |
| all unpaid/paid | 428 | 453 | 442 | 454 | 432 | 443 | 433 | 449 | 442 |
Statement 9.1: Minutes spent in a day on an average per participant of age 6 years above in self development activity, unpaid activities and paid activities as a major activity (considering only the major activity of the time slots)
| Activities | rural | urban | rural+urban | ||||||
|---|---|---|---|---|---|---|---|---|---|
| male | female | person | male | female | person | male | female | person | |
| (1) | (2) | (3) | (4) | (5) | (6) | (7) | (8) | (9) | (10) |
| Uttarakhand | |||||||||
| self development/ self care/ self maintenance, etc. | 1166 | 1081 | 1123 | 1146 | 1113 | 1130 | 1160 | 1089 | 1125 |
| all unpaid | 153 | 398 | 308 | 107 | 344 | 255 | 141 | 384 | 294 |
| all paid | 397 | 270 | 379 | 431 | 346 | 417 | 407 | 295 | 390 |
| all unpaid/paid | 372 | 421 | 398 | 388 | 389 | 388 | 376 | 413 | 396 |
| West Bengal | |||||||||
| self development/ self care/ self maintenance, etc. | 1124 | 1063 | 1093 | 1113 | 1085 | 1099 | 1121 | 1070 | 1095 |
| all unpaid | 132 | 398 | 309 | 111 | 356 | 274 | 125 | 386 | 299 |
| all paid | 400 | 270 | 372 | 459 | 334 | 427 | 417 | 292 | 389 |
| all unpaid/paid | 414 | 452 | 434 | 437 | 427 | 431 | 420 | 444 | 433 |
| A \& N Islands | |||||||||
| self development/ self care/ self maintenance, etc. | 1100 | 1056 | 1080 | 1152 | 1101 | 1128 | 1119 | 1073 | 1098 |
| all unpaid | 179 | 386 | 303 | 121 | 345 | 277 | 164 | 372 | 295 |
| all paid | 452 | 422 | 447 | 494 | 433 | 478 | 467 | 427 | 459 |
| all unpaid/paid | 456 | 453 | 454 | 442 | 450 | 446 | 451 | 452 | 452 |
| Chandigarh | |||||||||
| self development/ self care/ self maintenance, etc. | 1075 | 1084 | 1079 | 1075 | 1084 | 1079 | |||
| all unpaid | 126 | 342 | 261 | 126 | 342 | 261 | |||
| all paid | 471 | 371 | 448 | 471 | 371 | 448 | |||
| all unpaid/paid | 474 | 437 | 456 | 474 | 437 | 456 | |||
| Dadra \& Nagar Haveli and Daman \& Diu | |||||||||
| self development/ self care/ self maintenance, etc. | 1089 | 1048 | 1069 | 967 | 1035 | 995 | 1008 | 1040 | 1022 |
| all unpaid | 107 | 298 | 234 | 102 | 298 | 211 | 103 | 298 | 219 |
| all paid | 537 | 415 | 493 | 587 | 470 | 557 | 573 | 448 | 537 |
| all unpaid/paid | 500 | 464 | 481 | 602 | 485 | 551 | 570 | 477 | 527 |
| Jammu \& Kashmir | |||||||||
| self development/ self care/ self maintenance, etc. | 1140 | 1085 | 1113 | 1118 | 1066 | 1093 | 1134 | 1080 | 1108 |
| all unpaid | 156 | 431 | 321 | 110 | 394 | 316 | 148 | 422 | 320 |
| all paid | 420 | 318 | 413 | 462 | 318 | 433 | 432 | 318 | 419 |
| all unpaid/paid | 411 | 444 | 428 | 439 | 456 | 448 | 419 | 447 | 433 |
| Ladakh | |||||||||
| self development/ self care/ self maintenance, etc. | 1125 | 1033 | 1082 | 1133 | 1041 | 1091 | 1126 | 1034 | 1083 |
| all unpaid | 112 | 459 | 316 | 110 | 408 | 303 | 112 | 454 | 314 |
| all paid | 408 | 325 | 402 | 421 | 347 | 411 | 409 | 330 | 403 |
| all unpaid/paid | 403 | 478 | 441 | 411 | 452 | 431 | 404 | 475 | 439 |
| Lakshadweep | |||||||||
| self development/ self care/ self maintenance, etc. | 1158 | 1095 | 1124 | 1161 | 1093 | 1123 | 1160 | 1093 | 1123 |
| all unpaid | 134 | 352 | 281 | 132 | 359 | 285 | 133 | 358 | 284 |
| all paid | 419 | 275 | 385 | 410 | 288 | 378 | 412 | 285 | 380 |
| all unpaid/paid | 364 | 391 | 379 | 362 | 408 | 389 | 363 | 405 | 387 |
| Puducherry | |||||||||
| self development/ self care/ self maintenance, etc. | 1070 | 1024 | 1046 | 1124 | 1077 | 1098 | 1106 | 1060 | 1081 |
| all unpaid | 132 | 350 | 267 | 134 | 340 | 272 | 133 | 343 | 270 |
| all paid | 482 | 401 | 456 | 490 | 397 | 461 | 487 | 399 | 459 |
| all unpaid/paid | 459 | 462 | 461 | 417 | 426 | 422 | 432 | 438 | 435 |
Statement 9.1: Minutes spent in a day on an average per participant of age 6 years above in self development activity, unpaid activities and paid activities as a major activity (considering only the major activity of the time slots)
| Activities | rural | urban | rural+urban | ||||||
|---|---|---|---|---|---|---|---|---|---|
| male | female | person | male | female | person | male | female | person | |
| (1) | (2) | (3) | (4) | (5) | (6) | (7) | (8) | (9) | (10) |
| All India | |||||||||
| self development/ self care/ self maintenance, etc. | 1131 | 1052 | 1091 | 1108 | 1082 | 1095 | 1124 | 1061 | 1093 |
| all unpaid | 141 | 385 | 301 | 109 | 357 | 273 | 132 | 377 | 292 |
| all paid | 408 | 299 | 379 | 474 | 364 | 450 | 429 | 316 | 401 |
| all unpaid/paid | 418 | 459 | 440 | 450 | 428 | 439 | 428 | 449 | 439 |
Statement 10.1: Minutes spent in a day on an average per person in self development activity, unpaid activities and paid activities as a major activity (considering only the major activity of the time slots)
| Activity | rural | urban | rural+urban | ||||||
|---|---|---|---|---|---|---|---|---|---|
| male | female | person | male | female | person | male | female | person | |
| (1) | (2) | (3) | (4) | (5) | (6) | (7) | (8) | (9) | (10) |
| Andhra Pradesh | |||||||||
| self development/ self care/ self maintenance, etc. | 1117 | 1039 | 1078 | 1137 | 1080 | 1109 | 1124 | 1052 | 1088 |
| all unpaid | 34 | 272 | 154 | 35 | 284 | 160 | 34 | 276 | 156 |
| all paid | 289 | 129 | 208 | 267 | 76 | 171 | 282 | 112 | 196 |
| all unpaid/paid | 323 | 401 | 362 | 303 | 360 | 331 | 316 | 388 | 352 |
| Arunachal Pradesh | |||||||||
| self development/ self care/ self maintenance, etc. | 1088 | 933 | 1013 | 1117 | 967 | 1047 | 1094 | 940 | 1020 |
| all unpaid | 118 | 476 | 291 | 81 | 426 | 242 | 110 | 466 | 281 |
| all paid | 235 | 31 | 136 | 242 | 47 | 151 | 236 | 34 | 139 |
| all unpaid/paid | 352 | 507 | 427 | 323 | 473 | 393 | 346 | 500 | 420 |
| Assam | |||||||||
| self development/ self care/ self maintenance, etc. | 1124 | 1064 | 1094 | 1120 | 1083 | 1103 | 1123 | 1066 | 1095 |
| all unpaid | 62 | 341 | 200 | 57 | 311 | 175 | 61 | 338 | 197 |
| all paid | 254 | 35 | 146 | 263 | 46 | 162 | 255 | 36 | 148 |
| all unpaid/paid | 316 | 376 | 346 | 320 | 357 | 337 | 317 | 374 | 345 |
| Bihar | |||||||||
| self development/ self care/ self maintenance, etc. | 1162 | 1084 | 1123 | 1140 | 1095 | 1119 | 1159 | 1085 | 1123 |
| all unpaid | 64 | 331 | 197 | 49 | 318 | 177 | 62 | 330 | 195 |
| all paid | 214 | 25 | 120 | 251 | 27 | 144 | 219 | 25 | 123 |
| all unpaid/paid | 278 | 356 | 317 | 300 | 345 | 321 | 281 | 355 | 317 |
| Chhattisgarh | |||||||||
| self development/ self care/ self maintenance, etc. | 1123 | 1056 | 1089 | 1114 | 1108 | 1111 | 1121 | 1068 | 1094 |
| all unpaid | 91 | 284 | 188 | 41 | 251 | 146 | 80 | 276 | 179 |
| all paid | 226 | 100 | 163 | 286 | 81 | 183 | 240 | 96 | 167 |
| all unpaid/paid | 317 | 384 | 351 | 326 | 332 | 329 | 319 | 372 | 346 |
| Delhi | |||||||||
| self development/ self care/ self maintenance, etc. | 949 | 988 | 965 | 1036 | 1072 | 1051 | 1031 | 1068 | 1047 |
| all unpaid | 83 | 383 | 205 | 48 | 322 | 168 | 50 | 325 | 170 |
| all paid | 407 | 69 | 270 | 356 | 46 | 220 | 359 | 47 | 223 |
| all unpaid/paid | 491 | 452 | 475 | 404 | 368 | 389 | 409 | 372 | 393 |
| Goa | |||||||||
| self development/ self care/ self maintenance, etc. | 1109 | 1098 | 1103 | 1079 | 1101 | 1090 | 1090 | 1100 | 1095 |
| all unpaid | 51 | 255 | 156 | 37 | 216 | 125 | 42 | 232 | 137 |
| all paid | 280 | 87 | 181 | 324 | 123 | 226 | 307 | 109 | 208 |
| all unpaid/paid | 331 | 342 | 337 | 361 | 339 | 350 | 350 | 340 | 345 |
| Gujarat | |||||||||
| self development/ self care/ self maintenance, etc. | 1127 | 1035 | 1082 | 1088 | 1062 | 1075 | 1109 | 1047 | 1079 |
| all unpaid | 34 | 312 | 170 | 32 | 310 | 163 | 33 | 311 | 167 |
| all paid | 279 | 93 | 188 | 320 | 69 | 202 | 298 | 83 | 194 |
| all unpaid/paid | 313 | 405 | 358 | 352 | 378 | 365 | 331 | 393 | 361 |
| Haryana | |||||||||
| self development/ self care/ self maintenance, etc. | 1145 | 1066 | 1106 | 1086 | 1085 | 1086 | 1117 | 1074 | 1097 |
| all unpaid | 52 | 333 | 189 | 43 | 304 | 162 | 48 | 321 | 177 |
| all paid | 243 | 41 | 145 | 311 | 51 | 192 | 275 | 45 | 166 |
| all unpaid/paid | 295 | 374 | 334 | 354 | 355 | 354 | 323 | 366 | 343 |
Statement 10.1: Minutes spent in a day on an average per person in self development activity, unpaid activities and paid activities as a major activity (considering only the major activity of the time slots)
| Activity | rural | urban | rural+urban | ||||||
|---|---|---|---|---|---|---|---|---|---|
| male | female | person | male | female | person | male | female | person | |
| (1) | (2) | (3) | (4) | (5) | (6) | (7) | (8) | (9) | (10) |
| Himachal Pradesh | |||||||||
| self development/ self care/ self maintenance, etc. | 1127 | 1034 | 1078 | 1068 | 1085 | 1076 | 1119 | 1040 | 1078 |
| all unpaid | 81 | 366 | 229 | 57 | 264 | 157 | 77 | 354 | 220 |
| all paid | 233 | 41 | 133 | 315 | 91 | 207 | 244 | 46 | 142 |
| all unpaid/paid | 313 | 406 | 362 | 372 | 355 | 364 | 321 | 400 | 362 |
| Jharkhand | |||||||||
| self development/ self care/ self maintenance, etc. | 1121 | 1016 | 1068 | 1121 | 1064 | 1093 | 1121 | 1025 | 1073 |
| all unpaid | 86 | 376 | 232 | 51 | 327 | 186 | 79 | 367 | 223 |
| all paid | 233 | 48 | 140 | 268 | 49 | 161 | 240 | 48 | 144 |
| all unpaid/paid | 319 | 424 | 372 | 319 | 376 | 347 | 319 | 415 | 367 |
| Karnataka | |||||||||
| self development/ self care/ self maintenance, etc. | 1108 | 1039 | 1074 | 1099 | 1067 | 1084 | 1104 | 1050 | 1078 |
| all unpaid | 46 | 308 | 178 | 40 | 293 | 160 | 43 | 303 | 171 |
| all paid | 286 | 93 | 189 | 301 | 79 | 196 | 292 | 87 | 192 |
| all unpaid/paid | 332 | 401 | 366 | 341 | 373 | 356 | 336 | 390 | 362 |
| Kerala | |||||||||
| self development/ self care/ self maintenance, etc. | 1166 | 1075 | 1117 | 1159 | 1091 | 1122 | 1163 | 1082 | 1120 |
| all unpaid | 64 | 296 | 187 | 62 | 278 | 177 | 63 | 287 | 182 |
| all paid | 210 | 70 | 135 | 219 | 71 | 140 | 214 | 71 | 138 |
| all unpaid/paid | 274 | 365 | 323 | 281 | 349 | 318 | 277 | 358 | 320 |
| Madhya Pradesh | |||||||||
| self development/ self care/ self maintenance, etc. | 1115 | 1004 | 1062 | 1117 | 1075 | 1097 | 1116 | 1024 | 1072 |
| all unpaid | 83 | 365 | 219 | 47 | 316 | 178 | 72 | 351 | 207 |
| all paid | 242 | 71 | 159 | 276 | 49 | 166 | 252 | 65 | 161 |
| all unpaid/paid | 325 | 436 | 378 | 323 | 365 | 343 | 324 | 416 | 368 |
| Maharashtra | |||||||||
| self development/ self care/ self maintenance, etc. | 1121 | 1022 | 1072 | 1106 | 1084 | 1095 | 1115 | 1048 | 1082 |
| all unpaid | 44 | 296 | 168 | 31 | 283 | 152 | 39 | 291 | 161 |
| all paid | 274 | 122 | 200 | 303 | 73 | 193 | 287 | 101 | 197 |
| all unpaid/paid | 319 | 418 | 368 | 334 | 356 | 345 | 325 | 392 | 358 |
| Manipur | |||||||||
| self development/ self care/ self maintenance, etc. | 1149 | 1039 | 1096 | 1130 | 1029 | 1079 | 1143 | 1036 | 1090 |
| all unpaid | 75 | 306 | 187 | 74 | 288 | 183 | 74 | 300 | 186 |
| all paid | 217 | 95 | 157 | 235 | 123 | 178 | 222 | 104 | 164 |
| all unpaid/paid | 291 | 401 | 344 | 310 | 411 | 361 | 297 | 404 | 350 |
| Meghalaya | |||||||||
| self development/ self care/ self maintenance, etc. | 1161 | 1085 | 1122 | 1136 | 1110 | 1122 | 1157 | 1090 | 1122 |
| all unpaid | 69 | 291 | 183 | 62 | 260 | 167 | 68 | 285 | 180 |
| all paid | 210 | 63 | 135 | 241 | 70 | 151 | 216 | 65 | 138 |
| all unpaid/paid | 279 | 355 | 318 | 304 | 330 | 318 | 283 | 350 | 318 |
| Mizoram | |||||||||
| self development/ self care/ self maintenance, etc. | 1106 | 987 | 1048 | 1125 | 1031 | 1078 | 1114 | 1007 | 1061 |
| all unpaid | 72 | 348 | 206 | 67 | 328 | 198 | 70 | 339 | 203 |
| all paid | 262 | 105 | 186 | 247 | 81 | 164 | 256 | 94 | 176 |
| all unpaid/paid | 334 | 453 | 392 | 315 | 409 | 362 | 326 | 433 | 379 |
Statement 10.1: Minutes spent in a day on an average per person in self development activity, unpaid activities and paid activities as a major activity (considering only the major activity of the time slots)
| Activity | rural | urban | rural+urban | ||||||
|---|---|---|---|---|---|---|---|---|---|
| male | female | person | male | female | person | male | female | person | |
| (1) | (2) | (3) | (4) | (5) | (6) | (7) | (8) | (9) | (10) |
| Nagaland | |||||||||
| self development/ self care/ self maintenance, etc. | 1150 | 1049 | 1101 | 1171 | 1077 | 1126 | 1158 | 1059 | 1109 |
| all unpaid | 227 | 374 | 299 | 123 | 318 | 218 | 191 | 355 | 271 |
| all paid | 63 | 17 | 40 | 145 | 45 | 97 | 91 | 27 | 60 |
| all unpaid/paid | 290 | 391 | 339 | 269 | 363 | 314 | 282 | 381 | 331 |
| Odisha | |||||||||
| self development/ self care/ self maintenance, etc. | 1161 | 1071 | 1115 | 1133 | 1121 | 1127 | 1156 | 1080 | 1117 |
| all unpaid | 72 | 325 | 201 | 48 | 274 | 165 | 68 | 317 | 195 |
| all paid | 207 | 43 | 124 | 258 | 45 | 148 | 216 | 44 | 128 |
| all unpaid/paid | 279 | 369 | 325 | 307 | 319 | 313 | 284 | 360 | 323 |
| Punjab | |||||||||
| self development/ self care/ self maintenance, etc. | 1105 | 1075 | 1091 | 1081 | 1073 | 1077 | 1096 | 1075 | 1086 |
| all unpaid | 51 | 311 | 175 | 50 | 297 | 166 | 51 | 305 | 171 |
| all paid | 283 | 54 | 174 | 309 | 69 | 196 | 293 | 60 | 183 |
| all unpaid/paid | 335 | 365 | 349 | 359 | 367 | 363 | 344 | 365 | 354 |
| Rajasthan | |||||||||
| self development/ self care/ self maintenance, etc. | 1148 | 1037 | 1091 | 1120 | 1113 | 1117 | 1140 | 1056 | 1098 |
| all unpaid | 72 | 330 | 205 | 39 | 274 | 150 | 63 | 316 | 190 |
| all paid | 219 | 73 | 144 | 281 | 53 | 174 | 237 | 68 | 152 |
| all unpaid/paid | 292 | 403 | 349 | 320 | 327 | 323 | 300 | 384 | 342 |
| Sikkim | |||||||||
| self development/ self care/ self maintenance, etc. | 1080 | 1044 | 1063 | 1036 | 1006 | 1022 | 1069 | 1035 | 1052 |
| all unpaid | 113 | 323 | 215 | 88 | 326 | 198 | 107 | 324 | 211 |
| all paid | 246 | 73 | 162 | 316 | 108 | 220 | 265 | 82 | 177 |
| all unpaid/paid | 360 | 396 | 377 | 404 | 434 | 418 | 371 | 405 | 388 |
| Tamil Nadu | |||||||||
| self development/ self care/ self maintenance, etc. | 1124 | 1069 | 1095 | 1098 | 1081 | 1089 | 1111 | 1075 | 1092 |
| all unpaid | 43 | 243 | 148 | 43 | 261 | 153 | 43 | 251 | 150 |
| all paid | 273 | 128 | 197 | 299 | 98 | 198 | 286 | 114 | 198 |
| all unpaid/paid | 316 | 371 | 345 | 342 | 359 | 351 | 329 | 365 | 348 |
| Telangana | |||||||||
| self development/ self care/ self maintenance, etc. | 1121 | 1026 | 1073 | 1120 | 1074 | 1097 | 1121 | 1046 | 1083 |
| all unpaid | 52 | 270 | 163 | 50 | 276 | 161 | 51 | 272 | 162 |
| all paid | 267 | 144 | 204 | 270 | 90 | 182 | 268 | 122 | 195 |
| all unpaid/paid | 319 | 414 | 367 | 320 | 366 | 343 | 319 | 394 | 357 |
| Tripura | |||||||||
| self development/ self care/ self maintenance, etc. | 1131 | 1074 | 1102 | 1149 | 1111 | 1129 | 1135 | 1083 | 1108 |
| all unpaid | 68 | 320 | 197 | 51 | 282 | 170 | 65 | 312 | 191 |
| all paid | 240 | 45 | 141 | 240 | 47 | 140 | 240 | 46 | 141 |
| all unpaid/paid | 309 | 366 | 338 | 291 | 329 | 311 | 305 | 357 | 332 |
| Uttar Pradesh | |||||||||
| self development/ self care/ self maintenance, etc. | 1127 | 1058 | 1092 | 1110 | 1080 | 1096 | 1123 | 1062 | 1093 |
| all unpaid | 80 | 349 | 216 | 45 | 324 | 182 | 73 | 344 | 209 |
| all paid | 233 | 33 | 132 | 285 | 36 | 163 | 244 | 34 | 138 |
| all unpaid/paid | 313 | 382 | 348 | 330 | 360 | 344 | 317 | 378 | 347 |
Statement 10.1: Minutes spent in a day on an average per person in self development activity, unpaid activities and paid activities as a major activity (considering only the major activity of the time slots)
| Activity | rural | urban | rural+urban | ||||||
|---|---|---|---|---|---|---|---|---|---|
| male | female | person | male | female | person | male | female | person | |
| (1) | (2) | (3) | (4) | (5) | (6) | (7) | (8) | (9) | (10) |
| Uttarakhand | |||||||||
| self development/ self care/ self maintenance, etc. | 1166 | 1081 | 1123 | 1146 | 1113 | 1130 | 1160 | 1089 | 1125 |
| all unpaid | 76 | 336 | 207 | 51 | 286 | 166 | 69 | 323 | 196 |
| all paid | 199 | 23 | 110 | 243 | 41 | 144 | 211 | 27 | 119 |
| all unpaid/paid | 274 | 359 | 317 | 294 | 327 | 310 | 280 | 351 | 315 |
| West Bengal | |||||||||
| self development/ self care/ self maintenance, etc. | 1124 | 1063 | 1093 | 1113 | 1085 | 1099 | 1121 | 1070 | 1095 |
| all unpaid | 56 | 330 | 194 | 46 | 288 | 167 | 53 | 317 | 186 |
| all paid | 260 | 47 | 152 | 281 | 68 | 174 | 266 | 53 | 159 |
| all unpaid/paid | 316 | 377 | 347 | 327 | 355 | 341 | 319 | 370 | 345 |
| A \& N Islands | |||||||||
| self development/ self care/ self maintenance, etc. | 1100 | 1056 | 1080 | 1152 | 1101 | 1128 | 1119 | 1073 | 1098 |
| all unpaid | 87 | 326 | 197 | 36 | 256 | 141 | 68 | 300 | 176 |
| all paid | 253 | 58 | 163 | 251 | 82 | 171 | 253 | 67 | 166 |
| all unpaid/paid | 340 | 384 | 360 | 288 | 339 | 312 | 321 | 367 | 342 |
| Chandigarh | |||||||||
| self development/ self care/ self maintenance, etc. | – | – | – | 1075 | 1084 | 1079 | 1075 | 1084 | 1079 |
| all unpaid | – | – | – | 55 | 274 | 159 | 55 | 274 | 159 |
| all paid | – | – | – | 311 | 82 | 203 | 311 | 82 | 203 |
| all unpaid/paid | – | – | – | 365 | 356 | 361 | 365 | 356 | 361 |
| Dadra \& Nagar Haveli and Daman \& Diu | |||||||||
| self development/ self care/ self maintenance, etc. | 1089 | 1048 | 1069 | 967 | 1035 | 995 | 1008 | 1040 | 1022 |
| all unpaid | 41 | 246 | 140 | 49 | 249 | 133 | 46 | 247 | 135 |
| all paid | 310 | 146 | 231 | 424 | 156 | 312 | 386 | 152 | 283 |
| all unpaid/paid | 351 | 392 | 371 | 473 | 405 | 445 | 432 | 400 | 418 |
| Jammu \& Kashmir | |||||||||
| self development/ self care/ self maintenance, etc. | 1140 | 1085 | 1113 | 1118 | 1066 | 1093 | 1134 | 1080 | 1108 |
| all unpaid | 78 | 342 | 206 | 31 | 319 | 171 | 66 | 336 | 197 |
| all paid | 223 | 14 | 121 | 291 | 54 | 176 | 240 | 24 | 135 |
| all unpaid/paid | 300 | 355 | 327 | 322 | 374 | 347 | 306 | 360 | 332 |
| Ladakh | |||||||||
| self development/ self care/ self maintenance, etc. | 1125 | 1033 | 1082 | 1133 | 1041 | 1091 | 1126 | 1034 | 1083 |
| all unpaid | 61 | 389 | 217 | 45 | 359 | 189 | 59 | 386 | 214 |
| all paid | 253 | 18 | 141 | 262 | 40 | 160 | 254 | 20 | 143 |
| all unpaid/paid | 315 | 407 | 358 | 307 | 399 | 349 | 314 | 406 | 357 |
| Lakshadweep | |||||||||
| self development/ self care/ self maintenance, etc. | 1158 | 1095 | 1124 | 1161 | 1093 | 1123 | 1160 | 1093 | 1123 |
| all unpaid | 63 | 307 | 192 | 68 | 306 | 200 | 67 | 306 | 198 |
| all paid | 219 | 39 | 124 | 210 | 42 | 117 | 212 | 41 | 119 |
| all unpaid/paid | 282 | 345 | 316 | 279 | 347 | 317 | 280 | 347 | 317 |
| Puducherry | |||||||||
| self development/ self care/ self maintenance, etc. | 1070 | 1024 | 1046 | 1124 | 1077 | 1098 | 1106 | 1060 | 1081 |
| all unpaid | 79 | 311 | 200 | 66 | 285 | 186 | 71 | 293 | 190 |
| all paid | 291 | 105 | 194 | 250 | 78 | 156 | 264 | 87 | 169 |
| all unpaid/paid | 370 | 416 | 394 | 316 | 363 | 342 | 334 | 380 | 359 |
Statement 10.1: Minutes spent in a day on an average per person in self development activity, unpaid activities and paid activities as a major activity (considering only the major activity of the time slots)
| Activity | rural | urban | rural+urban | ||||||
|---|---|---|---|---|---|---|---|---|---|
| male | female | person | male | female | person | male | female | person | |
| (1) | (2) | (3) | (4) | (5) | (6) | (7) | (8) | (9) | (10) |
| All India | |||||||||
| self development/ self care/ self maintenance, etc. | 1131 | 1052 | 1091 | 1108 | 1082 | 1095 | 1124 | 1061 | 1093 |
| all unpaid | 64 | 323 | 194 | 43 | 293 | 164 | 57 | 314 | 185 |
| all paid | 245 | 65 | 155 | 290 | 65 | 181 | 259 | 65 | 163 |
| all unpaid/paid | 309 | 388 | 349 | 332 | 358 | 345 | 316 | 379 | 347 |
Statement 11.1: Percentage of persons participating in a day in self development activity, unpaid activities and paid activities irrespective of whether it is a major activity or not (considering all the activities in a time slot)
| Activity | rural | urban | rural+urban | ||||||
|---|---|---|---|---|---|---|---|---|---|
| male | female | person | male | female | person | male | female | person | |
| (1) | (2) | (3) | (4) | (5) | (6) | (7) | (8) | (9) | (10) |
| Andhra Pradesh | |||||||||
| self development/ self care/ self maintenance, etc. | 100.0 | 100.0 | 100.0 | 100.0 | 100.0 | 100.0 | 100.0 | 100.0 | 100.0 |
| all unpaid | 35.0 | 87.0 | 61.3 | 35.7 | 82.5 | 59.1 | 35.2 | 85.5 | 60.6 |
| all paid | 65.5 | 35.5 | 50.3 | 57.5 | 20.4 | 38.9 | 62.8 | 30.6 | 46.6 |
| all unpaid/paid | 74.1 | 88.2 | 81.2 | 69.6 | 83.7 | 76.6 | 72.6 | 86.8 | 79.7 |
| Arunachal Pradesh | |||||||||
| self development/ self care/ self maintenance, etc. | 100.0 | 100.0 | 100.0 | 100.0 | 100.0 | 100.0 | 100.0 | 100.0 | 100.0 |
| all unpaid | 72.6 | 90.6 | 81.3 | 63.6 | 91.9 | 76.8 | 70.7 | 90.9 | 80.4 |
| all paid | 69.0 | 11.6 | 41.2 | 63.2 | 14.1 | 40.3 | 67.8 | 12.1 | 41.0 |
| all unpaid/paid | 83.4 | 90.9 | 87.0 | 81.0 | 92.6 | 86.4 | 82.9 | 91.2 | 86.9 |
| Assam | |||||||||
| self development/ self care/ self maintenance, etc. | 100.0 | 100.0 | 100.0 | 100.0 | 100.0 | 100.0 | 100.0 | 100.0 | 100.0 |
| all unpaid | 53.9 | 82.7 | 68.2 | 51.7 | 82.7 | 66.2 | 53.6 | 82.7 | 67.9 |
| all paid | 63.8 | 12.8 | 38.5 | 59.5 | 13.1 | 37.9 | 63.3 | 12.8 | 38.5 |
| all unpaid/paid | 75.8 | 83.0 | 79.4 | 74.7 | 83.6 | 78.9 | 75.6 | 83.1 | 79.3 |
| Bihar | |||||||||
| self development/ self care/ self maintenance, etc. | 100.0 | 100.0 | 100.0 | 100.0 | 100.0 | 100.0 | 100.0 | 100.0 | 100.0 |
| all unpaid | 47.1 | 79.7 | 63.3 | 43.2 | 80.2 | 60.8 | 46.7 | 79.7 | 63.1 |
| all paid | 54.4 | 10.8 | 32.7 | 54.3 | 8.5 | 32.5 | 54.4 | 10.6 | 32.6 |
| all unpaid/paid | 67.1 | 80.0 | 73.5 | 69.7 | 80.9 | 75.1 | 67.4 | 80.1 | 73.7 |
| Chhattisgarh | |||||||||
| self development/ self care/ self maintenance, etc. | 100.0 | 100.0 | 100.0 | 100.0 | 100.0 | 100.0 | 100.0 | 100.0 | 100.0 |
| all unpaid | 47.2 | 83.5 | 65.5 | 36.2 | 77.5 | 56.8 | 44.7 | 82.1 | 63.5 |
| all paid | 55.9 | 30.6 | 43.2 | 59.5 | 22.9 | 41.2 | 56.7 | 28.9 | 42.7 |
| all unpaid/paid | 75.3 | 84.4 | 79.9 | 71.3 | 79.3 | 75.3 | 74.4 | 83.3 | 78.9 |
| Delhi | |||||||||
| self development/ self care/ self maintenance, etc. | 100.0 | 100.0 | 100.0 | 100.0 | 100.0 | 100.0 | 100.0 | 100.0 | 100.0 |
| all unpaid | 61.1 | 86.2 | 71.3 | 47.1 | 80.9 | 61.9 | 47.8 | 81.2 | 62.4 |
| all paid | 78.7 | 14.8 | 52.7 | 69.4 | 11.2 | 43.9 | 69.9 | 11.4 | 44.3 |
| all unpaid/paid | 82.7 | 86.2 | 84.2 | 77.6 | 81.9 | 79.5 | 77.9 | 82.1 | 79.7 |
| Goa | |||||||||
| self development/ self care/ self maintenance, etc. | 100.0 | 100.0 | 100.0 | 100.0 | 100.0 | 100.0 | 100.0 | 100.0 | 100.0 |
| all unpaid | 39.1 | 77.6 | 58.9 | 40.1 | 66.3 | 52.9 | 39.7 | 70.8 | 55.2 |
| all paid | 58.7 | 19.7 | 38.7 | 66.6 | 27.4 | 47.4 | 63.6 | 24.3 | 44.0 |
| all unpaid/paid | 80.8 | 86.9 | 83.9 | 78.1 | 81.9 | 80.0 | 79.1 | 83.9 | 81.5 |
| Gujarat | |||||||||
| self development/ self care/ self maintenance, etc. | 100.0 | 100.0 | 100.0 | 100.0 | 100.0 | 100.0 | 100.0 | 100.0 | 100.0 |
| all unpaid | 30.6 | 85.8 | 57.7 | 33.1 | 85.0 | 57.5 | 31.7 | 85.4 | 57.6 |
| all paid | 69.0 | 32.8 | 51.2 | 64.3 | 19.4 | 43.2 | 66.9 | 27.0 | 47.7 |
| all unpaid/paid | 76.3 | 87.4 | 81.8 | 73.2 | 86.3 | 79.4 | 74.9 | 86.9 | 80.7 |
Statement 11.1: Percentage of persons participating in a day in self development activity, unpaid activities and paid activities irrespective of whether it is a major activity or not (considering all the activities in a time slot)
| Activity | rural | urban | rural+urban | ||||||
|---|---|---|---|---|---|---|---|---|---|
| male | female | person | male | female | person | male | female | person | |
| (1) | (2) | (3) | (4) | (5) | (6) | (7) | (8) | (9) | (10) |
| Haryana | |||||||||
| self development/ self care/ self maintenance, etc. | 100.0 | 100.0 | 100.0 | 100.0 | 100.0 | 100.0 | 100.0 | 100.0 | 100.0 |
| all unpaid | 41.9 | 82.1 | 61.5 | 46.6 | 80.8 | 62.2 | 44.1 | 81.5 | 61.8 |
| all paid | 57.1 | 14.2 | 36.2 | 63.7 | 13.6 | 40.8 | 60.2 | 13.9 | 38.3 |
| all unpaid/paid | 69.8 | 82.8 | 76.1 | 75.0 | 81.5 | 77.9 | 72.3 | 82.2 | 77.0 |
| Himachal Pradesh | |||||||||
| self development/ self care/ self maintenance, etc. | 100.0 | 100.0 | 100.0 | 100.0 | 100.0 | 100.0 | 100.0 | 100.0 | 100.0 |
| all unpaid | 52.8 | 86.5 | 70.4 | 53.3 | 81.4 | 66.9 | 52.9 | 86.0 | 70.0 |
| all paid | 53.5 | 16.6 | 34.3 | 65.2 | 22.9 | 44.7 | 55.1 | 17.3 | 35.5 |
| all unpaid/paid | 76.4 | 87.0 | 81.9 | 77.0 | 85.1 | 80.9 | 76.5 | 86.8 | 81.8 |
| Jharkhand | |||||||||
| self development/ self care/ self maintenance, etc. | 100.0 | 100.0 | 100.0 | 100.0 | 100.0 | 100.0 | 100.0 | 100.0 | 100.0 |
| all unpaid | 54.8 | 85.1 | 70.0 | 47.3 | 82.7 | 64.6 | 53.3 | 84.7 | 69.0 |
| all paid | 56.6 | 19.5 | 38.0 | 56.6 | 14.9 | 36.2 | 56.6 | 18.7 | 37.6 |
| all unpaid/paid | 72.5 | 85.5 | 79.0 | 70.8 | 83.6 | 77.0 | 72.2 | 85.1 | 78.6 |
| Karnataka | |||||||||
| self development/ self care/ self maintenance, etc. | 100.0 | 100.0 | 100.0 | 100.0 | 100.0 | 100.0 | 100.0 | 100.0 | 100.0 |
| all unpaid | 47.5 | 86.4 | 67.0 | 43.1 | 81.8 | 61.4 | 45.6 | 84.6 | 64.8 |
| all paid | 69.7 | 28.2 | 48.9 | 63.2 | 21.6 | 43.5 | 67.0 | 25.6 | 46.7 |
| all unpaid/paid | 78.7 | 87.2 | 83.0 | 76.6 | 84.6 | 80.4 | 77.8 | 86.2 | 81.9 |
| Kerala | |||||||||
| self development/ self care/ self maintenance, etc. | 100.0 | 100.0 | 100.0 | 100.0 | 100.0 | 100.0 | 100.0 | 100.0 | 100.0 |
| all unpaid | 55.7 | 86.1 | 71.9 | 54.9 | 84.5 | 70.7 | 55.3 | 85.4 | 71.3 |
| all paid | 49.1 | 20.1 | 33.7 | 49.6 | 19.8 | 33.7 | 49.3 | 20.0 | 33.7 |
| all unpaid/paid | 75.9 | 86.8 | 81.7 | 75.0 | 85.2 | 80.4 | 75.5 | 86.1 | 81.1 |
| Madhya Pradesh | |||||||||
| self development/ self care/ self maintenance, etc. | 100.0 | 100.0 | 100.0 | 100.0 | 100.0 | 100.0 | 100.0 | 100.0 | 100.0 |
| all unpaid | 56.6 | 87.7 | 71.6 | 41.5 | 84.1 | 62.2 | 52.2 | 86.7 | 68.9 |
| all paid | 64.1 | 24.2 | 44.8 | 61.7 | 14.5 | 38.8 | 63.4 | 21.4 | 43.1 |
| all unpaid/paid | 78.5 | 88.2 | 83.1 | 74.3 | 85.1 | 79.5 | 77.3 | 87.3 | 82.1 |
| Maharashtra | |||||||||
| self development/ self care/ self maintenance, etc. | 100.0 | 100.0 | 100.0 | 100.0 | 100.0 | 100.0 | 100.0 | 100.0 | 100.0 |
| all unpaid | 39.3 | 87.2 | 62.7 | 35.0 | 84.5 | 58.6 | 37.4 | 86.0 | 61.0 |
| all paid | 66.0 | 35.7 | 51.2 | 62.9 | 19.0 | 42.0 | 64.7 | 28.6 | 47.2 |
| all unpaid/paid | 75.8 | 87.8 | 81.7 | 74.0 | 86.2 | 79.8 | 75.0 | 87.1 | 80.9 |
| Manipur | |||||||||
| self development/ self care/ self maintenance, etc. | 100.0 | 100.0 | 100.0 | 100.0 | 100.0 | 100.0 | 100.0 | 100.0 | 100.0 |
| all unpaid | 55.4 | 82.0 | 68.3 | 62.1 | 82.6 | 72.5 | 57.4 | 82.1 | 69.6 |
| all paid | 56.8 | 32.1 | 44.8 | 56.9 | 38.4 | 47.4 | 56.8 | 34.1 | 45.6 |
| all unpaid/paid | 72.8 | 82.7 | 77.6 | 75.4 | 84.1 | 79.8 | 73.6 | 83.2 | 78.3 |
Statement 11.1: Percentage of persons participating in a day in self development activity, unpaid activities and paid activities irrespective of whether it is a major activity or not (considering all the activities in a time slot)
| Activity | rural | urban | rural+urban | ||||||
|---|---|---|---|---|---|---|---|---|---|
| male | female | person | male | female | person | male | female | person | |
| (1) | (2) | (3) | (4) | (5) | (6) | (7) | (8) | (9) | (10) |
| Meghalaya | |||||||||
| self development/ self care/ self maintenance, etc. | 100.0 | 100.0 | 100.0 | 100.0 | 100.0 | 100.0 | 100.0 | 100.0 | 100.0 |
| all unpaid | 53.8 | 83.9 | 69.3 | 53.0 | 83.2 | 68.9 | 53.7 | 83.8 | 69.2 |
| all paid | 51.0 | 17.9 | 33.9 | 53.6 | 17.3 | 34.4 | 51.5 | 17.8 | 34.0 |
| all unpaid/paid | 74.5 | 84.5 | 79.7 | 78.9 | 84.7 | 82.0 | 75.3 | 84.5 | 80.1 |
| Mizoram | |||||||||
| self development/ self care/ self maintenance, etc. | 100.0 | 100.0 | 100.0 | 100.0 | 100.0 | 100.0 | 100.0 | 100.0 | 100.0 |
| all unpaid | 60.1 | 92.7 | 75.9 | 53.4 | 91.2 | 72.4 | 57.2 | 92.1 | 74.4 |
| all paid | 69.0 | 30.6 | 50.4 | 60.0 | 21.7 | 40.8 | 65.1 | 26.6 | 46.1 |
| all unpaid/paid | 81.7 | 93.3 | 87.3 | 75.9 | 92.8 | 84.4 | 79.2 | 93.1 | 86.0 |
| Nagaland | |||||||||
| self development/ self care/ self maintenance, etc. | 100.0 | 100.0 | 100.0 | 100.0 | 100.0 | 100.0 | 100.0 | 100.0 | 100.0 |
| all unpaid | 81.9 | 89.2 | 85.5 | 75.2 | 86.1 | 80.5 | 79.6 | 88.2 | 83.8 |
| all paid | 20.6 | 7.8 | 14.3 | 39.0 | 15.3 | 27.5 | 26.9 | 10.4 | 18.8 |
| all unpaid/paid | 84.7 | 89.7 | 87.1 | 81.7 | 87.7 | 84.6 | 83.6 | 89.0 | 86.3 |
| Odisha | |||||||||
| self development/ self care/ self maintenance, etc. | 100.0 | 100.0 | 100.0 | 100.0 | 100.0 | 100.0 | 100.0 | 100.0 | 100.0 |
| all unpaid | 45.4 | 83.1 | 64.6 | 43.7 | 80.9 | 62.9 | 45.1 | 82.8 | 64.3 |
| all paid | 55.9 | 15.2 | 35.2 | 58.9 | 13.3 | 35.3 | 56.4 | 14.8 | 35.2 |
| all unpaid/paid | 72.8 | 83.9 | 78.4 | 74.0 | 81.6 | 77.9 | 73.0 | 83.5 | 78.3 |
| Punjab | |||||||||
| self development/ self care/ self maintenance, etc. | 100.0 | 100.0 | 100.0 | 100.0 | 100.0 | 100.0 | 100.0 | 100.0 | 100.0 |
| all unpaid | 43.4 | 83.9 | 62.6 | 45.0 | 85.0 | 63.8 | 44.0 | 84.4 | 63.1 |
| all paid | 63.9 | 19.8 | 43.0 | 63.9 | 19.1 | 42.8 | 63.9 | 19.5 | 42.9 |
| all unpaid/paid | 75.9 | 84.8 | 80.1 | 77.5 | 85.6 | 81.3 | 76.6 | 85.1 | 80.6 |
| Rajasthan | |||||||||
| self development/ self care/ self maintenance, etc. | 100.0 | 100.0 | 100.0 | 100.0 | 100.0 | 100.0 | 100.0 | 100.0 | 100.0 |
| all unpaid | 51.0 | 86.0 | 69.0 | 42.4 | 82.4 | 61.3 | 48.6 | 85.1 | 67.0 |
| all paid | 52.9 | 27.2 | 39.6 | 59.5 | 16.2 | 39.1 | 54.8 | 24.4 | 39.5 |
| all unpaid/paid | 73.2 | 86.5 | 80.1 | 73.7 | 83.4 | 78.3 | 73.3 | 85.7 | 79.6 |
| Sikkim | |||||||||
| self development/ self care/ self maintenance, etc. | 100.0 | 100.0 | 100.0 | 100.0 | 100.0 | 100.0 | 100.0 | 100.0 | 100.0 |
| all unpaid | 72.0 | 90.6 | 81.0 | 70.6 | 95.3 | 82.0 | 71.6 | 91.7 | 81.3 |
| all paid | 64.9 | 25.3 | 45.6 | 65.2 | 28.5 | 48.3 | 65.0 | 26.0 | 46.3 |
| all unpaid/paid | 84.6 | 91.8 | 88.1 | 89.1 | 96.0 | 92.3 | 85.8 | 92.8 | 89.2 |
| Tamil Nadu | |||||||||
| self development/ self care/ self maintenance, etc. | 100.0 | 100.0 | 100.0 | 100.0 | 100.0 | 100.0 | 100.0 | 100.0 | 100.0 |
| all unpaid | 45.5 | 85.0 | 66.1 | 46.9 | 83.8 | 65.5 | 46.1 | 84.4 | 65.8 |
| all paid | 62.2 | 37.6 | 49.3 | 63.0 | 25.1 | 43.9 | 62.6 | 31.8 | 46.7 |
| all unpaid/paid | 76.4 | 86.3 | 81.6 | 78.5 | 85.6 | 82.1 | 77.4 | 86.0 | 81.8 |
Statement 11.1: Percentage of persons participating in a day in self development activity, unpaid activities and paid activities irrespective of whether it is a major activity or not (considering all the activities in a time slot)
| Activity | rural | urban | rural+urban | ||||||
|---|---|---|---|---|---|---|---|---|---|
| male | female | person | male | female | person | male | female | person | |
| (1) | (2) | (3) | (4) | (5) | (6) | (7) | (8) | (9) | (10) |
| Telangana | |||||||||
| self development/ self care/ self maintenance, etc. | 100.0 | 100.0 | 100.0 | 100.0 | 100.0 | 100.0 | 100.0 | 100.0 | 100.0 |
| all unpaid | 53.2 | 86.5 | 70.2 | 53.3 | 81.3 | 67.0 | 53.3 | 84.4 | 68.9 |
| all paid | 66.7 | 42.6 | 54.4 | 58.5 | 23.7 | 41.5 | 63.2 | 34.8 | 49.0 |
| all unpaid/paid | 77.5 | 86.9 | 82.3 | 75.0 | 83.3 | 79.0 | 76.4 | 85.4 | 80.9 |
| Tripura | |||||||||
| self development/ self care/ self maintenance, etc. | 100.0 | 100.0 | 100.0 | 100.0 | 100.0 | 100.0 | 100.0 | 100.0 | 100.0 |
| all unpaid | 54.8 | 85.5 | 70.4 | 48.1 | 83.1 | 66.2 | 53.4 | 84.9 | 69.5 |
| all paid | 64.4 | 16.6 | 40.1 | 56.6 | 15.1 | 35.2 | 62.7 | 16.3 | 39.0 |
| all unpaid/paid | 77.8 | 86.2 | 82.1 | 73.0 | 84.2 | 78.8 | 76.8 | 85.7 | 81.4 |
| Uttar Pradesh | |||||||||
| self development/ self care/ self maintenance, etc. | 100.0 | 100.0 | 100.0 | 100.0 | 100.0 | 100.0 | 100.0 | 100.0 | 100.0 |
| all unpaid | 50.3 | 83.9 | 67.3 | 40.8 | 82.9 | 61.4 | 48.3 | 83.7 | 66.1 |
| all paid | 56.6 | 14.0 | 35.0 | 60.5 | 10.2 | 35.9 | 57.4 | 13.2 | 35.2 |
| all unpaid/paid | 73.6 | 84.6 | 79.2 | 73.0 | 83.6 | 78.2 | 73.5 | 84.4 | 79.0 |
| Uttarakhand | |||||||||
| self development/ self care/ self maintenance, etc. | 100.0 | 100.0 | 100.0 | 100.0 | 100.0 | 100.0 | 100.0 | 100.0 | 100.0 |
| all unpaid | 51.2 | 85.0 | 68.1 | 49.6 | 83.4 | 66.2 | 50.8 | 84.6 | 67.6 |
| all paid | 50.1 | 8.4 | 29.1 | 56.4 | 11.9 | 34.6 | 51.7 | 9.3 | 30.6 |
| all unpaid/paid | 74.1 | 85.7 | 79.9 | 75.9 | 84.4 | 80.1 | 74.6 | 85.4 | 80.0 |
| West Bengal | |||||||||
| self development/ self care/ self maintenance, etc. | 100.0 | 100.0 | 100.0 | 100.0 | 100.0 | 100.0 | 100.0 | 100.0 | 100.0 |
| all unpaid | 45.3 | 83.2 | 64.5 | 43.0 | 81.5 | 62.4 | 44.6 | 82.7 | 63.8 |
| all paid | 65.1 | 17.5 | 41.1 | 61.2 | 20.2 | 40.6 | 63.9 | 18.3 | 40.9 |
| all unpaid/paid | 76.7 | 83.8 | 80.3 | 75.1 | 83.8 | 79.5 | 76.2 | 83.8 | 80.0 |
| A \& N Islands | |||||||||
| self development/ self care/ self maintenance, etc. | 100.0 | 100.0 | 100.0 | 100.0 | 100.0 | 100.0 | 100.0 | 100.0 | 100.0 |
| all unpaid | 55.0 | 86.9 | 69.7 | 35.6 | 77.8 | 55.8 | 48.0 | 83.4 | 64.5 |
| all paid | 56.0 | 14.0 | 36.6 | 50.9 | 19.0 | 35.7 | 54.1 | 15.9 | 36.3 |
| all unpaid/paid | 75.2 | 87.3 | 80.8 | 65.8 | 78.4 | 71.8 | 71.8 | 83.9 | 77.5 |
| Chandigarh | |||||||||
| self development/ self care/ self maintenance, etc. | – | – | – | 100.0 | 100.0 | 100.0 | 100.0 | 100.0 | 100.0 |
| all unpaid | – | – | – | 43.6 | 80.5 | 61.0 | 43.6 | 80.5 | 61.0 |
| all paid | – | – | – | 66.1 | 22.1 | 45.2 | 66.1 | 22.1 | 45.2 |
| all unpaid/paid | – | – | – | 77.1 | 81.7 | 79.3 | 77.1 | 81.7 | 79.3 |
| Dadra \& Nagar Haveli and Daman \& Diu | |||||||||
| self development/ self care/ self maintenance, etc. | 100.0 | 100.0 | 100.0 | 100.0 | 100.0 | 100.0 | 100.0 | 100.0 | 100.0 |
| all unpaid | 39.0 | 82.5 | 60.0 | 49.0 | 83.3 | 63.4 | 45.6 | 83.0 | 62.2 |
| all paid | 57.7 | 35.4 | 47.0 | 72.2 | 33.2 | 56.0 | 67.4 | 34.1 | 52.7 |
| all unpaid/paid | 70.3 | 84.4 | 77.1 | 78.7 | 83.5 | 80.7 | 75.9 | 83.9 | 79.4 |
Statement 11.1: Percentage of persons participating in a day in self development activity, unpaid activities and paid activities irrespective of whether it is a major activity or not (considering all the activities in a time slot)
| Activity | rural | urban | rural+urban | ||||||
|---|---|---|---|---|---|---|---|---|---|
| male | female | person | male | female | person | male | female | person | |
| (1) | (2) | (3) | (4) | (5) | (6) | (7) | (8) | (9) | (10) |
| Jammu \& Kashmir | |||||||||
| self development/ self care/ self maintenance, etc. | 100.0 | 100.0 | 100.0 | 100.0 | 100.0 | 100.0 | 100.0 | 100.0 | 100.0 |
| all unpaid | 51.7 | 80.2 | 65.5 | 32.9 | 81.1 | 56.2 | 46.9 | 80.4 | 63.1 |
| all paid | 53.0 | 4.2 | 29.4 | 63.0 | 17.0 | 40.7 | 55.6 | 7.5 | 32.3 |
| all unpaid/paid | 73.6 | 80.7 | 77.0 | 73.6 | 81.9 | 77.6 | 73.6 | 81.0 | 77.2 |
| Ladakh | |||||||||
| self development/ self care/ self maintenance, etc. | 100.0 | 100.0 | 100.0 | 100.0 | 100.0 | 100.0 | 100.0 | 100.0 | 100.0 |
| all unpaid | 59.1 | 85.4 | 71.6 | 44.6 | 88.8 | 64.9 | 57.5 | 85.8 | 70.9 |
| all paid | 62.1 | 5.5 | 35.2 | 62.3 | 11.4 | 38.9 | 62.1 | 6.1 | 35.6 |
| all unpaid/paid | 78.7 | 85.9 | 82.1 | 74.7 | 89.1 | 81.3 | 78.2 | 86.2 | 82.0 |
| Lakshadweep | |||||||||
| self development/ self care/ self maintenance, etc. | 100.0 | 100.0 | 100.0 | 100.0 | 100.0 | 100.0 | 100.0 | 100.0 | 100.0 |
| all unpaid | 49.9 | 87.1 | 69.6 | 58.6 | 85.4 | 73.4 | 56.7 | 85.7 | 72.6 |
| all paid | 52.4 | 14.2 | 32.2 | 51.3 | 14.5 | 31.0 | 51.6 | 14.4 | 31.2 |
| all unpaid/paid | 78.2 | 88.3 | 83.6 | 79.9 | 85.4 | 82.9 | 79.5 | 86.0 | 83.1 |
| Puducherry | |||||||||
| self development/ self care/ self maintenance, etc. | 100.0 | 100.0 | 100.0 | 100.0 | 100.0 | 100.0 | 100.0 | 100.0 | 100.0 |
| all unpaid | 60.7 | 89.2 | 75.6 | 51.3 | 83.8 | 69.0 | 54.5 | 85.5 | 71.2 |
| all paid | 60.4 | 26.1 | 42.5 | 51.0 | 19.6 | 33.9 | 54.2 | 21.7 | 36.7 |
| all unpaid/paid | 81.4 | 90.3 | 86.0 | 76.2 | 85.2 | 81.1 | 78.0 | 86.8 | 82.7 |
| All India | |||||||||
| self development/ self care/ self maintenance, etc. | 100.0 | 100.0 | 100.0 | 100.0 | 100.0 | 100.0 | 100.0 | 100.0 | 100.0 |
| all unpaid | 47.4 | 84.4 | 65.9 | 42.4 | 82.8 | 62.1 | 45.8 | 83.9 | 64.7 |
| all paid | 60.1 | 21.8 | 40.9 | 61.2 | 18.0 | 40.2 | 60.5 | 20.6 | 40.7 |
| all unpaid/paid | 74.3 | 85.1 | 79.7 | 74.6 | 84.3 | 79.3 | 74.4 | 84.8 | 79.6 |
Statement 12.1: Minutes spent in a day on an average per person in self development activity, unpaid activities and paid activities irrespective of whether it is a major activity or not (considering all the activities in a time slot)
| Activity | rural | urban | rural+urban | ||||||
|---|---|---|---|---|---|---|---|---|---|
| male | female | person | male | female | person | male | female | person | |
| (1) | (2) | (3) | (4) | (5) | (6) | (7) | (8) | (9) | (10) |
| Andhra Pradesh | |||||||||
| self development/ self care/ self maintenance, etc. | 1128 | 1057 | 1092 | 1152 | 1098 | 1125 | 1136 | 1070 | 1103 |
| all unpaid | 33 | 259 | 147 | 34 | 271 | 152 | 33 | 263 | 149 |
| all paid | 279 | 124 | 201 | 255 | 71 | 163 | 271 | 107 | 188 |
| all unpaid/paid | 312 | 383 | 348 | 288 | 342 | 315 | 304 | 370 | 337 |
| Arunachal Pradesh | |||||||||
| self development/ self care/ self maintenance, etc. | 1096 | 936 | 1019 | 1129 | 970 | 1055 | 1103 | 943 | 1026 |
| all unpaid | 118 | 474 | 290 | 77 | 425 | 239 | 109 | 464 | 280 |
| all paid | 226 | 30 | 131 | 234 | 45 | 146 | 227 | 33 | 134 |
| all unpaid/paid | 344 | 504 | 421 | 311 | 470 | 385 | 337 | 497 | 414 |
| Assam | |||||||||
| self development/ self care/ self maintenance, etc. | 1130 | 1071 | 1101 | 1128 | 1088 | 1109 | 1129 | 1073 | 1102 |
| all unpaid | 61 | 334 | 196 | 57 | 307 | 173 | 61 | 331 | 194 |
| all paid | 249 | 35 | 143 | 256 | 45 | 158 | 250 | 36 | 145 |
| all unpaid/paid | 310 | 369 | 339 | 312 | 352 | 331 | 311 | 367 | 338 |
| Bihar | |||||||||
| self development/ self care/ self maintenance, etc. | 1169 | 1091 | 1130 | 1149 | 1105 | 1128 | 1167 | 1092 | 1130 |
| all unpaid | 63 | 325 | 194 | 48 | 309 | 172 | 62 | 323 | 192 |
| all paid | 207 | 24 | 116 | 242 | 26 | 140 | 211 | 24 | 119 |
| all unpaid/paid | 271 | 349 | 310 | 291 | 335 | 312 | 273 | 348 | 310 |
| Chhattisgarh | |||||||||
| self development/ self care/ self maintenance, etc. | 1125 | 1064 | 1094 | 1117 | 1116 | 1117 | 1123 | 1076 | 1099 |
| all unpaid | 91 | 277 | 185 | 39 | 244 | 142 | 79 | 270 | 175 |
| all paid | 224 | 99 | 161 | 284 | 80 | 182 | 238 | 95 | 166 |
| all unpaid/paid | 315 | 376 | 346 | 323 | 324 | 323 | 317 | 364 | 341 |
| Delhi | |||||||||
| self development/ self care/ self maintenance, etc. | 948 | 988 | 964 | 1039 | 1077 | 1055 | 1034 | 1073 | 1051 |
| all unpaid | 86 | 383 | 207 | 48 | 317 | 166 | 50 | 320 | 168 |
| all paid | 406 | 69 | 269 | 354 | 46 | 219 | 357 | 47 | 221 |
| all unpaid/paid | 492 | 452 | 476 | 401 | 363 | 385 | 406 | 367 | 389 |
| Goa | |||||||||
| self development/ self care/ self maintenance, etc. | 1113 | 1106 | 1110 | 1086 | 1108 | 1097 | 1097 | 1107 | 1102 |
| all unpaid | 50 | 248 | 151 | 36 | 210 | 121 | 41 | 225 | 133 |
| all paid | 277 | 87 | 179 | 318 | 122 | 222 | 302 | 108 | 205 |
| all unpaid/paid | 327 | 334 | 330 | 354 | 332 | 343 | 343 | 333 | 338 |
| Gujarat | |||||||||
| self development/ self care/ self maintenance, etc. | 1143 | 1043 | 1094 | 1103 | 1077 | 1091 | 1125 | 1058 | 1092 |
| all unpaid | 33 | 308 | 168 | 31 | 298 | 157 | 32 | 303 | 163 |
| all paid | 264 | 89 | 178 | 306 | 65 | 192 | 283 | 79 | 185 |
| all unpaid/paid | 297 | 397 | 346 | 337 | 363 | 349 | 315 | 382 | 348 |
Statement 12.1: Minutes spent in a day on an average per person in self development activity, unpaid activities and paid activities irrespective of whether it is a major activity or not (considering all the activities in a time slot)
| Activity | rural | urban | rural+urban | ||||||
|---|---|---|---|---|---|---|---|---|---|
| male | female | person | male | female | person | male | female | person | |
| (1) | (2) | (3) | (4) | (5) | (6) | (7) | (8) | (9) | (10) |
| Haryana | |||||||||
| self development/ self care/ self maintenance, etc. | 1155 | 1086 | 1122 | 1088 | 1094 | 1091 | 1123 | 1090 | 1107 |
| all unpaid | 50 | 315 | 179 | 43 | 295 | 158 | 47 | 306 | 170 |
| all paid | 235 | 39 | 139 | 309 | 51 | 191 | 270 | 44 | 163 |
| all unpaid/paid | 285 | 354 | 318 | 352 | 346 | 349 | 317 | 350 | 333 |
| Himachal Pradesh | |||||||||
| self development/ self care/ self maintenance, etc. | 1129 | 1040 | 1083 | 1087 | 1100 | 1093 | 1124 | 1047 | 1084 |
| all unpaid | 80 | 360 | 226 | 54 | 253 | 150 | 77 | 348 | 217 |
| all paid | 231 | 40 | 131 | 299 | 87 | 196 | 240 | 45 | 139 |
| all unpaid/paid | 311 | 400 | 357 | 353 | 340 | 347 | 316 | 393 | 356 |
| Jharkhand | |||||||||
| self development/ self care/ self maintenance, etc. | 1127 | 1034 | 1080 | 1125 | 1077 | 1102 | 1127 | 1042 | 1085 |
| all unpaid | 84 | 360 | 222 | 51 | 315 | 180 | 77 | 351 | 214 |
| all paid | 229 | 46 | 137 | 264 | 48 | 158 | 236 | 47 | 141 |
| all unpaid/paid | 313 | 406 | 360 | 315 | 363 | 338 | 313 | 398 | 355 |
| Karnataka | |||||||||
| self development/ self care/ self maintenance, etc. | 1126 | 1062 | 1094 | 1121 | 1088 | 1105 | 1124 | 1072 | 1099 |
| all unpaid | 45 | 291 | 168 | 39 | 278 | 152 | 42 | 286 | 162 |
| all paid | 269 | 87 | 178 | 280 | 74 | 182 | 274 | 82 | 180 |
| all unpaid/paid | 314 | 378 | 346 | 319 | 352 | 335 | 316 | 368 | 341 |
| Kerala | |||||||||
| self development/ self care/ self maintenance, etc. | 1173 | 1086 | 1127 | 1167 | 1099 | 1131 | 1170 | 1092 | 1129 |
| all unpaid | 62 | 286 | 181 | 60 | 272 | 173 | 61 | 279 | 177 |
| all paid | 205 | 68 | 132 | 214 | 69 | 137 | 209 | 69 | 134 |
| all unpaid/paid | 267 | 354 | 313 | 273 | 341 | 309 | 270 | 348 | 311 |
| Madhya Pradesh | |||||||||
| self development/ self care/ self maintenance, etc. | 1119 | 1010 | 1066 | 1122 | 1083 | 1103 | 1120 | 1031 | 1077 |
| all unpaid | 82 | 361 | 216 | 46 | 308 | 173 | 72 | 345 | 204 |
| all paid | 239 | 70 | 157 | 272 | 49 | 164 | 248 | 64 | 159 |
| all unpaid/paid | 321 | 430 | 374 | 318 | 357 | 337 | 320 | 409 | 363 |
| Maharashtra | |||||||||
| self development/ self care/ self maintenance, etc. | 1129 | 1029 | 1080 | 1111 | 1092 | 1102 | 1121 | 1056 | 1090 |
| all unpaid | 43 | 291 | 165 | 31 | 277 | 148 | 38 | 285 | 158 |
| all paid | 267 | 119 | 195 | 298 | 72 | 190 | 281 | 99 | 193 |
| all unpaid/paid | 311 | 411 | 360 | 329 | 348 | 338 | 319 | 384 | 350 |
| Manipur | |||||||||
| self development/ self care/ self maintenance, etc. | 1161 | 1050 | 1107 | 1147 | 1044 | 1095 | 1157 | 1049 | 1103 |
| all unpaid | 72 | 303 | 184 | 73 | 284 | 180 | 72 | 297 | 183 |
| all paid | 207 | 87 | 148 | 220 | 112 | 165 | 211 | 95 | 154 |
| all unpaid/paid | 279 | 390 | 333 | 293 | 396 | 345 | 283 | 391 | 337 |
Statement 12.1: Minutes spent in a day on an average per person in self development activity, unpaid activities and paid activities irrespective of whether it is a major activity or not (considering all the activities in a time slot)
| Activity | rural | urban | rural+urban | ||||||
|---|---|---|---|---|---|---|---|---|---|
| male | female | person | male | female | person | male | female | person | |
| (1) | (2) | (3) | (4) | (5) | (6) | (7) | (8) | (9) | (10) |
| Meghalaya | |||||||||
| self development/ self care/ self maintenance, etc. | 1165 | 1083 | 1122 | 1150 | 1111 | 1130 | 1162 | 1088 | 1124 |
| all unpaid | 69 | 297 | 186 | 62 | 264 | 169 | 68 | 291 | 183 |
| all paid | 206 | 61 | 131 | 227 | 65 | 141 | 210 | 61 | 133 |
| all unpaid/paid | 275 | 357 | 318 | 290 | 329 | 310 | 278 | 352 | 316 |
| Mizoram | |||||||||
| self development/ self care/ self maintenance, etc. | 1127 | 1003 | 1067 | 1151 | 1042 | 1096 | 1137 | 1020 | 1079 |
| all unpaid | 67 | 338 | 198 | 61 | 321 | 192 | 64 | 330 | 195 |
| all paid | 247 | 99 | 175 | 228 | 77 | 152 | 239 | 89 | 165 |
| all unpaid/paid | 313 | 437 | 373 | 289 | 398 | 344 | 303 | 420 | 361 |
| Nagaland | |||||||||
| self development/ self care/ self maintenance, etc. | 1159 | 1062 | 1112 | 1189 | 1089 | 1141 | 1170 | 1071 | 1122 |
| all unpaid | 220 | 362 | 290 | 118 | 310 | 211 | 185 | 344 | 263 |
| all paid | 61 | 15 | 38 | 133 | 41 | 88 | 86 | 24 | 56 |
| all unpaid/paid | 281 | 378 | 328 | 251 | 351 | 299 | 270 | 369 | 318 |
| Odisha | |||||||||
| self development/ self care/ self maintenance, etc. | 1167 | 1080 | 1123 | 1140 | 1130 | 1135 | 1163 | 1089 | 1125 |
| all unpaid | 72 | 318 | 197 | 47 | 266 | 160 | 68 | 309 | 191 |
| all paid | 201 | 42 | 120 | 253 | 44 | 145 | 209 | 42 | 124 |
| all unpaid/paid | 273 | 360 | 317 | 300 | 310 | 305 | 277 | 351 | 315 |
| Punjab | |||||||||
| self development/ self care/ self maintenance, etc. | 1111 | 1088 | 1100 | 1095 | 1091 | 1093 | 1104 | 1089 | 1097 |
| all unpaid | 51 | 300 | 169 | 48 | 282 | 158 | 50 | 293 | 164 |
| all paid | 279 | 53 | 172 | 297 | 67 | 189 | 286 | 59 | 179 |
| all unpaid/paid | 329 | 352 | 340 | 345 | 349 | 347 | 336 | 351 | 343 |
| Rajasthan | |||||||||
| self development/ self care/ self maintenance, etc. | 1151 | 1043 | 1095 | 1123 | 1117 | 1120 | 1143 | 1061 | 1102 |
| all unpaid | 74 | 326 | 203 | 39 | 271 | 149 | 64 | 312 | 189 |
| all paid | 216 | 71 | 141 | 277 | 52 | 171 | 233 | 67 | 149 |
| all unpaid/paid | 289 | 397 | 345 | 317 | 323 | 320 | 297 | 379 | 338 |
| Sikkim | |||||||||
| self development/ self care/ self maintenance, etc. | 1082 | 1047 | 1065 | 1042 | 1004 | 1025 | 1072 | 1036 | 1055 |
| all unpaid | 113 | 321 | 214 | 85 | 329 | 197 | 106 | 323 | 210 |
| all paid | 245 | 72 | 161 | 313 | 106 | 218 | 263 | 81 | 175 |
| all unpaid/paid | 358 | 393 | 375 | 398 | 436 | 415 | 368 | 404 | 385 |
| Tamil Nadu | |||||||||
| self development/ self care/ self maintenance, etc. | 1149 | 1098 | 1122 | 1123 | 1108 | 1115 | 1136 | 1103 | 1119 |
| all unpaid | 41 | 225 | 137 | 40 | 240 | 141 | 40 | 232 | 139 |
| all paid | 250 | 117 | 181 | 278 | 92 | 184 | 264 | 105 | 182 |
| all unpaid/paid | 291 | 342 | 318 | 317 | 332 | 325 | 304 | 337 | 321 |
Statement 12.1: Minutes spent in a day on an average per person in self development activity, unpaid activities and paid activities irrespective of whether it is a major activity or not (considering all the activities in a time slot)
| Activity | rural | urban | rural+urban | ||||||
|---|---|---|---|---|---|---|---|---|---|
| male | female | person | male | female | person | male | female | person | |
| (1) | (2) | (3) | (4) | (5) | (6) | (7) | (8) | (9) | (10) |
| Telangana | |||||||||
| self development/ self care/ self maintenance, etc. | 1136 | 1054 | 1094 | 1136 | 1089 | 1113 | 1136 | 1068 | 1102 |
| all unpaid | 49 | 255 | 154 | 48 | 266 | 155 | 49 | 259 | 154 |
| all paid | 255 | 131 | 192 | 257 | 85 | 173 | 255 | 113 | 184 |
| all unpaid/paid | 304 | 386 | 346 | 304 | 351 | 327 | 304 | 372 | 338 |
| Tripura | |||||||||
| self development/ self care/ self maintenance, etc. | 1133 | 1096 | 1114 | 1151 | 1130 | 1140 | 1137 | 1103 | 1120 |
| all unpaid | 69 | 299 | 186 | 52 | 264 | 161 | 65 | 291 | 181 |
| all paid | 239 | 45 | 140 | 238 | 46 | 139 | 238 | 45 | 140 |
| all unpaid/paid | 307 | 344 | 326 | 289 | 310 | 300 | 303 | 337 | 320 |
| Uttar Pradesh | |||||||||
| self development/ self care/ self maintenance, etc. | 1132 | 1065 | 1098 | 1117 | 1089 | 1103 | 1129 | 1070 | 1099 |
| all unpaid | 79 | 342 | 213 | 44 | 317 | 178 | 72 | 337 | 205 |
| all paid | 228 | 32 | 129 | 279 | 35 | 159 | 239 | 33 | 135 |
| all unpaid/paid | 308 | 375 | 342 | 323 | 351 | 337 | 311 | 370 | 341 |
| Uttarakhand | |||||||||
| self development/ self care/ self maintenance, etc. | 1176 | 1105 | 1141 | 1157 | 1139 | 1149 | 1171 | 1114 | 1143 |
| all unpaid | 71 | 313 | 192 | 49 | 261 | 153 | 65 | 299 | 182 |
| all paid | 193 | 22 | 107 | 234 | 40 | 139 | 204 | 27 | 115 |
| all unpaid/paid | 264 | 335 | 299 | 283 | 301 | 291 | 269 | 326 | 297 |
| West Bengal | |||||||||
| self development/ self care/ self maintenance, etc. | 1139 | 1075 | 1107 | 1121 | 1094 | 1107 | 1133 | 1081 | 1107 |
| all unpaid | 55 | 322 | 190 | 45 | 282 | 164 | 52 | 310 | 182 |
| all paid | 246 | 43 | 144 | 274 | 64 | 169 | 254 | 50 | 151 |
| all unpaid/paid | 301 | 365 | 333 | 319 | 346 | 333 | 307 | 359 | 333 |
| A \& N Islands | |||||||||
| self development/ self care/ self maintenance, etc. | 1114 | 1071 | 1094 | 1158 | 1133 | 1146 | 1130 | 1095 | 1114 |
| all unpaid | 86 | 313 | 190 | 34 | 226 | 126 | 67 | 280 | 166 |
| all paid | 240 | 56 | 155 | 248 | 81 | 168 | 243 | 65 | 160 |
| all unpaid/paid | 326 | 369 | 346 | 282 | 307 | 294 | 310 | 345 | 326 |
| Chandigarh | |||||||||
| self development/ self care/ self maintenance, etc. | – | – | – | 1080 | 1109 | 1094 | 1080 | 1109 | 1094 |
| all unpaid | – | – | – | 49 | 249 | 143 | 49 | 249 | 143 |
| all paid | – | – | – | 311 | 82 | 203 | 311 | 82 | 203 |
| all unpaid/paid | – | – | – | 360 | 331 | 346 | 360 | 331 | 346 |
| Dadra \& Nagar Haveli and Daman \& Diu | |||||||||
| self development/ self care/ self maintenance, etc. | 1095 | 1056 | 1076 | 972 | 1044 | 1002 | 1013 | 1049 | 1029 |
| all unpaid | 39 | 241 | 136 | 50 | 242 | 131 | 46 | 241 | 133 |
| all paid | 306 | 143 | 227 | 418 | 154 | 308 | 380 | 150 | 279 |
| all unpaid/paid | 345 | 384 | 364 | 468 | 396 | 438 | 427 | 391 | 411 |
Statement 12.1: Minutes spent in a day on an average per person in self development activity, unpaid activities and paid activities irrespective of whether it is a major activity or not (considering all the activities in a time slot)
| Activity | rural | urban | rural+urban | ||||||
|---|---|---|---|---|---|---|---|---|---|
| male | female | person | male | female | person | male | female | person | |
| (1) | (2) | (3) | (4) | (5) | (6) | (7) | (8) | (9) | (10) |
| Jammu \& Kashmir | |||||||||
| self development/ self care/ self maintenance, etc. | 1167 | 1114 | 1141 | 1124 | 1082 | 1104 | 1156 | 1106 | 1131 |
| all unpaid | 76 | 314 | 192 | 31 | 304 | 163 | 65 | 312 | 184 |
| all paid | 197 | 12 | 107 | 285 | 54 | 173 | 220 | 23 | 124 |
| all unpaid/paid | 273 | 326 | 299 | 316 | 358 | 336 | 284 | 334 | 309 |
| Ladakh | |||||||||
| self development/ self care/ self maintenance, etc. | 1157 | 1060 | 1111 | 1146 | 1052 | 1103 | 1156 | 1059 | 1110 |
| all unpaid | 59 | 364 | 204 | 46 | 350 | 186 | 57 | 363 | 202 |
| all paid | 224 | 16 | 125 | 247 | 38 | 151 | 227 | 18 | 128 |
| all unpaid/paid | 283 | 380 | 329 | 294 | 388 | 337 | 284 | 381 | 330 |
| Lakshadweep | |||||||||
| self development/ self care/ self maintenance, etc. | 1169 | 1094 | 1129 | 1160 | 1113 | 1134 | 1162 | 1109 | 1133 |
| all unpaid | 61 | 308 | 192 | 70 | 287 | 190 | 68 | 291 | 190 |
| all paid | 210 | 37 | 119 | 210 | 40 | 116 | 210 | 39 | 116 |
| all unpaid/paid | 271 | 346 | 311 | 280 | 327 | 306 | 278 | 331 | 307 |
| Puducherry | |||||||||
| self development/ self care/ self maintenance, etc. | 1067 | 1015 | 1040 | 1129 | 1074 | 1099 | 1108 | 1055 | 1079 |
| all unpaid | 79 | 318 | 204 | 65 | 290 | 188 | 70 | 299 | 193 |
| all paid | 294 | 107 | 196 | 246 | 76 | 153 | 262 | 86 | 168 |
| all unpaid/paid | 373 | 425 | 400 | 311 | 366 | 341 | 332 | 385 | 361 |
| All India | |||||||||
| self development/ self care/ self maintenance, etc. | 1140 | 1063 | 1102 | 1118 | 1094 | 1106 | 1133 | 1073 | 1103 |
| all unpaid | 63 | 314 | 189 | 42 | 283 | 159 | 56 | 305 | 180 |
| all paid | 237 | 62 | 149 | 280 | 63 | 175 | 251 | 62 | 157 |
| all unpaid/paid | 300 | 377 | 338 | 322 | 346 | 334 | 307 | 367 | 337 |
Statement 13.1: Minutes spent in a day on an average per participant in self development, unpaid activities and paid activities irrespective of whether it is a major activity or not (considering all the activities in a time slot)
| Activity | rural | urban | rural+urban | ||||||
|---|---|---|---|---|---|---|---|---|---|
| male | female | person | male | female | person | male | female | person | |
| (1) | (2) | (3) | (4) | (5) | (6) | (7) | (8) | (9) | (10) |
| Andhra Pradesh | |||||||||
| self development/ self care/ self maintenance, etc. | 1128 | 1057 | 1092 | 1152 | 1098 | 1125 | 1136 | 1070 | 1103 |
| all unpaid | 94 | 298 | 240 | 94 | 329 | 258 | 94 | 307 | 246 |
| all paid | 426 | 349 | 399 | 443 | 350 | 419 | 431 | 350 | 404 |
| all unpaid/paid | 422 | 434 | 428 | 415 | 409 | 412 | 419 | 426 | 423 |
| Arunachal Pradesh | |||||||||
| self development/ self care/ self maintenance, etc. | 1096 | 936 | 1019 | 1129 | 970 | 1055 | 1103 | 943 | 1026 |
| all unpaid | 163 | 523 | 357 | 120 | 462 | 311 | 155 | 511 | 348 |
| all paid | 327 | 260 | 318 | 370 | 320 | 362 | 335 | 274 | 327 |
| all unpaid/paid | 412 | 554 | 484 | 384 | 507 | 446 | 406 | 545 | 476 |
| Assam | |||||||||
| self development/ self care/ self maintenance, etc. | 1130 | 1071 | 1101 | 1128 | 1088 | 1109 | 1129 | 1073 | 1102 |
| all unpaid | 114 | 404 | 288 | 110 | 371 | 262 | 113 | 400 | 285 |
| all paid | 390 | 272 | 371 | 430 | 342 | 416 | 395 | 280 | 376 |
| all unpaid/paid | 409 | 444 | 428 | 419 | 421 | 419 | 411 | 442 | 427 |
| Bihar | |||||||||
| self development/ self care/ self maintenance, etc. | 1169 | 1091 | 1130 | 1149 | 1105 | 1128 | 1167 | 1092 | 1130 |
| all unpaid | 135 | 408 | 306 | 112 | 385 | 283 | 132 | 406 | 304 |
| all paid | 382 | 221 | 355 | 446 | 308 | 429 | 389 | 229 | 363 |
| all unpaid/paid | 404 | 437 | 421 | 417 | 414 | 415 | 405 | 434 | 421 |
| Chhattisgarh | |||||||||
| self development/ self care/ self maintenance, etc. | 1125 | 1064 | 1094 | 1117 | 1116 | 1117 | 1123 | 1076 | 1099 |
| all unpaid | 192 | 332 | 282 | 108 | 315 | 249 | 177 | 328 | 275 |
| all paid | 401 | 323 | 373 | 477 | 349 | 441 | 419 | 328 | 388 |
| all unpaid/paid | 418 | 445 | 433 | 453 | 408 | 429 | 426 | 438 | 432 |
| Delhi | |||||||||
| self development/ self care/ self maintenance, etc. | 948 | 988 | 964 | 1039 | 1077 | 1055 | 1034 | 1073 | 1051 |
| all unpaid | 141 | 444 | 290 | 101 | 392 | 268 | 104 | 394 | 269 |
| all paid | 516 | 469 | 511 | 509 | 411 | 498 | 510 | 414 | 499 |
| all unpaid/paid | 595 | 525 | 566 | 517 | 443 | 484 | 522 | 447 | 488 |
| Goa | |||||||||
| self development/ self care/ self maintenance, etc. | 1113 | 1106 | 1110 | 1086 | 1108 | 1097 | 1097 | 1107 | 1102 |
| all unpaid | 128 | 319 | 257 | 89 | 316 | 229 | 104 | 318 | 241 |
| all paid | 471 | 439 | 463 | 477 | 446 | 468 | 475 | 443 | 466 |
| all unpaid/paid | 404 | 385 | 394 | 453 | 405 | 429 | 434 | 397 | 415 |
| Gujarat | |||||||||
| self development/ self care/ self maintenance, etc. | 1143 | 1043 | 1094 | 1103 | 1077 | 1091 | 1125 | 1058 | 1092 |
| all unpaid | 107 | 359 | 291 | 94 | 350 | 272 | 101 | 355 | 283 |
| all paid | 383 | 273 | 348 | 475 | 335 | 446 | 423 | 292 | 387 |
| all unpaid/paid | 389 | 455 | 424 | 461 | 420 | 440 | 421 | 440 | 431 |
Statement 13.1: Minutes spent in a day on an average per participant in self development, unpaid activities and paid activities irrespective of whether it is a major activity or not (considering all the activities in a time slot)
| Activity | rural | urban | rural+urban | ||||||
|---|---|---|---|---|---|---|---|---|---|
| male | female | person | male | female | person | male | female | person | |
| (1) | (2) | (3) | (4) | (5) | (6) | (7) | (8) | (9) | (10) |
| Haryana | |||||||||
| self development/ self care/ self maintenance, etc. | 1155 | 1086 | 1122 | 1088 | 1094 | 1091 | 1123 | 1090 | 1107 |
| all unpaid | 120 | 384 | 291 | 93 | 365 | 255 | 106 | 376 | 274 |
| all paid | 411 | 273 | 385 | 485 | 371 | 468 | 448 | 316 | 425 |
| all unpaid/paid | 408 | 427 | 418 | 470 | 424 | 448 | 438 | 426 | 432 |
| Himachal Pradesh | |||||||||
| self development/ self care/ self maintenance, etc. | 1129 | 1040 | 1083 | 1087 | 1100 | 1093 | 1124 | 1047 | 1084 |
| all unpaid | 152 | 416 | 321 | 102 | 311 | 225 | 146 | 405 | 310 |
| all paid | 431 | 241 | 383 | 459 | 380 | 439 | 435 | 262 | 391 |
| all unpaid/paid | 407 | 460 | 436 | 459 | 400 | 429 | 414 | 453 | 435 |
| Jharkhand | |||||||||
| self development/ self care/ self maintenance, etc. | 1127 | 1034 | 1080 | 1125 | 1077 | 1102 | 1127 | 1042 | 1085 |
| all unpaid | 153 | 423 | 318 | 107 | 380 | 278 | 145 | 415 | 310 |
| all paid | 405 | 237 | 362 | 466 | 322 | 437 | 417 | 250 | 376 |
| all unpaid/paid | 432 | 475 | 455 | 445 | 434 | 439 | 434 | 467 | 452 |
| Karnataka | |||||||||
| self development/ self care/ self maintenance, etc. | 1126 | 1062 | 1094 | 1121 | 1088 | 1105 | 1124 | 1072 | 1099 |
| all unpaid | 94 | 337 | 251 | 90 | 340 | 248 | 93 | 338 | 250 |
| all paid | 386 | 307 | 363 | 442 | 344 | 419 | 408 | 319 | 384 |
| all unpaid/paid | 399 | 433 | 417 | 416 | 417 | 416 | 406 | 427 | 417 |
| Kerala | |||||||||
| self development/ self care/ self maintenance, etc. | 1173 | 1086 | 1127 | 1167 | 1099 | 1131 | 1170 | 1092 | 1129 |
| all unpaid | 111 | 332 | 252 | 109 | 321 | 244 | 110 | 327 | 248 |
| all paid | 417 | 339 | 392 | 431 | 349 | 405 | 424 | 344 | 399 |
| all unpaid/paid | 352 | 408 | 383 | 364 | 400 | 385 | 358 | 404 | 384 |
| Madhya Pradesh | |||||||||
| self development/ self care/ self maintenance, etc. | 1119 | 1010 | 1066 | 1122 | 1083 | 1103 | 1120 | 1031 | 1077 |
| all unpaid | 145 | 411 | 302 | 110 | 366 | 278 | 137 | 398 | 296 |
| all paid | 372 | 289 | 351 | 442 | 334 | 422 | 392 | 298 | 369 |
| all unpaid/paid | 409 | 488 | 449 | 428 | 419 | 424 | 414 | 469 | 442 |
| Maharashtra | |||||||||
| self development/ self care/ self maintenance, etc. | 1129 | 1029 | 1080 | 1111 | 1092 | 1102 | 1121 | 1056 | 1090 |
| all unpaid | 110 | 334 | 263 | 88 | 328 | 253 | 101 | 331 | 258 |
| all paid | 404 | 335 | 381 | 474 | 377 | 453 | 434 | 347 | 408 |
| all unpaid/paid | 410 | 468 | 440 | 445 | 404 | 424 | 425 | 441 | 433 |
| Manipur | |||||||||
| self development/ self care/ self maintenance, etc. | 1161 | 1050 | 1107 | 1147 | 1044 | 1095 | 1157 | 1049 | 1103 |
| all unpaid | 131 | 369 | 270 | 118 | 344 | 249 | 126 | 361 | 263 |
| all paid | 364 | 271 | 332 | 387 | 292 | 348 | 371 | 278 | 337 |
| all unpaid/paid | 384 | 471 | 429 | 389 | 471 | 433 | 385 | 471 | 430 |
Statement 13.1: Minutes spent in a day on an average per participant in self development, unpaid activities and paid activities irrespective of whether it is a major activity or not (considering all the activities in a time slot)
| Activity | rural | urban | rural+urban | ||||||
|---|---|---|---|---|---|---|---|---|---|
| male | female | person | male | female | person | male | female | person | |
| (1) | (2) | (3) | (4) | (5) | (6) | (7) | (8) | (9) | (10) |
| Meghalaya | |||||||||
| self development/ self care/ self maintenance, etc. | 1165 | 1083 | 1122 | 1150 | 1111 | 1130 | 1162 | 1088 | 1124 |
| all unpaid | 129 | 354 | 269 | 118 | 318 | 245 | 127 | 347 | 265 |
| all paid | 404 | 340 | 387 | 424 | 373 | 410 | 408 | 346 | 391 |
| all unpaid/paid | 369 | 423 | 399 | 367 | 388 | 379 | 369 | 416 | 395 |
| Mizoram | |||||||||
| self development/ self care/ self maintenance, etc. | 1127 | 1003 | 1067 | 1151 | 1042 | 1096 | 1137 | 1020 | 1079 |
| all unpaid | 111 | 365 | 261 | 114 | 352 | 265 | 112 | 359 | 263 |
| all paid | 357 | 323 | 347 | 381 | 356 | 374 | 367 | 335 | 358 |
| all unpaid/paid | 384 | 469 | 428 | 381 | 429 | 408 | 383 | 451 | 419 |
| Nagaland | |||||||||
| self development/ self care/ self maintenance, etc. | 1159 | 1062 | 1112 | 1189 | 1089 | 1141 | 1170 | 1071 | 1122 |
| all unpaid | 268 | 406 | 339 | 157 | 359 | 262 | 232 | 391 | 314 |
| all paid | 294 | 198 | 268 | 341 | 270 | 322 | 317 | 234 | 295 |
| all unpaid/paid | 331 | 421 | 377 | 307 | 400 | 354 | 323 | 414 | 369 |
| Odisha | |||||||||
| self development/ self care/ self maintenance, etc. | 1167 | 1080 | 1123 | 1140 | 1130 | 1135 | 1163 | 1089 | 1125 |
| all unpaid | 158 | 382 | 305 | 108 | 329 | 255 | 150 | 374 | 297 |
| all paid | 359 | 277 | 341 | 429 | 332 | 410 | 371 | 285 | 353 |
| all unpaid/paid | 374 | 429 | 404 | 405 | 381 | 392 | 379 | 421 | 402 |
| Punjab | |||||||||
| self development/ self care/ self maintenance, etc. | 1111 | 1088 | 1100 | 1095 | 1091 | 1093 | 1104 | 1089 | 1097 |
| all unpaid | 116 | 357 | 269 | 107 | 332 | 248 | 113 | 347 | 261 |
| all paid | 436 | 267 | 399 | 465 | 352 | 441 | 448 | 300 | 416 |
| all unpaid/paid | 434 | 416 | 425 | 445 | 408 | 427 | 438 | 413 | 425 |
| Rajasthan | |||||||||
| self development/ self care/ self maintenance, etc. | 1151 | 1043 | 1095 | 1123 | 1116 | 1120 | 1143 | 1061 | 1102 |
| all unpaid | 144 | 379 | 295 | 93 | 329 | 243 | 132 | 367 | 282 |
| all paid | 408 | 263 | 357 | 466 | 323 | 438 | 426 | 273 | 378 |
| all unpaid/paid | 395 | 459 | 431 | 430 | 388 | 409 | 405 | 442 | 425 |
| Sikkim | |||||||||
| self development/ self care/ self maintenance, etc. | 1082 | 1047 | 1065 | 1042 | 1004 | 1025 | 1072 | 1036 | 1055 |
| all unpaid | 157 | 355 | 265 | 121 | 346 | 241 | 148 | 352 | 259 |
| all paid | 377 | 286 | 353 | 480 | 374 | 451 | 404 | 309 | 379 |
| all unpaid/paid | 423 | 429 | 426 | 447 | 454 | 450 | 429 | 435 | 432 |
| Tamil Nadu | |||||||||
| self development/ self care/ self maintenance, etc. | 1149 | 1098 | 1122 | 1123 | 1108 | 1115 | 1136 | 1103 | 1119 |
| all unpaid | 89 | 265 | 207 | 85 | 287 | 215 | 87 | 275 | 211 |
| all paid | 402 | 311 | 366 | 440 | 366 | 419 | 421 | 332 | 390 |
| all unpaid/paid | 381 | 396 | 389 | 404 | 388 | 396 | 392 | 392 | 392 |
Statement 13.1: Minutes spent in a day on an average per participant in self development, unpaid activities and paid activities irrespective of whether it is a major activity or not (considering all the activities in a time slot)
| Activity | rural | urban | rural+urban | ||||||
|---|---|---|---|---|---|---|---|---|---|
| male | female | person | male | female | person | male | female | person | |
| (1) | (2) | (3) | (4) | (5) | (6) | (7) | (8) | (9) | (10) |
| Telangana | |||||||||
| self development/ self care/ self maintenance, etc. | 1136 | 1054 | 1094 | 1136 | 1089 | 1113 | 1136 | 1068 | 1102 |
| all unpaid | 93 | 295 | 220 | 90 | 327 | 231 | 91 | 308 | 224 |
| all paid | 381 | 309 | 352 | 438 | 359 | 416 | 404 | 323 | 375 |
| all unpaid/paid | 392 | 445 | 420 | 406 | 422 | 414 | 398 | 436 | 418 |
| Tripura | |||||||||
| self development/ self care/ self maintenance, etc. | 1133 | 1096 | 1114 | 1151 | 1130 | 1140 | 1137 | 1103 | 1120 |
| all unpaid | 125 | 350 | 264 | 107 | 318 | 244 | 122 | 343 | 260 |
| all paid | 370 | 270 | 349 | 420 | 304 | 394 | 380 | 277 | 358 |
| all unpaid/paid | 395 | 399 | 397 | 396 | 368 | 381 | 395 | 393 | 394 |
| Uttar Pradesh | |||||||||
| self development/ self care/ self maintenance, etc. | 1132 | 1065 | 1098 | 1117 | 1089 | 1103 | 1129 | 1070 | 1099 |
| all unpaid | 158 | 408 | 316 | 109 | 382 | 289 | 149 | 403 | 311 |
| all paid | 403 | 231 | 369 | 461 | 340 | 444 | 416 | 248 | 384 |
| all unpaid/paid | 418 | 443 | 431 | 443 | 420 | 431 | 423 | 438 | 431 |
| Uttarakhand | |||||||||
| self development/ self care/ self maintenance, etc. | 1176 | 1105 | 1141 | 1157 | 1139 | 1148 | 1171 | 1114 | 1143 |
| all unpaid | 139 | 368 | 282 | 98 | 313 | 230 | 128 | 354 | 269 |
| all paid | 384 | 263 | 367 | 415 | 334 | 401 | 393 | 286 | 377 |
| all unpaid/paid | 356 | 391 | 375 | 372 | 356 | 364 | 360 | 382 | 372 |
| West Bengal | |||||||||
| self development/ self care/ self maintenance, etc. | 1139 | 1075 | 1107 | 1121 | 1094 | 1107 | 1133 | 1081 | 1107 |
| all unpaid | 122 | 386 | 294 | 105 | 346 | 263 | 117 | 374 | 285 |
| all paid | 377 | 248 | 350 | 448 | 316 | 415 | 398 | 271 | 369 |
| all unpaid/paid | 393 | 436 | 415 | 425 | 413 | 419 | 402 | 429 | 416 |
| A \& N Islands | |||||||||
| self development/ self care/ self maintenance, etc. | 1114 | 1071 | 1094 | 1158 | 1133 | 1146 | 1130 | 1095 | 1114 |
| all unpaid | 155 | 360 | 273 | 95 | 291 | 225 | 139 | 336 | 258 |
| all paid | 430 | 399 | 424 | 488 | 425 | 472 | 449 | 411 | 442 |
| all unpaid/paid | 433 | 422 | 428 | 429 | 392 | 410 | 432 | 412 | 422 |
| Chandigarh | |||||||||
| self development/ self care/ self maintenance, etc. | – | – | – | 1080 | 1109 | 1094 | 1080 | 1109 | 1094 |
| all unpaid | – | – | – | 112 | 309 | 235 | 112 | 309 | 235 |
| all paid | – | – | – | 471 | 373 | 449 | 471 | 373 | 449 |
| all unpaid/paid | – | – | – | 467 | 405 | 437 | 467 | 405 | 437 |
| Dadra \& Nagar Haveli and Daman \& Diu | |||||||||
| self development/ self care/ self maintenance, etc. | 1095 | 1056 | 1076 | 972 | 1044 | 1002 | 1013 | 1049 | 1029 |
| all unpaid | 101 | 292 | 227 | 102 | 290 | 206 | 102 | 291 | 213 |
| all paid | 529 | 403 | 484 | 579 | 464 | 550 | 565 | 439 | 528 |
| all unpaid/paid | 491 | 455 | 472 | 595 | 474 | 543 | 563 | 466 | 518 |
Statement 13.1: Minutes spent in a day on an average per participant in self development, unpaid activities and paid activities irrespective of whether it is a major activity or not (considering all the activities in a time slot)
| Activity | rural | urban | rural+urban | ||||||
|---|---|---|---|---|---|---|---|---|---|
| male | female | person | male | female | person | male | female | person | |
| (1) | (2) | (3) | (4) | (5) | (6) | (7) | (8) | (9) | (10) |
| Jammu \& Kashmir | |||||||||
| self development/ self care/ self maintenance, etc. | 1167 | 1114 | 1141 | 1124 | 1082 | 1104 | 1156 | 1106 | 1131 |
| all unpaid | 147 | 392 | 292 | 95 | 375 | 291 | 138 | 388 | 292 |
| all paid | 372 | 284 | 366 | 453 | 315 | 425 | 396 | 302 | 385 |
| all unpaid/paid | 371 | 405 | 388 | 430 | 437 | 434 | 386 | 413 | 400 |
| Ladakh | |||||||||
| self development/ self care/ self maintenance, etc. | 1157 | 1060 | 1111 | 1146 | 1052 | 1103 | 1156 | 1059 | 1110 |
| all unpaid | 99 | 427 | 285 | 104 | 394 | 286 | 100 | 423 | 285 |
| all paid | 361 | 282 | 355 | 397 | 334 | 388 | 365 | 293 | 359 |
| all unpaid/paid | 360 | 442 | 401 | 393 | 436 | 415 | 363 | 442 | 402 |
| Lakshadweep | |||||||||
| self development/ self care/ self maintenance, etc. | 1169 | 1094 | 1129 | 1160 | 1113 | 1134 | 1162 | 1109 | 1133 |
| all unpaid | 123 | 354 | 276 | 119 | 336 | 259 | 120 | 340 | 262 |
| all paid | 401 | 264 | 369 | 409 | 274 | 374 | 407 | 272 | 373 |
| all unpaid/paid | 347 | 391 | 372 | 350 | 383 | 369 | 349 | 385 | 369 |
| Puducherry | |||||||||
| self development/ self care/ self maintenance, etc. | 1067 | 1015 | 1040 | 1129 | 1074 | 1099 | 1108 | 1055 | 1079 |
| all unpaid | 130 | 357 | 270 | 128 | 346 | 272 | 129 | 350 | 271 |
| all paid | 488 | 409 | 462 | 482 | 388 | 452 | 484 | 396 | 456 |
| all unpaid/paid | 459 | 471 | 465 | 409 | 430 | 421 | 426 | 443 | 436 |
| All India | |||||||||
| self development/ self care/ self maintenance, etc. | 1140 | 1063 | 1102 | 1118 | 1094 | 1106 | 1133 | 1073 | 1103 |
| all unpaid | 133 | 373 | 287 | 99 | 342 | 256 | 123 | 363 | 278 |
| all paid | 394 | 285 | 365 | 458 | 349 | 434 | 414 | 302 | 386 |
| all unpaid/paid | 403 | 443 | 424 | 432 | 410 | 421 | 412 | 433 | 423 |
Statement 14.1: Percentage of persons and minutes spent in a day on an average per participant in SNA production/Non-SNA production/residual other activities where the activity was a major activity (considering only the major activity of the time-skin)
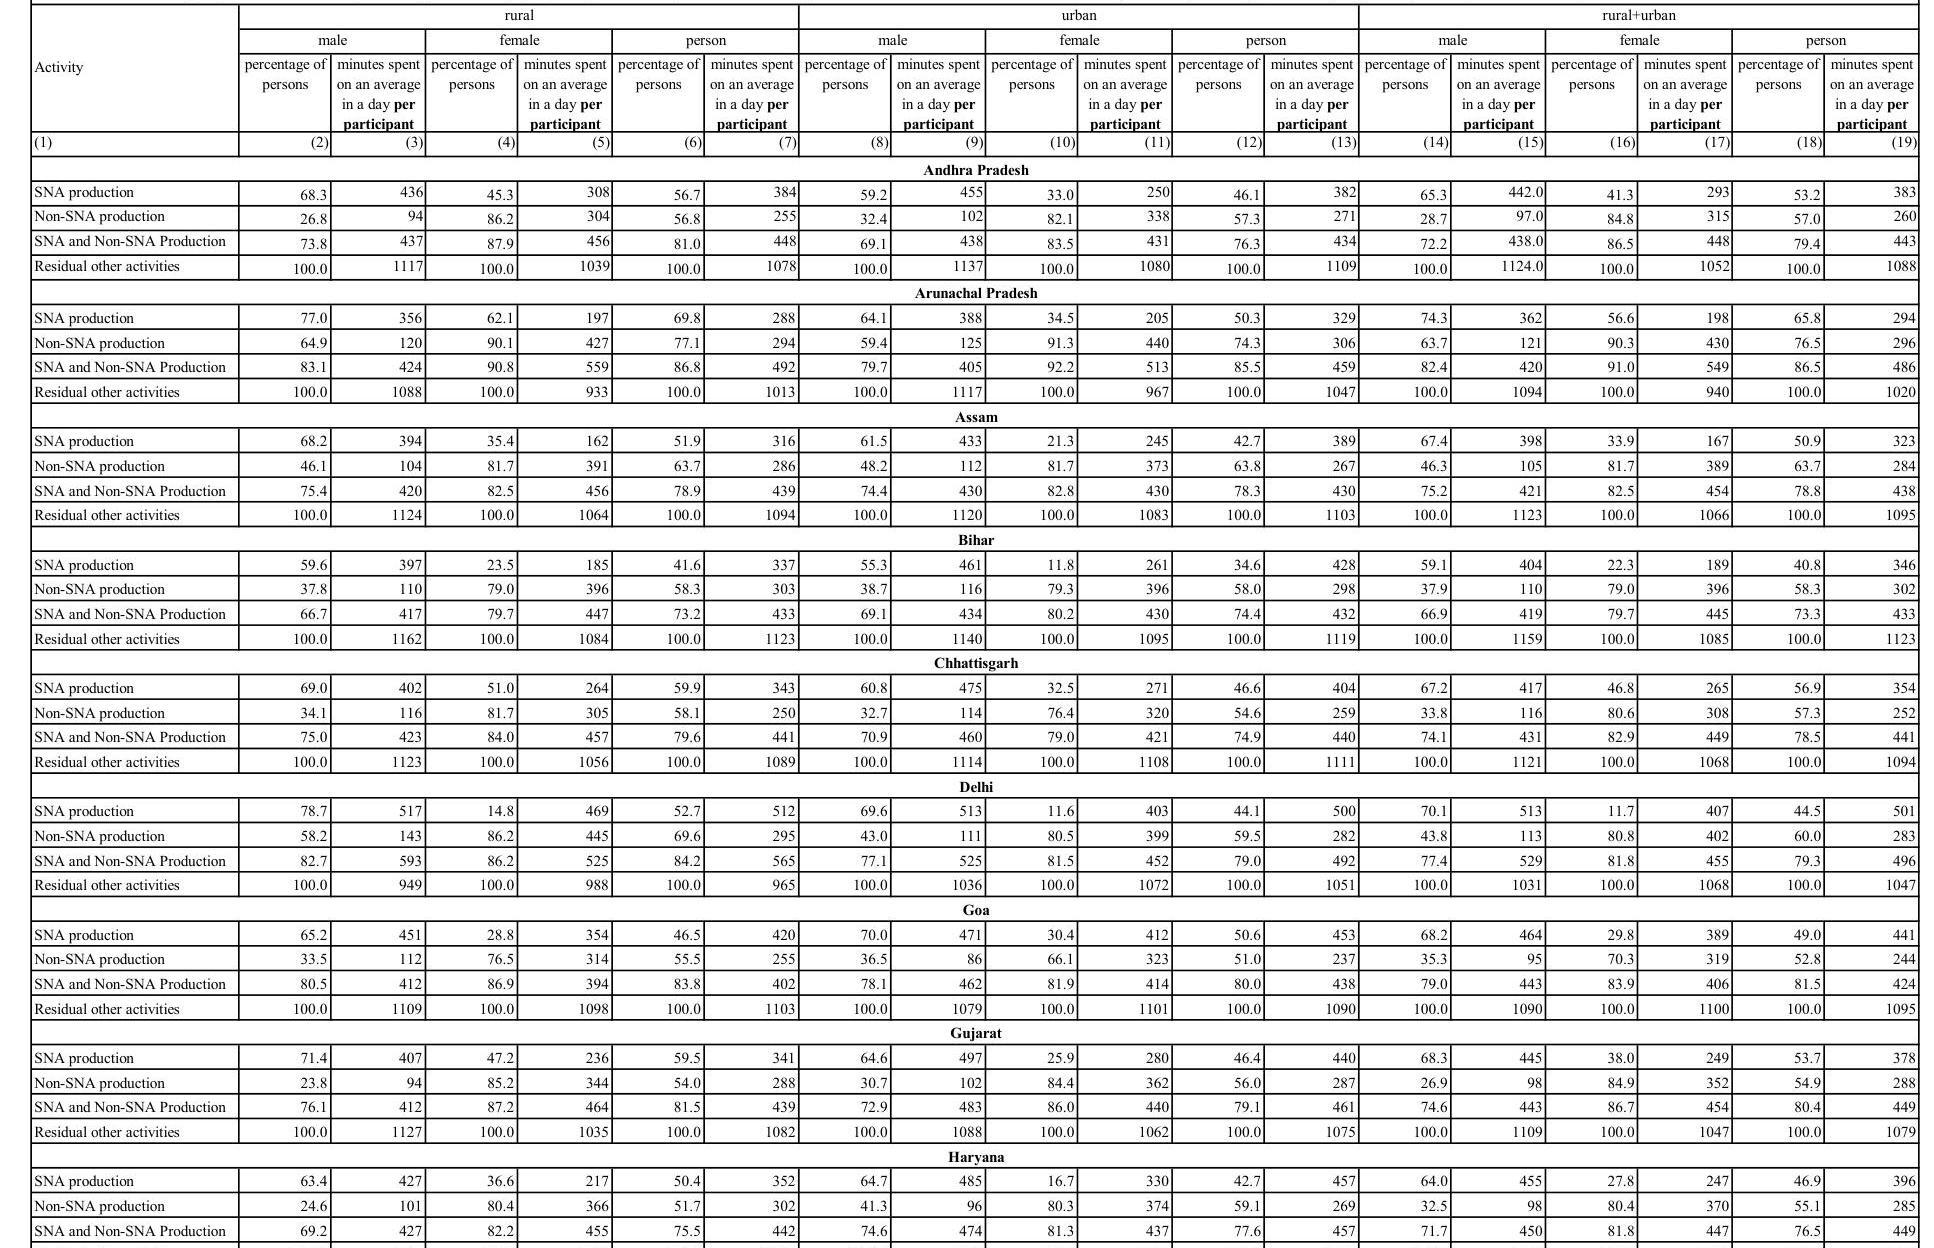
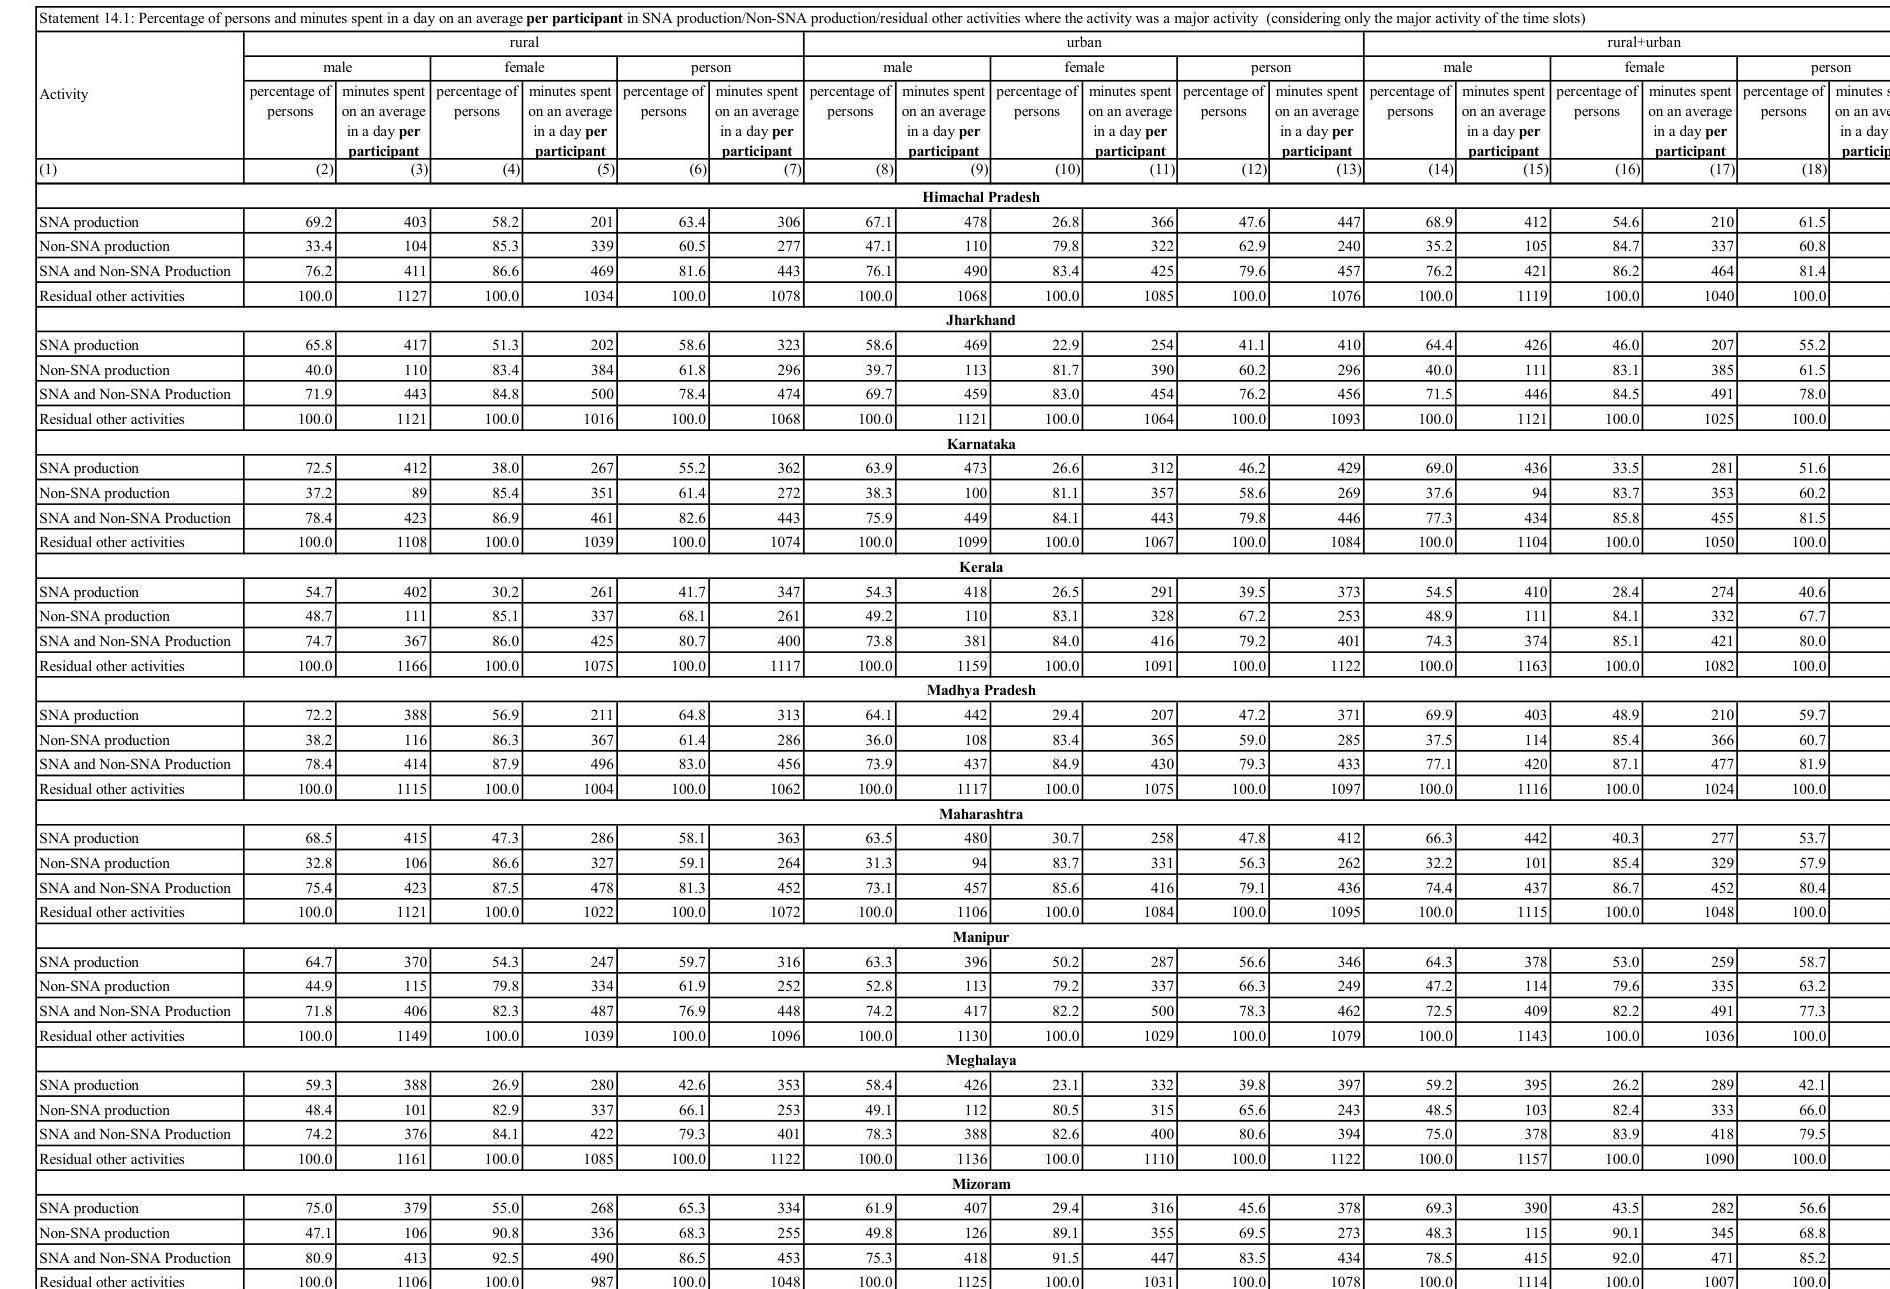
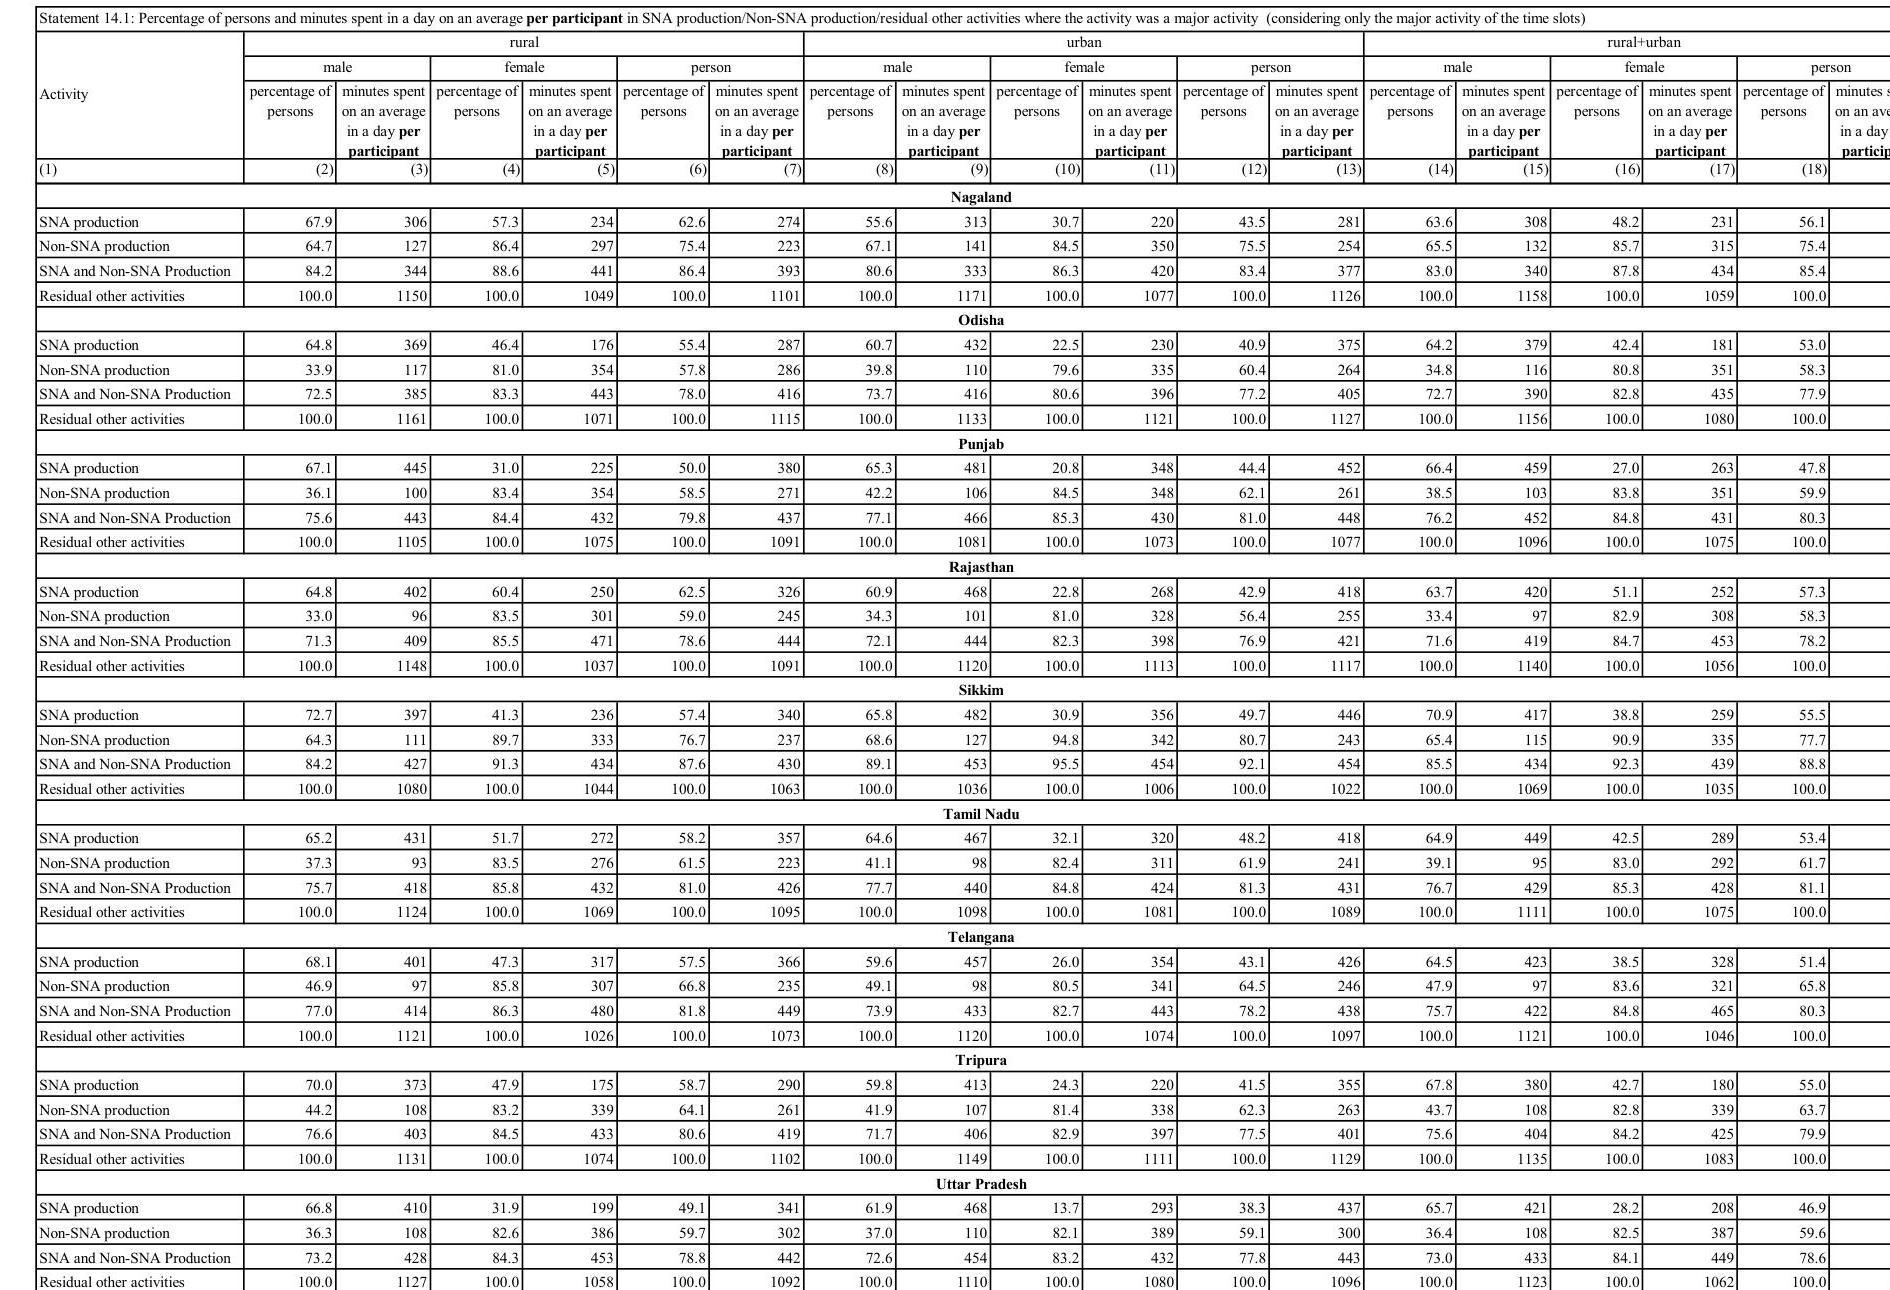
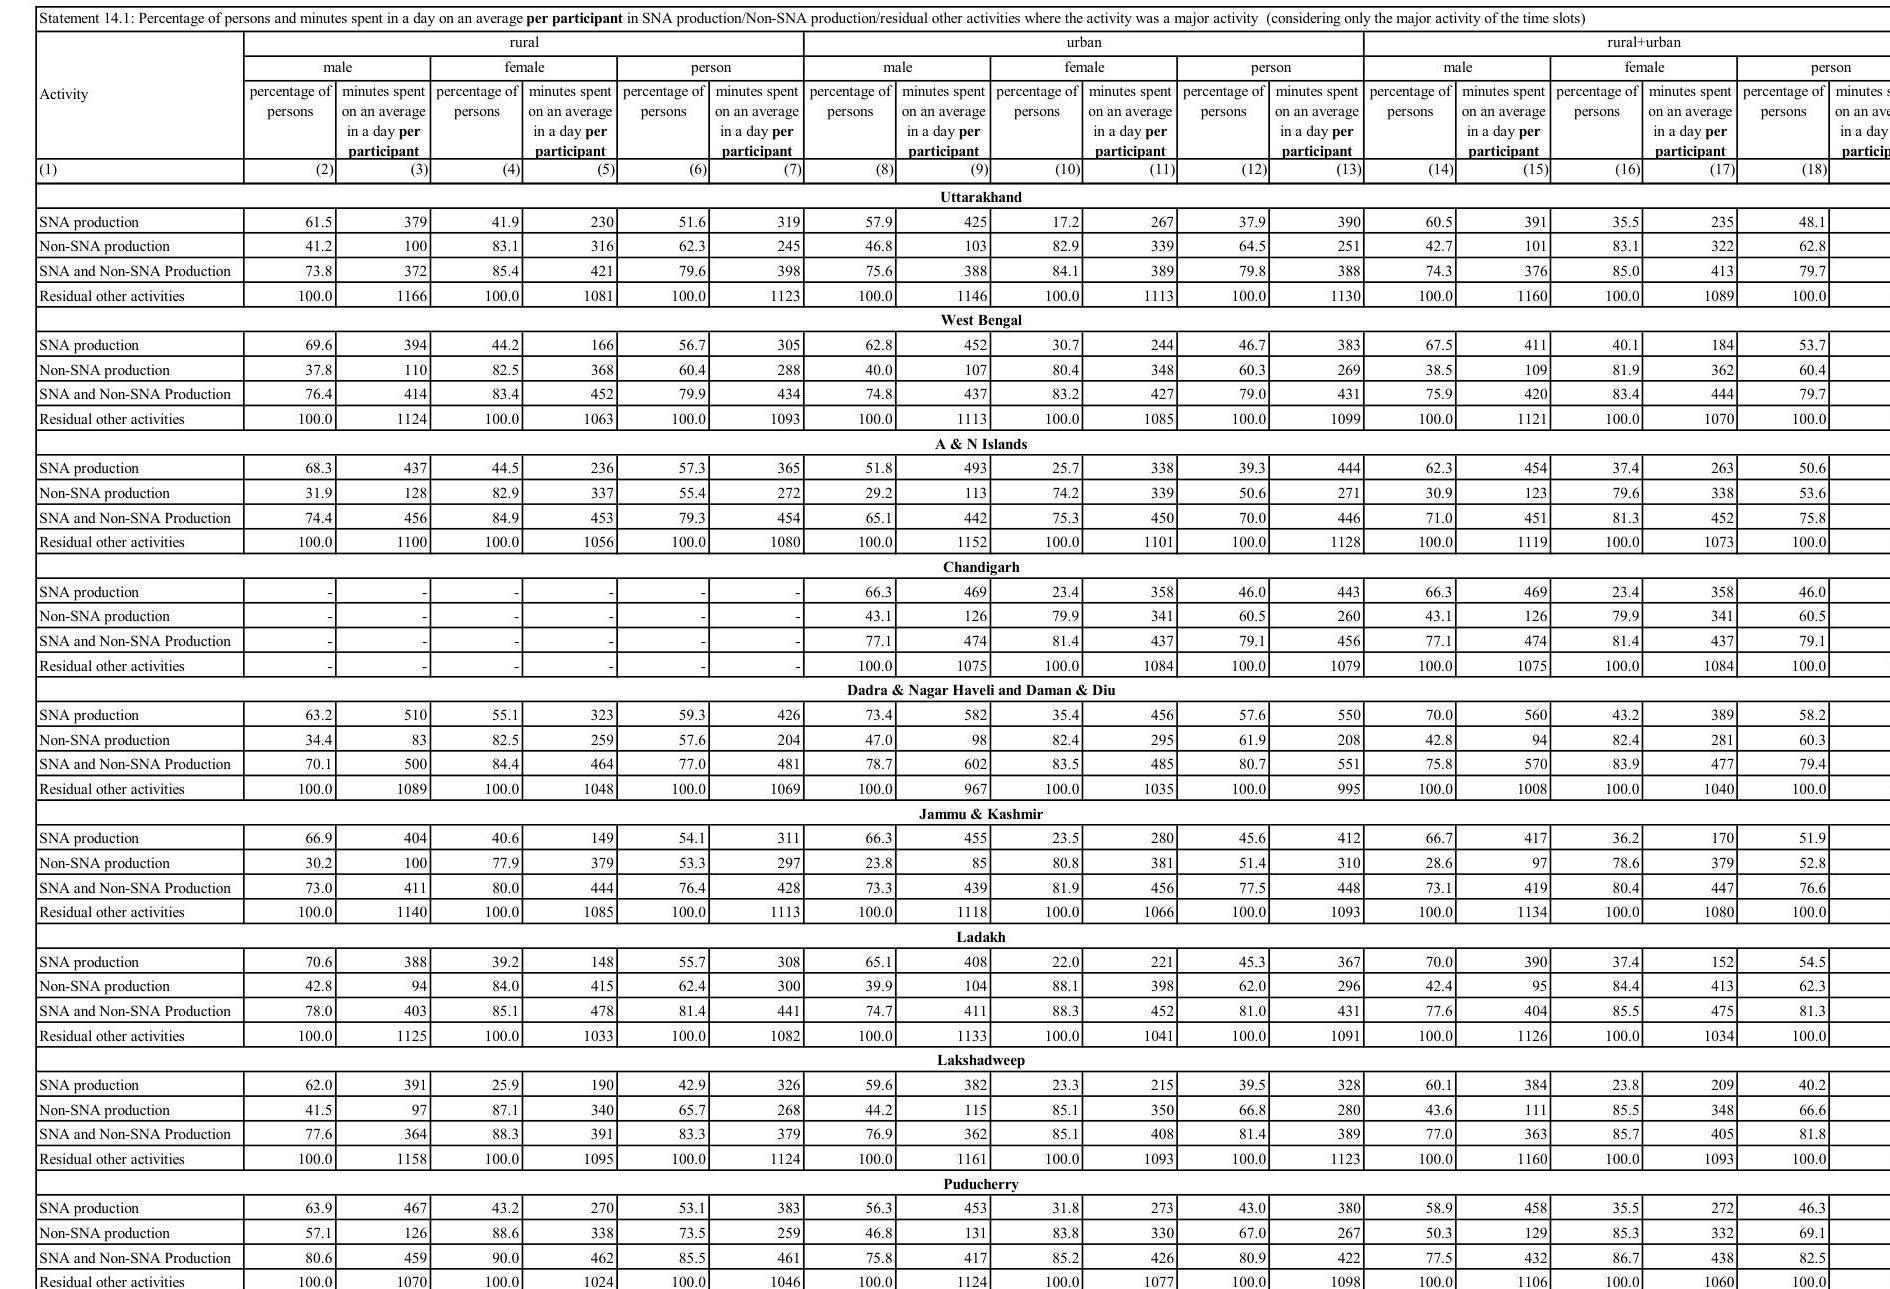
Statement 14.1: Percentage of persons and minutes spent in a day on an average per participant in SNA production/Non-SNA production/residual other activities where the activity was a major activity (considering only the major activity of the time slots)
| Activity | rural | urban | rural+urban | |||||||||||||||
|---|---|---|---|---|---|---|---|---|---|---|---|---|---|---|---|---|---|---|
| male | female | person | male | female | person | male | female | person | ||||||||||
| percentage of persons |
minutes spent on an average in a day per participant |
percentage of persons |
minutes spent on an average in a day per participant |
percentage persons |
minutes spent on an average in a day per participant |
percentage of persons |
minutes spent on an average in a day per participant |
percentage of persons |
minutes spent on an average in a day per participant |
percentage of persons |
minutes spent on an average in a day per participant |
percentage of persons |
minutes spent on an average in a day per participant |
percentage of persons |
minutes spent on an average in a day per participant |
percentage of persons |
minutes spent on an average in a day per participant |
|
| (1) | (2) | (3) | (4) | (5) | (6) | (7) | (8) | (9) | (10) | (11) | (12) | (13) | (14) | (15) | (16) | (17) | (18) | (19) |
| All India | ||||||||||||||||||
| SNA production | 66.7 | 405 | 41.5 | 226 | 54.1 | 336 | 62.6 | 460 | 25.3 | 281 | 44.5 | 416 | 65.4 | 424 | 36.6 | 239 | 51.1 | 358 |
| Non-SNA production | 16.2 | 106 | 83.2 | 354 | 59.8 | 279 | 38.0 | 104 | 82.0 | 351 | 59.4 | 269 | 36.8 | 101 | 82.8 | 333 | 59.6 | 276 |
| SNA and Non-SNA Production | 73.9 | 439 | 84.6 | 459 | 79.3 | 449 | 73.9 | 450 | 83.7 | 420 | 79.7 | 439 | 73.9 | 426 | 84.6 | 449 | 79.1 | 439 |
| Residual other activities | 100.0 | 1151 | 100.0 | 1052 | 100.0 | 1091 | 100.0 | 1100 | 100.0 | 1087 | 100.0 | 1095 | 100.0 | 1124 | 100.0 | 1061 | 100.0 | 1093 |
Statement 15.1: Percentage of persons and minutes spent in a day on an average per participant in SNA production/Non-SNA production/residual other activities irrespective of whether it is a major activity or not (considering all the activities in a time slot)
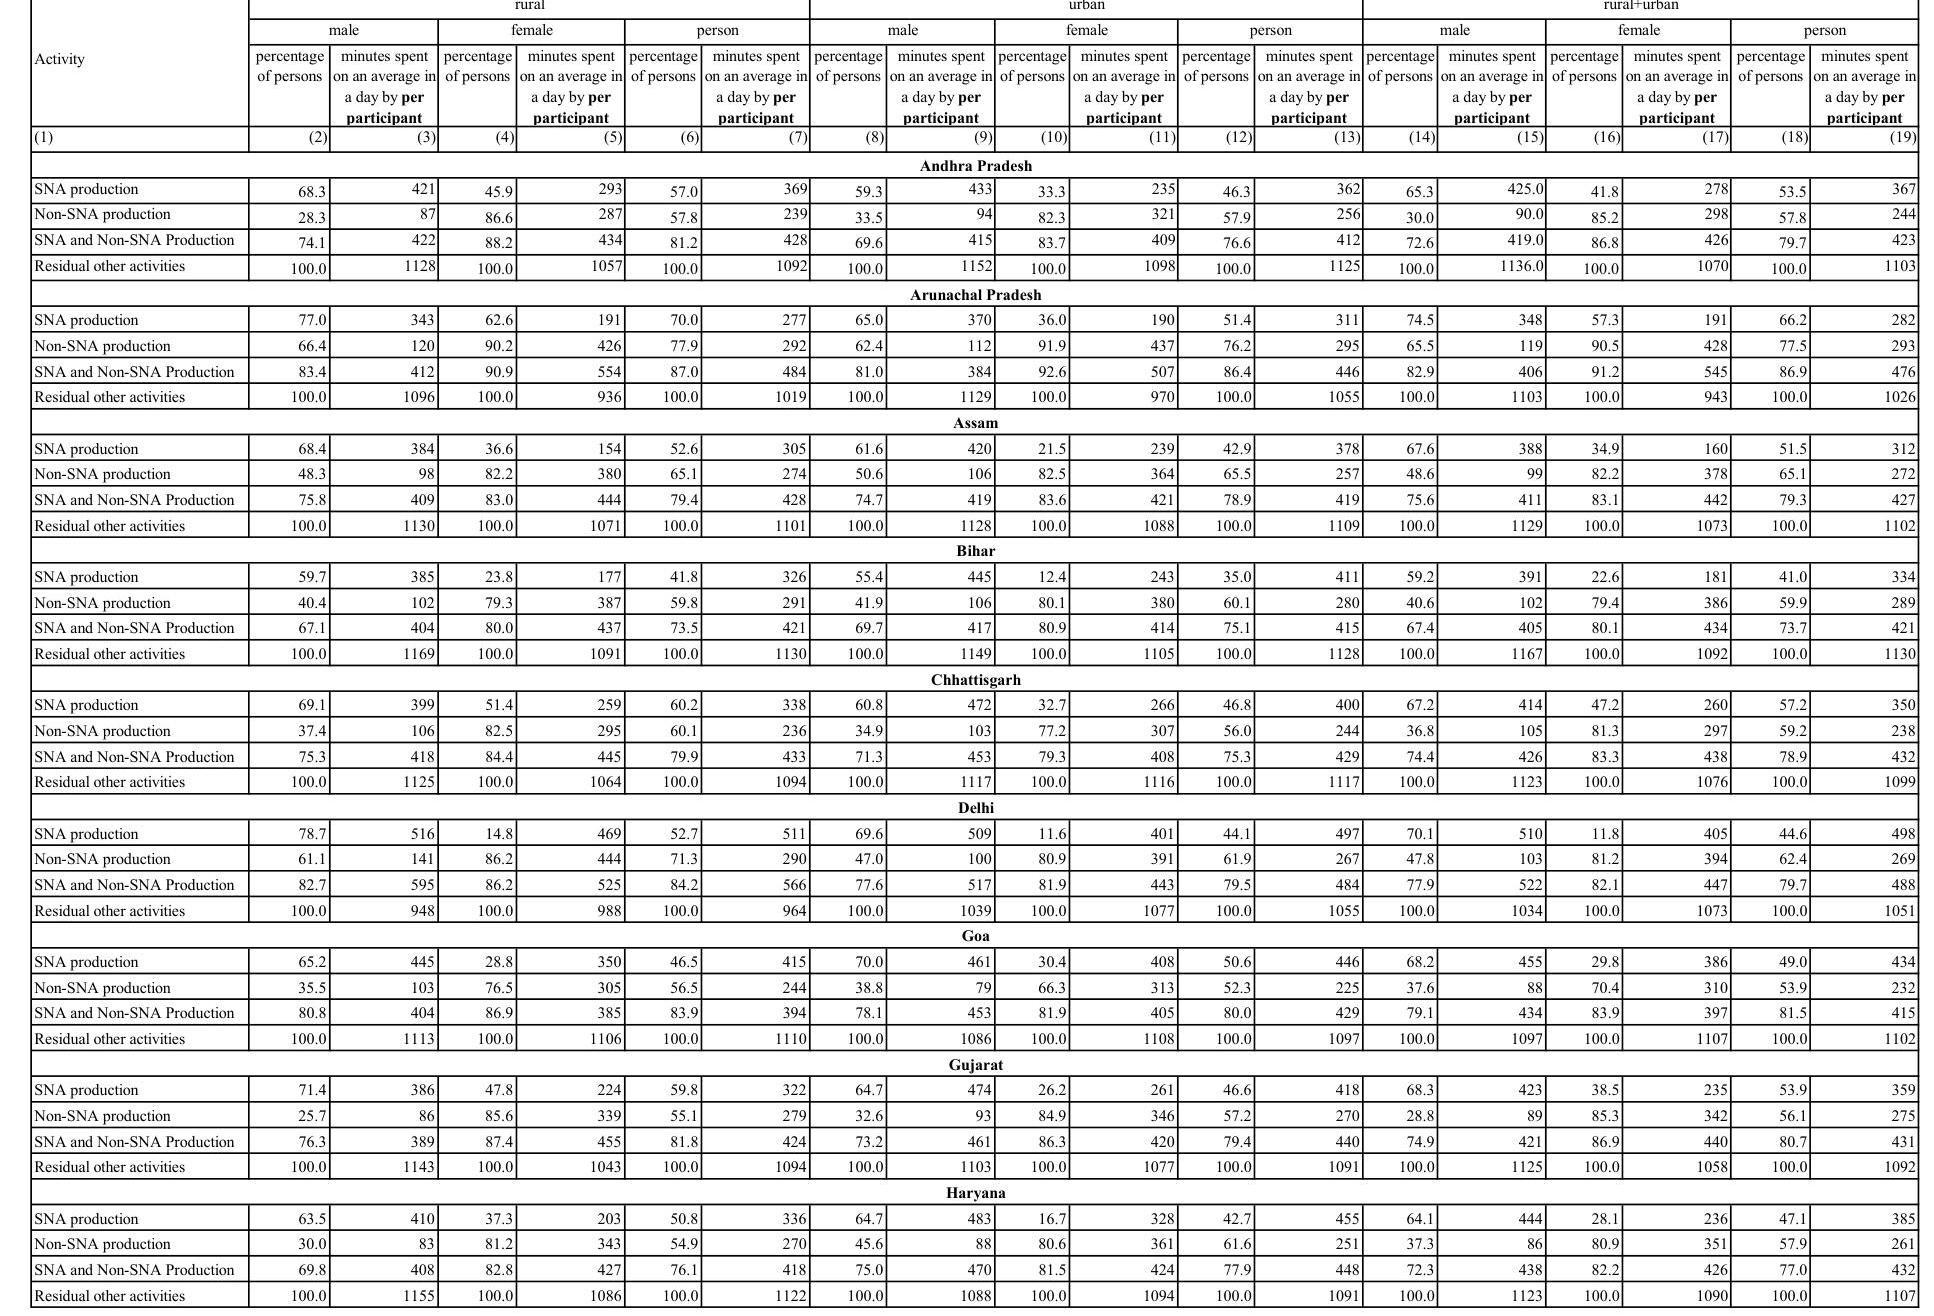
Statement 15.1: Percentage of persons and minutes spent in a day on an average per participant in SNA production/Non-SNA production/residual other activities irrespective of whether it is a major activity or not (considering all the activities in a time slot)
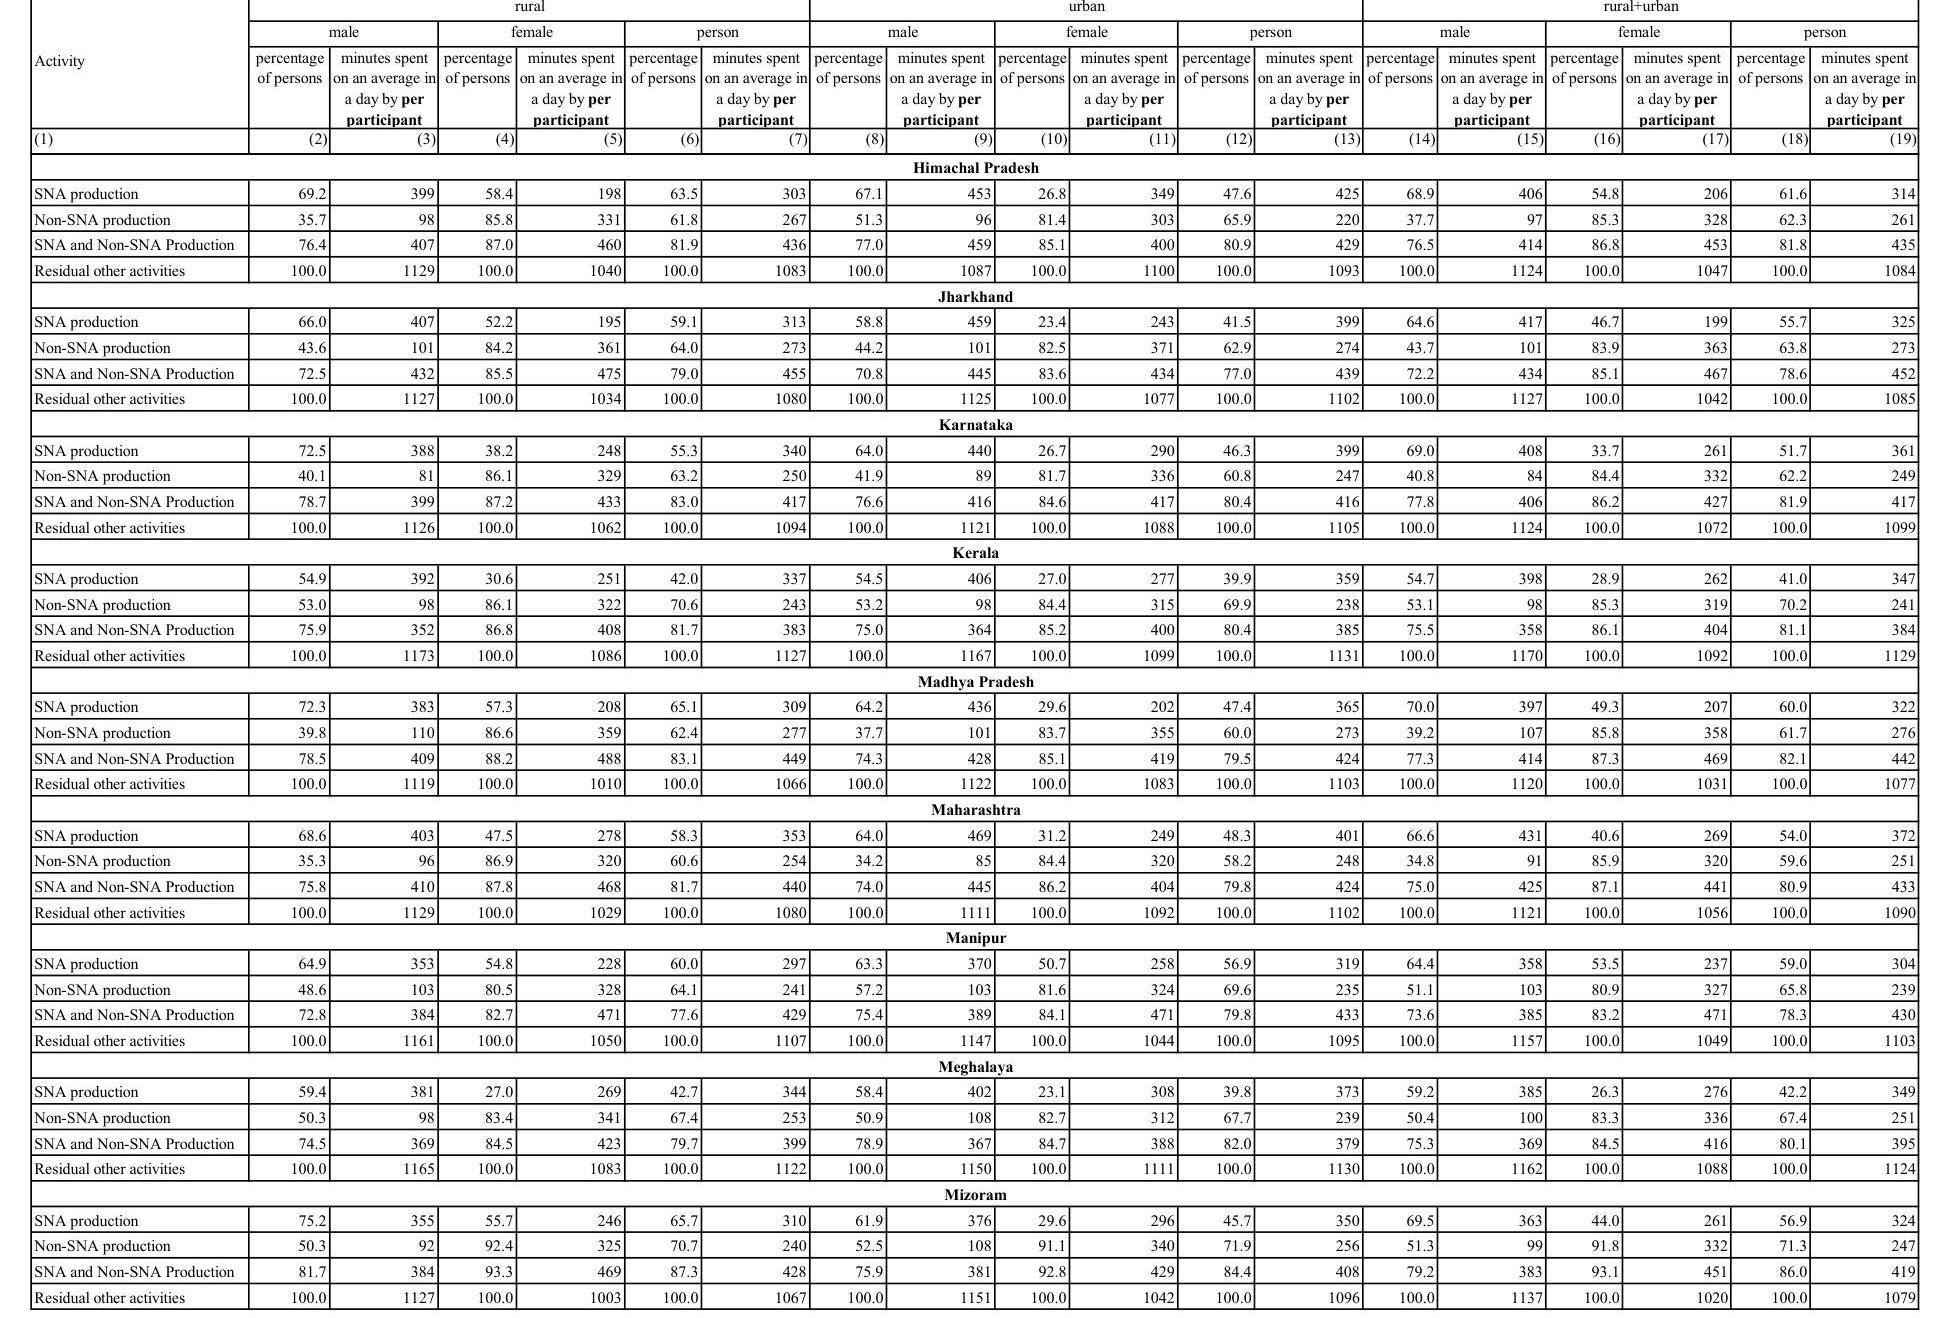
Statement 15.1: Percentage of persons and minutes spent in a day on an average per participant in SNA production/Non-SNA production/residual other activities irrespective of whether it is a major activity or not (considering all the activities in a time slot)
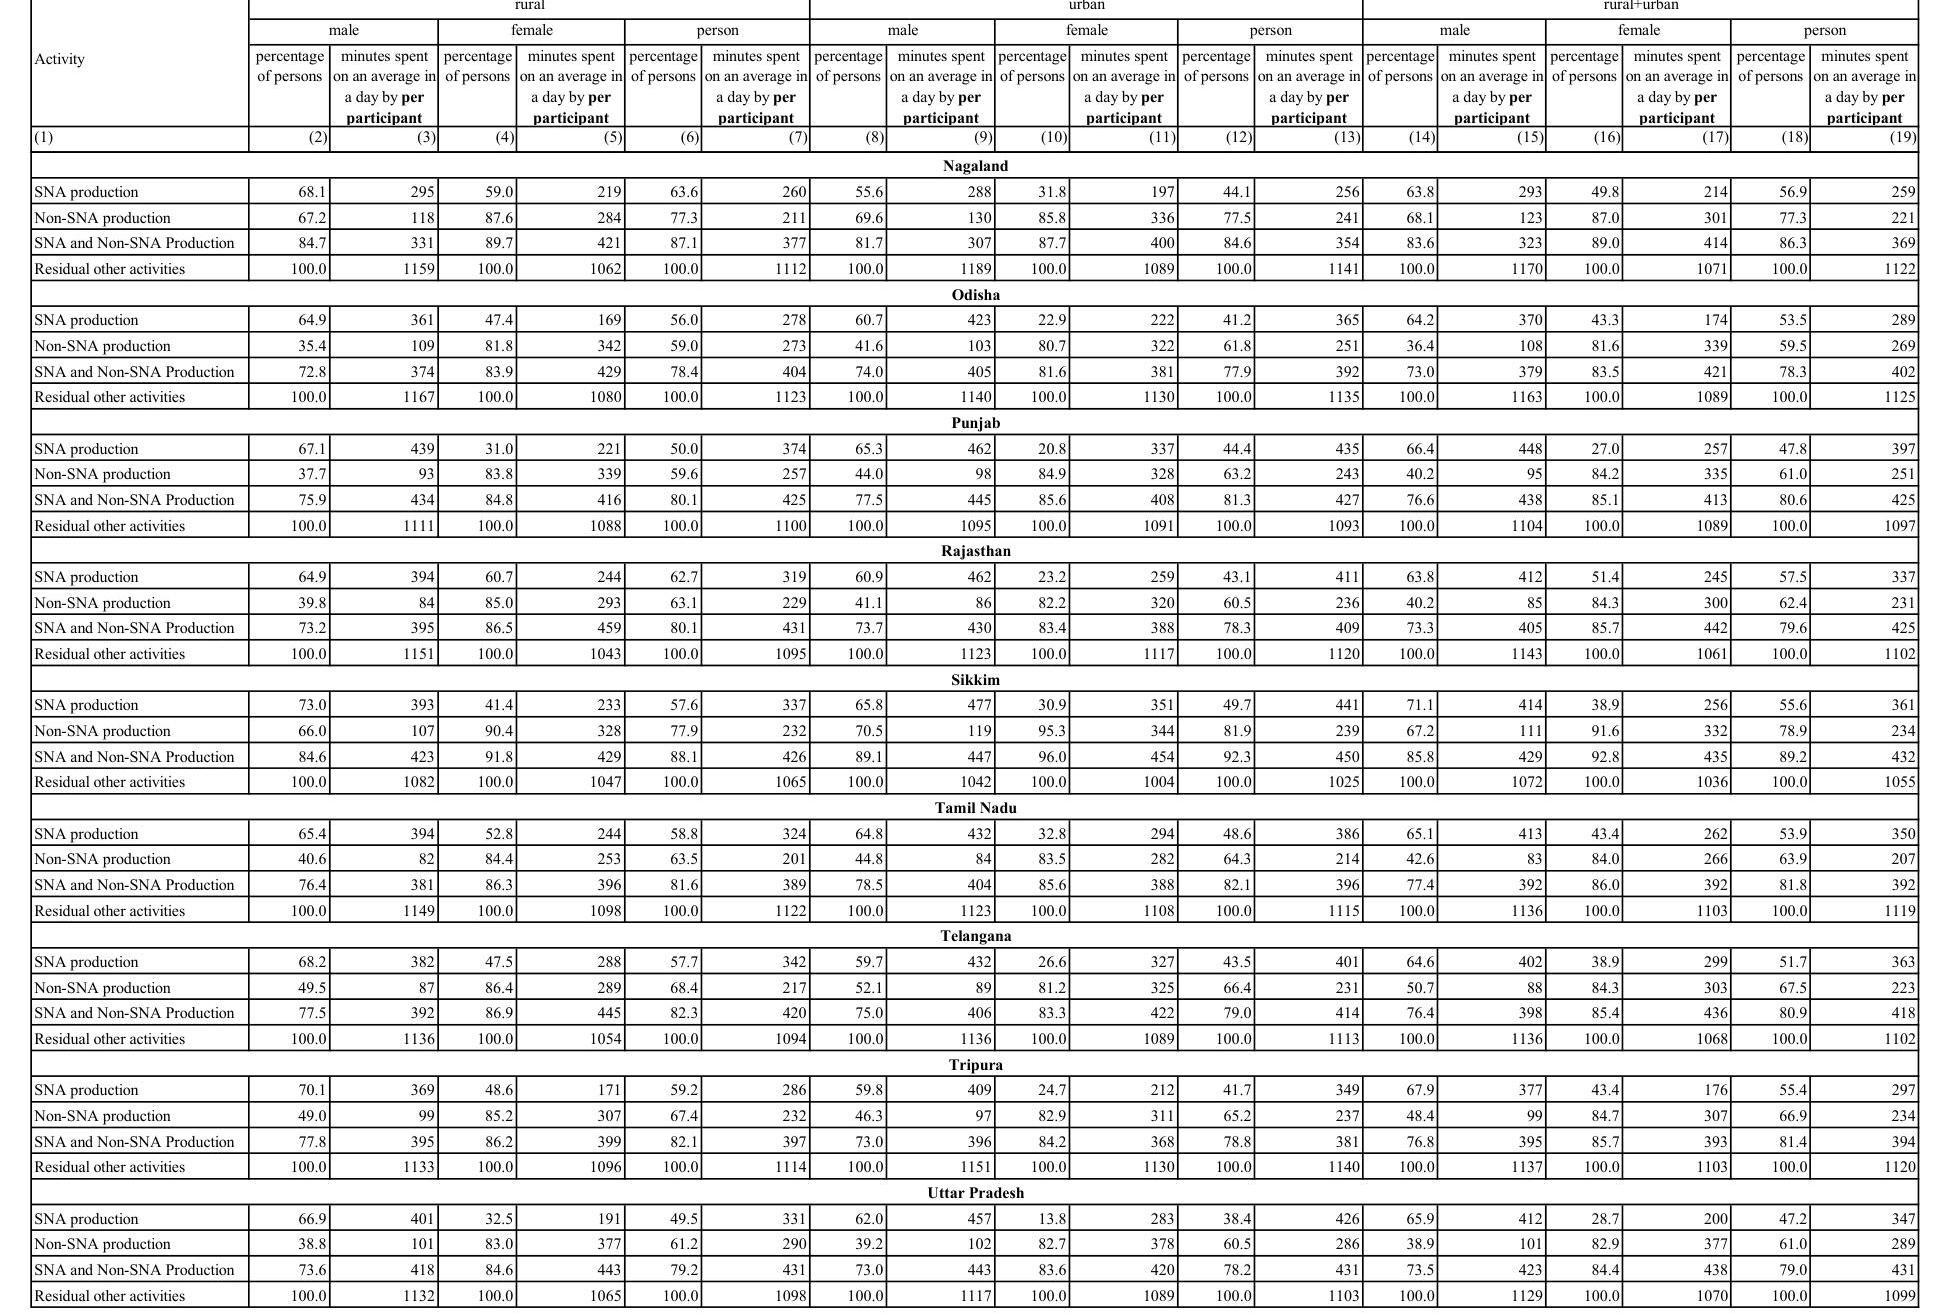
Statement 15.1: Percentage of persons and minutes spent in a day on an average per participant in SNA production/Non-SNA production/residual other activities irrespective of whether it is a major activity or not (considering all the activities in a time slot)
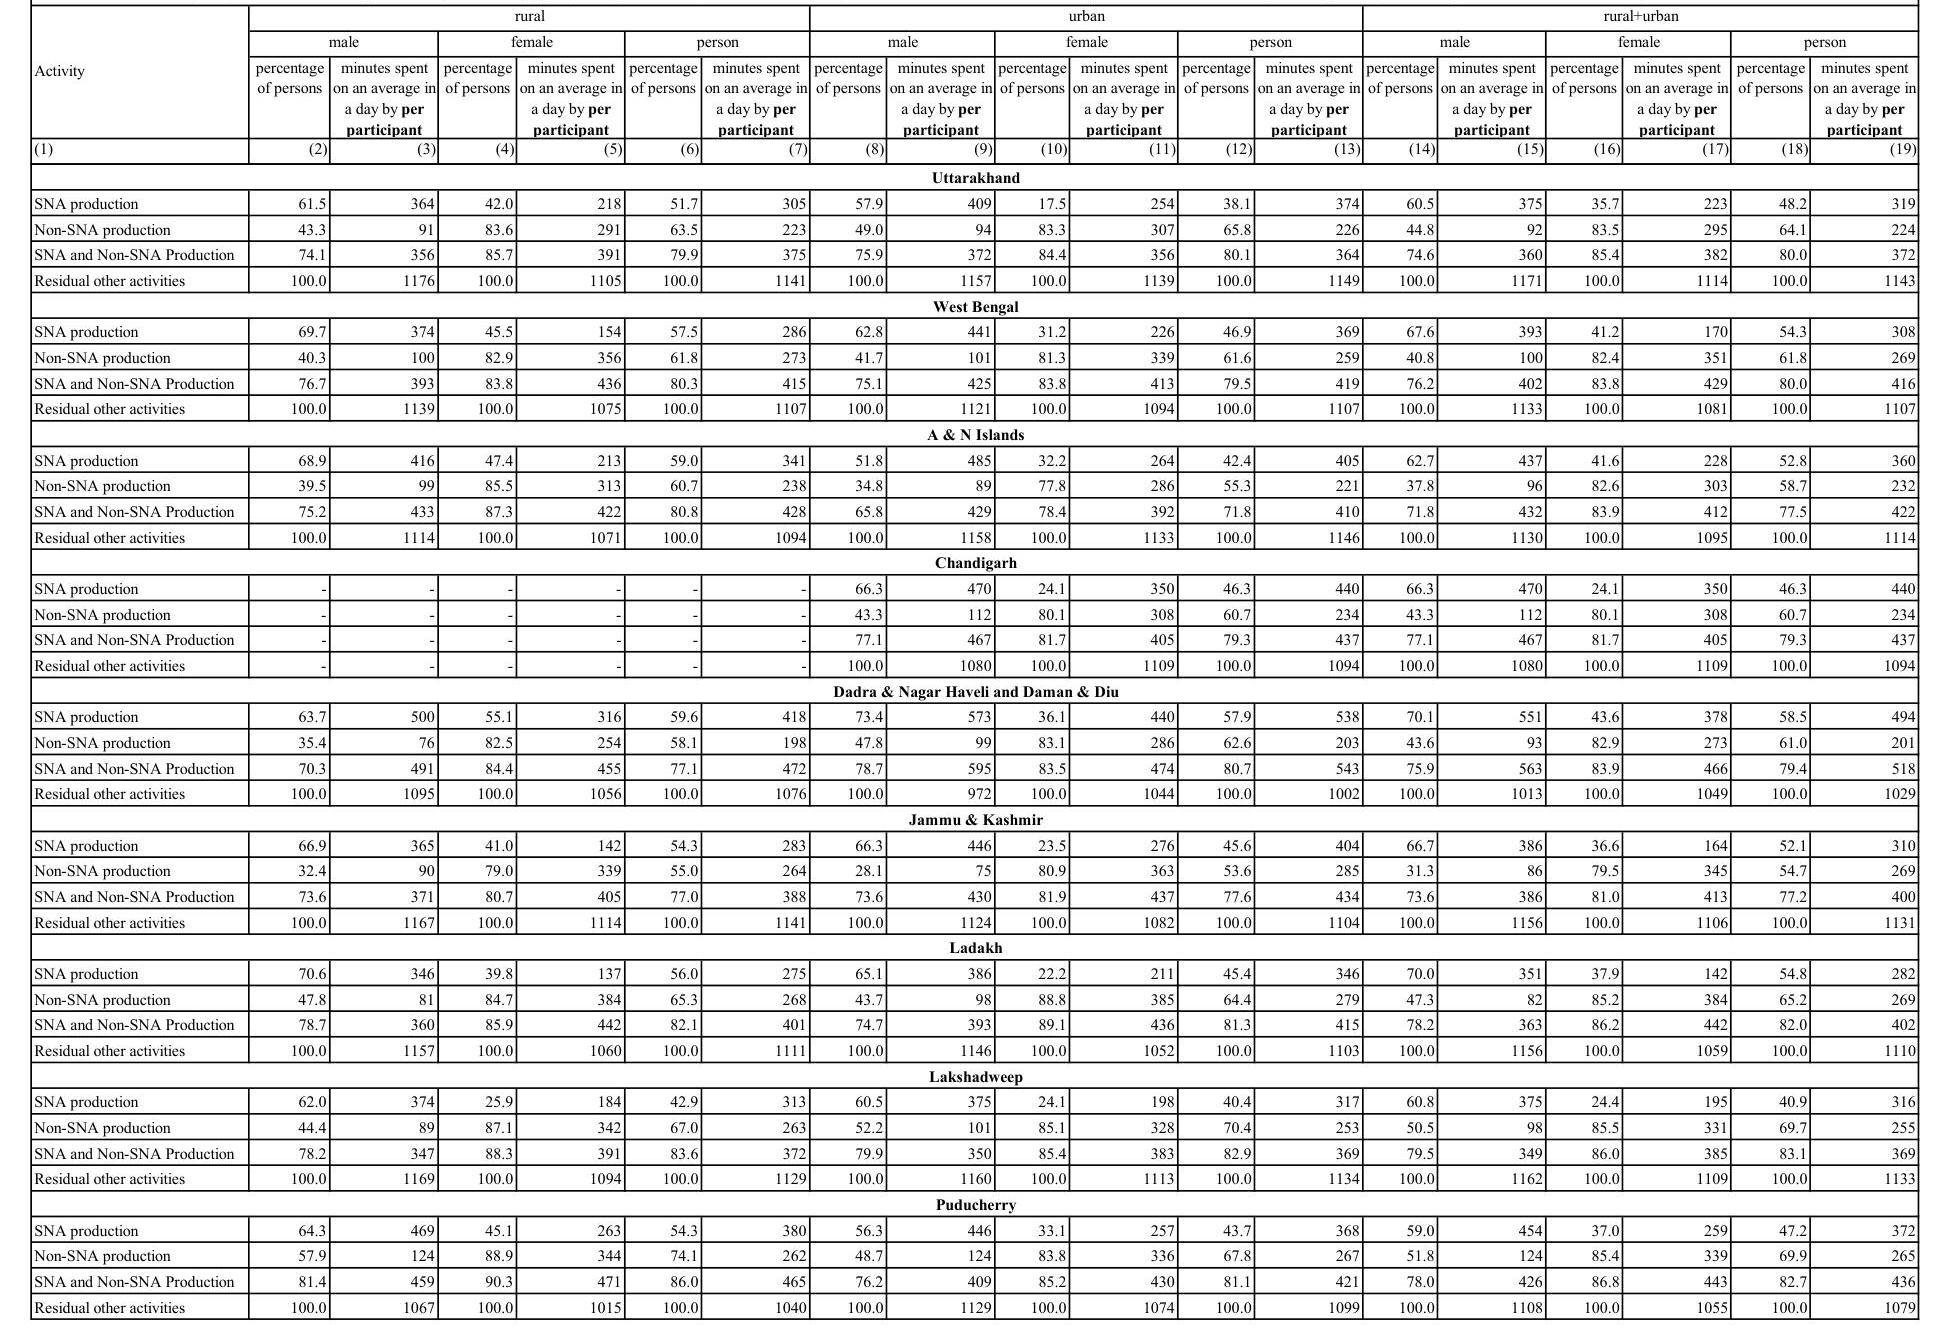
Statement 15.1: Percentage of persons and minutes spent in a day on an average per participant in SNA production/Non-SNA production/residual other activities irrespective of whether it is a major activity or not (considering all the activities in a time slot)
| Activity | rural | urban | rural+urban | |||||||||||||||
|---|---|---|---|---|---|---|---|---|---|---|---|---|---|---|---|---|---|---|
| male | female | person | male | female | person | male | female | person | ||||||||||
| percentage of persons |
minutes spent on an average in a day by per participant | percentage of persons |
minutes spent on an average in a day by per participant | percentage of persons |
minutes spent on an average in a day by per participant | percentage of persons |
minutes spent on an average in a day by per participant | percentage of persons |
minutes spent on an average in a day by per participant | percentage of persons |
minutes spent on an average in a day by per participant | percentage of persons |
minutes spent on an average in a day by per participant | percentage of persons |
minutes spent on an average in a day by per participant | percentage of persons |
minutes spent on an average in a day by per participant | |
| (1) | (2) | (3) | (4) | (5) | (6) | (7) | (8) | (9) | (10) | (11) | (12) | (13) | (14) | (15) | (16) | (17) | (18) | (19) |
| All India | ||||||||||||||||||
| SNA production | 66.9 | 392 | 42.1 | 216 | 54.4 | 324 | 62.7 | 452 | 25.6 | 266 | 44.7 | 401 | 65.5 | 410 | 37.1 | 226 | 51.4 | 344 |
| Non-SNA production | 39.0 | 97 | 83.7 | 341 | 61.4 | 264 | 41.0 | 94 | 82.7 | 356 | 61.2 | 253 | 39.6 | 96 | 83.4 | 340 | 61.4 | 261 |
| SNA and Non-SNA Production | 74.3 | 403 | 85.1 | 443 | 79.7 | 424 | 74.6 | 432 | 84.3 | 410 | 79.3 | 421 | 74.4 | 412 | 84.8 | 433 | 79.6 | 423 |
| Residual other activities | 100.0 | 1140 | 100.0 | 1063 | 100.0 | 1102 | 100.0 | 1118 | 100.0 | 1094 | 100.0 | 1106 | 100.0 | 1133 | 100.0 | 1073 | 100.0 | 1103 |
Statement 16.1: Percentage of persons and minutes spent in a day on an average per person/per participant of age 6 years and above in unpaid activities, paid activities and other activities where the activity was a major activity (considering only the major activity of the time slots)
| Andhra Pradesh | |||||||||
|---|---|---|---|---|---|---|---|---|---|
| Activity | male | female | person | ||||||
| percentage of persons | minutes spent on an average in a day per person | minutes spent on an average in a day per participant | percentage of persons | minutes spent on an average in a day per person | minutes spent on an average in a day per participant | percentage of persons | minutes spent on an average in a day per person | minutes spent on an average in a day per participant | |
| (1) | (2) | (3) | (4) | (5) | (6) | (7) | (8) | (9) | (10) |
| rural | |||||||||
| self maintenance etc | 100.0 | 1117 | 1117 | 100.0 | 1039 | 1039 | 100.0 | 1078 | 1078 |
| unpaid activities: SNA activities | 10.2 | 9 | 84 | 15.5 | 10 | 68 | 12.9 | 10 | 74 |
| unpaid activities:Non SNA activities | 26.8 | 25 | 94 | 86.2 | 262 | 304 | 56.8 | 145 | 255 |
| all unpaid activities | 33.3 | 34 | 102 | 86.6 | 272 | 314 | 60.3 | 154 | 256 |
| paid activities | 65.5 | 289 | 441 | 35.4 | 129 | 364 | 50.3 | 208 | 414 |
| all unapid/paid acivities | 73.8 | 323 | 437 | 87.9 | 401 | 456 | 81.0 | 362 | 448 |
| urban | |||||||||
| self maintenance etc | 100.0 | 1137 | 1137 | 100.0 | 1080 | 1080 | 100.0 | 1109 | 1109 |
| unpaid activities: SNA activities | 4.2 | 2 | 55 | 14.7 | 7 | 47 | 9.5 | 5 | 48 |
| unpaid activities:Non SNA activities | 32.4 | 33 | 102 | 82.1 | 278 | 338 | 57.3 | 155 | 271 |
| all unpaid activities | 34.6 | 35 | 102 | 82.3 | 284 | 346 | 58.5 | 160 | 274 |
| paid activities | 57.4 | 267 | 466 | 20.4 | 76 | 370 | 38.9 | 171 | 441 |
| all unapid/paid acivities | 69.1 | 303 | 438 | 83.5 | 360 | 431 | 76.3 | 331 | 434 |
| rural+urban | |||||||||
| self maintenance etc | 100.0 | 1124 | 1124 | 100.0 | 1052 | 1052 | 100.0 | 1088 | 1088 |
| unpaid activities: SNA activities | 8.2 | 6 | 79 | 15.2 | 9 | 61 | 11.7 | 8 | 67 |
| unpaid activities:Non SNA activities | 28.7 | 28 | 97 | 84.8 | 267 | 315 | 57.0 | 148 | 260 |
| all unpaid activities | 33.8 | 34 | 102 | 85.2 | 276 | 324 | 59.7 | 156 | 262 |
| paid activities | 62.8 | 282 | 449 | 30.5 | 112 | 366 | 46.5 | 196 | 421 |
| all unapid/paid acivities | 72.2 | 316 | 438 | 86.5 | 388 | 448 | 79.4 | 352 | 443 |
Note : The activities under ‘self development/ self care/ self maintenance, etc.’ are ‘residual other activities’
Statement 16.1: Percentage of persons and minutes spent in a day on an average per person/per participant of age 6 years and above in unpaid activities, paid activities and other activities where the activity was a major activity (considering only the major activity of the time slots)
| Arunachal Pradesh | |||||||||
|---|---|---|---|---|---|---|---|---|---|
| Activity | male | female | person | ||||||
| percentage of persons | minutes spent on an average in a day per person | minutes spent on an average in a day per participant | percentage of persons | minutes spent on an average in a day per person | minutes spent on an average in a day per participant | percentage of persons | minutes spent on an average in a day per person | minutes spent on an average in a day per participant | |
| $(1)$ | $(2)$ | $(3)$ | $(4)$ | $(5)$ | $(6)$ | $(7)$ | $(8)$ | $(9)$ | $(10)$ |
| rural | |||||||||
| self maintenance etc | 100.0 | 1088 | 1088 | 100.0 | 933 | 933 | 100.0 | 1013 | 1013 |
| unpaid activities: SNA activities | 28.2 | 40 | 141 | 54.7 | 91 | 166 | 41.1 | 65 | 157 |
| unpaid activities:Non SNA activities | 64.9 | 78 | 120 | 90.1 | 385 | 427 | 77.1 | 227 | 294 |
| all unpaid activities | 71.8 | 118 | 164 | 90.5 | 476 | 525 | 80.9 | 291 | 360 |
| paid activities | 69.0 | 235 | 340 | 11.5 | 31 | 272 | 41.1 | 136 | 331 |
| all unapid/paid acivities | 83.1 | 352 | 424 | 90.8 | 507 | 559 | 86.8 | 427 | 492 |
| urban | |||||||||
| self maintenance etc | 100.0 | 1117 | 1117 | 100.0 | 967 | 967 | 100.0 | 1047 | 1047 |
| unpaid activities: SNA activities | 5.7 | 7 | 118 | 21.2 | 24 | 112 | 12.9 | 15 | 113 |
| unpaid activities:Non SNA activities | 59.4 | 74 | 125 | 91.3 | 402 | 440 | 74.3 | 227 | 306 |
| all unpaid activities | 61.1 | 81 | 132 | 91.3 | 426 | 466 | 75.2 | 242 | 322 |
| paid activities | 63.0 | 242 | 384 | 14.1 | 47 | 336 | 40.1 | 151 | 376 |
| all unapid/paid acivities | 79.7 | 323 | 405 | 92.2 | 473 | 513 | 85.5 | 393 | 459 |
| rural+urban | |||||||||
| self maintenance etc | 100.0 | 1094 | 1094 | 100.0 | 940 | 940 | 100.0 | 1020 | 1020 |
| unpaid activities: SNA activities | 23.5 | 33 | 140 | 48.1 | 78 | 162 | 35.3 | 54 | 154 |
| unpaid activities:Non SNA activities | 63.7 | 77 | 121 | 90.3 | 388 | 430 | 76.5 | 227 | 296 |
| all unpaid activities | 69.6 | 110 | 158 | 90.7 | 466 | 514 | 79.7 | 281 | 353 |
| paid activities | 67.7 | 236 | 349 | 12.0 | 34 | 287 | 40.9 | 139 | 340 |
| all unapid/paid acivities | 82.4 | 346 | 420 | 91.0 | 500 | 549 | 86.5 | 420 | 486 |
Note : The activities under ‘self development/ self care/ self maintenance, etc.’ are ‘residual other activities’
Statement 16.1: Percentage of persons and minutes spent in a day on an average per person/per participant of age 6 years and above in unpaid activities, paid activities and other activities where the activity was a major activity (considering only the major activity of the time slots)
| Assam | |||||||||
|---|---|---|---|---|---|---|---|---|---|
| Activity | male | female | person | ||||||
| percentage of persons | minutes spent on an average in a day per person | minutes spent on an average in a day per participant | percentage of persons | minutes spent on an average in a day per person | minutes spent on an average in a day per participant | percentage of persons | minutes spent on an average in a day per person | minutes spent on an average in a day per participant | |
| (1) | (2) | (3) | (4) | (5) | (6) | (7) | (8) | (9) | (10) |
| rural | |||||||||
| self maintenance etc | 100.0 | 1124 | 1124 | 100.0 | 1064 | 1064 | 100.0 | 1094 | 1094 |
| unpaid activities: SNA activities | 16.2 | 14 | 88 | 26.0 | 22 | 85 | 21.0 | 18 | 86 |
| unpaid activities:Non SNA activities | 46.1 | 48 | 104 | 81.7 | 319 | 391 | 63.7 | 182 | 286 |
| all unpaid activities | 52.2 | 62 | 119 | 82.2 | 341 | 415 | 67.0 | 200 | 299 |
| paid activities | 63.8 | 254 | 398 | 12.5 | 35 | 282 | 38.4 | 146 | 380 |
| all unapid/paid acivities | 75.4 | 316 | 420 | 82.5 | 376 | 456 | 78.9 | 346 | 439 |
| urban | |||||||||
| self maintenance etc | 100.0 | 1120 | 1120 | 100.0 | 1083 | 1083 | 100.0 | 1103 | 1103 |
| unpaid activities: SNA activities | 4.4 | 3 | 72 | 8.3 | 6 | 78 | 6.2 | 5 | 76 |
| unpaid activities:Non SNA activities | 48.2 | 54 | 112 | 81.7 | 305 | 373 | 63.8 | 170 | 267 |
| all unpaid activities | 49.3 | 57 | 116 | 81.9 | 311 | 380 | 64.5 | 175 | 272 |
| paid activities | 59.5 | 263 | 442 | 13.1 | 46 | 349 | 37.9 | 162 | 427 |
| all unapid/paid acivities | 74.4 | 320 | 430 | 82.8 | 357 | 430 | 78.3 | 337 | 430 |
| rural+urban | |||||||||
| self maintenance etc | 100.0 | 1123 | 1123 | 100.0 | 1066 | 1066 | 100.0 | 1095 | 1095 |
| unpaid activities: SNA activities | 14.8 | 13 | 88 | 24.1 | 20 | 85 | 19.3 | 17 | 86 |
| unpaid activities:Non SNA activities | 46.3 | 49 | 105 | 81.7 | 318 | 389 | 63.7 | 181 | 284 |
| all unpaid activities | 51.8 | 61 | 119 | 82.2 | 338 | 411 | 66.7 | 197 | 296 |
| paid activities | 63.3 | 255 | 403 | 12.6 | 36 | 289 | 38.3 | 148 | 385 |
| all unapid/paid acivities | 75.2 | 317 | 421 | 82.5 | 374 | 454 | 78.8 | 345 | 438 |
Note : The activities under ‘self development/ self care/ self maintenance, etc.’ are ‘residual other activities’
Statement 16.1: Percentage of persons and minutes spent in a day on an average per person/per participant of age 6 years and above in unpaid activities, paid activities and other activities where the activity was a major activity (considering only the major activity of the time slots)
| Bihar | |||||||||
|---|---|---|---|---|---|---|---|---|---|
| Activity | male | female | person | ||||||
| percentage of persons | minutes spent on an average in a day per person | minutes spent on an average in a day per participant | percentage of persons | minutes spent on an average in a day per person | minutes spent on an average in a day per participant | percentage of persons | minutes spent on an average in a day per person | minutes spent on an average in a day per participant | |
| (1) | (2) | (3) | (4) | (5) | (6) | (7) | (8) | (9) | (10) |
| rural | |||||||||
| self maintenance etc | 100.0 | 1162 | 1162 | 100.0 | 1084 | 1084 | 100.0 | 1123 | 1123 |
| unpaid activities: SNA activities | 14.2 | 22 | 158 | 14.8 | 18 | 124 | 14.5 | 20 | 141 |
| unpaid activities:Non SNA activities | 37.8 | 41 | 110 | 79.0 | 313 | 396 | 58.3 | 177 | 303 |
| all unpaid activities | 44.8 | 64 | 142 | 79.4 | 331 | 417 | 62.1 | 197 | 318 |
| paid activities | 54.3 | 214 | 395 | 10.8 | 25 | 233 | 32.6 | 120 | 368 |
| all unapid/paid acivities | 66.7 | 278 | 417 | 79.7 | 356 | 447 | 73.2 | 317 | 433 |
| urban | |||||||||
| self maintenance etc | 100.0 | 1140 | 1140 | 100.0 | 1095 | 1095 | 100.0 | 1119 | 1119 |
| unpaid activities: SNA activities | 2.6 | 4 | 162 | 3.9 | 4 | 97 | 3.2 | 4 | 125 |
| unpaid activities:Non SNA activities | 38.7 | 45 | 116 | 79.3 | 314 | 396 | 58.0 | 173 | 298 |
| all unpaid activities | 40.1 | 49 | 122 | 79.4 | 318 | 401 | 58.8 | 177 | 301 |
| paid activities | 54.3 | 251 | 462 | 8.5 | 27 | 316 | 32.5 | 144 | 444 |
| all unapid/paid acivities | 69.1 | 300 | 434 | 80.2 | 345 | 430 | 74.4 | 321 | 432 |
| rural+urban | |||||||||
| self maintenance etc | 100.0 | 1159 | 1159 | 100.0 | 1085 | 1085 | 100.0 | 1123 | 1123 |
| unpaid activities: SNA activities | 12.8 | 20 | 158 | 13.6 | 17 | 123 | 13.2 | 19 | 140 |
| unpaid activities:Non SNA activities | 37.9 | 42 | 110 | 79.0 | 313 | 396 | 58.3 | 176 | 302 |
| all unpaid activities | 44.3 | 62 | 140 | 79.4 | 330 | 415 | 61.7 | 195 | 316 |
| paid activities | 54.3 | 219 | 403 | 10.6 | 25 | 240 | 32.6 | 123 | 376 |
| all unapid/paid acivities | 66.9 | 281 | 419 | 79.7 | 355 | 445 | 73.3 | 317 | 433 |
Note : The activities under ‘self development/ self care/ self maintenance, etc.’ are ‘residual other activities’
Statement 16.1: Percentage of persons and minutes spent in a day on an average per person/per participant of age 6 years and above in unpaid activities, paid activities and other activities where the activity was a major activity (considering only the major activity of the time slots)
| Chhattisgarh | |||||||||
|---|---|---|---|---|---|---|---|---|---|
| Activity | male | female | person | ||||||
| percentage of persons | minutes spent on an average in a day per person | minutes spent on an average in a day per participant | percentage of persons | minutes spent on an average in a day per person | minutes spent on an average in a day per participant | percentage of persons | minutes spent on an average in a day per person | minutes spent on an average in a day per participant | |
| (1) | (2) | (3) | (4) | (5) | (6) | (7) | (8) | (9) | (10) |
| rural | |||||||||
| self maintenance etc | 100.0 | 1123 | 1123 | 100.0 | 1056 | 1056 | 100.0 | 1089 | 1089 |
| unpaid activities: SNA activities | 20.4 | 52 | 253 | 28.2 | 34 | 122 | 24.3 | 43 | 177 |
| unpaid activities:Non SNA activities | 34.1 | 40 | 116 | 81.7 | 249 | 305 | 58.1 | 145 | 250 |
| all unpaid activities | 45.2 | 91 | 202 | 82.8 | 284 | 342 | 64.1 | 188 | 293 |
| paid activities | 55.9 | 226 | 404 | 30.6 | 100 | 327 | 43.2 | 163 | 377 |
| all unapid/paid acivities | 75.0 | 317 | 423 | 84.0 | 384 | 457 | 79.6 | 351 | 441 |
| urban | |||||||||
| self maintenance etc | 100.0 | 1114 | 1114 | 100.0 | 1108 | 1108 | 100.0 | 1111 | 1111 |
| unpaid activities: SNA activities | 3.3 | 3 | 100 | 12.1 | 7 | 58 | 7.8 | 5 | 67 |
| unpaid activities:Non SNA activities | 32.7 | 37 | 114 | 76.4 | 244 | 320 | 54.6 | 141 | 259 |
| all unpaid activities | 34.0 | 41 | 119 | 76.8 | 251 | 327 | 55.5 | 146 | 264 |
| paid activities | 59.5 | 286 | 480 | 22.9 | 81 | 353 | 41.2 | 183 | 444 |
| all unapid/paid acivities | 70.9 | 326 | 460 | 79.0 | 332 | 421 | 74.9 | 329 | 440 |
| rural+urban | |||||||||
| self maintenance etc | 100.0 | 1121 | 1121 | 100.0 | 1068 | 1068 | 100.0 | 1094 | 1094 |
| unpaid activities: SNA activities | 16.6 | 41 | 246 | 24.6 | 28 | 115 | 20.6 | 34 | 167 |
| unpaid activities:Non SNA activities | 33.8 | 39 | 116 | 80.6 | 248 | 308 | 57.3 | 144 | 252 |
| all unpaid activities | 42.7 | 80 | 187 | 81.5 | 276 | 339 | 62.2 | 179 | 287 |
| paid activities | 56.7 | 240 | 422 | 28.9 | 96 | 331 | 42.7 | 167 | 391 |
| all unapid/paid acivities | 74.1 | 319 | 431 | 82.9 | 372 | 449 | 78.5 | 346 | 441 |
Note : The activities under ‘self development/ self care/ self maintenance, etc.’ are ‘residual other activities’
Statement 16.1: Percentage of persons and minutes spent in a day on an average per person/per participant of age 6 years and above in unpaid activities, paid activities and other activities where the activity was a major activity (considering only the major activity of the time slots)
| Delhi | |||||||||
|---|---|---|---|---|---|---|---|---|---|
| Activity | male | female | person | ||||||
| percentage of persons | minutes spent on an average in a day per person | minutes spent on an average in a day per participant | percentage of persons | minutes spent on an average in a day per person | minutes spent on an average in a day per participant | percentage of persons | minutes spent on an average in a day per person | minutes spent on an average in a day per participant | |
| (1) | (2) | (3) | (4) | (5) | (6) | (7) | (8) | (9) | (10) |
| rural | |||||||||
| self maintenance etc | 100.0 | 949 | 949 | 100.0 | 988 | 988 | 100.0 | 965 | 965 |
| unpaid activities: SNA activities | 0.0 | 0 | 0 | 0.0 | 0 | 0 | 0.0 | 0 | 0 |
| unpaid activities:Non SNA activities | 58.2 | 83 | 143 | 86.2 | 383 | 445 | 69.6 | 205 | 295 |
| all unpaid activities | 58.2 | 83 | 143 | 86.2 | 383 | 445 | 69.6 | 205 | 295 |
| paid activities | 78.7 | 407 | 517 | 14.8 | 69 | 469 | 52.7 | 270 | 512 |
| all unapid/paid acivities | 82.7 | 491 | 593 | 86.2 | 452 | 525 | 84.2 | 475 | 565 |
| urban | |||||||||
| self maintenance etc | 100.0 | 1036 | 1036 | 100.0 | 1072 | 1072 | 100.0 | 1051 | 1051 |
| unpaid activities: SNA activities | 0.2 | 0 | 236 | 0.3 | 0 | 137 | 0.3 | 0 | 176 |
| unpaid activities:Non SNA activities | 43.0 | 48 | 111 | 80.5 | 321 | 399 | 59.5 | 168 | 282 |
| all unpaid activities | 43.1 | 48 | 111 | 80.5 | 322 | 400 | 59.5 | 168 | 283 |
| paid activities | 69.4 | 356 | 513 | 11.2 | 46 | 412 | 43.9 | 220 | 502 |
| all unapid/paid acivities | 77.1 | 404 | 525 | 81.5 | 368 | 452 | 79.0 | 389 | 492 |
| rural+urban | |||||||||
| self maintenance etc | 100.0 | 1031 | 1031 | 100.0 | 1068 | 1068 | 100.0 | 1047 | 1047 |
| unpaid activities: SNA activities | 0.2 | 0 | 236 | 0.3 | 0 | 137 | 0.2 | 0 | 176 |
| unpaid activities:Non SNA activities | 43.8 | 50 | 113 | 80.8 | 324 | 402 | 60.0 | 170 | 283 |
| all unpaid activities | 43.9 | 50 | 114 | 80.8 | 325 | 402 | 60.0 | 170 | 284 |
| paid activities | 69.9 | 359 | 513 | 11.4 | 47 | 415 | 44.3 | 223 | 502 |
| all unapid/paid acivities | 77.4 | 409 | 529 | 81.8 | 372 | 455 | 79.3 | 393 | 496 |
Note : The activities under ‘self development/ self care/ self maintenance, etc.’ are ‘residual other activities’
Statement 16.1: Percentage of persons and minutes spent in a day on an average per person/per participant of age 6 years and above in unpaid activities, paid activities and other activities where the activity was a major activity (considering only the major activity of the time slots)
| Goa | |||||||||
|---|---|---|---|---|---|---|---|---|---|
| Activity | male | female | person | ||||||
| percentage of persons | minutes spent on an average in a day per person | minutes spent on an average in a day per participant | percentage of persons | minutes spent on an average in a day per person | minutes spent on an average in a day per participant | percentage of persons | minutes spent on an average in a day per person | minutes spent on an average in a day per participant | |
| (1) | (2) | (3) | (4) | (5) | (6) | (7) | (8) | (9) | (10) |
| rural | |||||||||
| self maintenance etc | 100.0 | 1109 | 1109 | 100.0 | 1098 | 1098 | 100.0 | 1103 | 1103 |
| unpaid activities: SNA activities | 7.0 | 14 | 196 | 9.6 | 15 | 153 | 8.3 | 14 | 170 |
| unpaid activities:Non SNA activities | 33.5 | 37 | 112 | 76.5 | 240 | 314 | 55.5 | 142 | 255 |
| all unpaid activities | 37.4 | 51 | 137 | 77.6 | 255 | 328 | 58.0 | 156 | 268 |
| paid activities | 58.7 | 280 | 477 | 19.7 | 87 | 442 | 38.7 | 181 | 468 |
| all unapid/paid acivities | 80.5 | 331 | 412 | 86.9 | 342 | 394 | 83.8 | 337 | 402 |
| urban | |||||||||
| self maintenance etc | 100.0 | 1079 | 1079 | 100.0 | 1101 | 1101 | 100.0 | 1090 | 1090 |
| unpaid activities: SNA activities | 4.3 | 5 | 123 | 3.0 | 2 | 68 | 3.7 | 4 | 101 |
| unpaid activities:Non SNA activities | 36.5 | 32 | 86 | 66.1 | 214 | 323 | 51.0 | 121 | 237 |
| all unpaid activities | 37.7 | 37 | 98 | 66.1 | 216 | 326 | 51.6 | 125 | 241 |
| paid activities | 66.6 | 324 | 486 | 27.4 | 123 | 450 | 47.4 | 226 | 476 |
| all unapid/paid acivities | 78.1 | 361 | 462 | 81.9 | 339 | 414 | 80.0 | 350 | 438 |
| rural+urban | |||||||||
| self maintenance etc | 100.0 | 1090 | 1090 | 100.0 | 1100 | 1100 | 100.0 | 1095 | 1095 |
| unpaid activities: SNA activities | 5.3 | 8 | 159 | 5.7 | 7 | 126 | 5.5 | 8 | 142 |
| unpaid activities:Non SNA activities | 35.3 | 34 | 95 | 70.3 | 224 | 319 | 52.8 | 129 | 244 |
| all unpaid activities | 37.6 | 42 | 112 | 70.7 | 232 | 327 | 54.1 | 137 | 253 |
| paid activities | 63.6 | 307 | 483 | 24.3 | 109 | 447 | 44.0 | 208 | 473 |
| all unapid/paid acivities | 79.0 | 350 | 443 | 83.9 | 340 | 406 | 81.5 | 345 | 424 |
Note : The activities under ‘self development/ self care/ self maintenance, etc.’ are ‘residual other activities’
Statement 16.1: Percentage of persons and minutes spent in a day on an average per person/per participant of age 6 years and above in unpaid activities, paid activities and other activities where the activity was a major activity (considering only the major activity of the time slots)
| Gujarat | |||||||||
|---|---|---|---|---|---|---|---|---|---|
| Activity | male | female | person | ||||||
| percentage of persons | minutes spent on an average in a day per person | minutes spent on an average in a day per participant | percentage of persons | minutes spent on an average in a day per person | minutes spent on an average in a day per participant | percentage of persons | minutes spent on an average in a day per person | minutes spent on an average in a day per participant | |
| (1) | (2) | (3) | (4) | (5) | (6) | (7) | (8) | (9) | (10) |
| rural | |||||||||
| self maintenance etc | 100.0 | 1127 | 1127 | 100.0 | 1035 | 1035 | 100.0 | 1082 | 1082 |
| unpaid activities: SNA activities | 7.0 | 11 | 158 | 21.3 | 18 | 86 | 14.0 | 15 | 104 |
| unpaid activities:Non SNA activities | 23.8 | 22 | 94 | 85.2 | 293 | 344 | 54.0 | 156 | 288 |
| all unpaid activities | 28.6 | 34 | 117 | 85.4 | 312 | 365 | 56.5 | 170 | 301 |
| paid activities | 69.0 | 279 | 405 | 32.3 | 93 | 288 | 51.0 | 188 | 369 |
| all unapid/paid acivities | 76.1 | 313 | 412 | 87.2 | 405 | 464 | 81.5 | 358 | 439 |
| urban | |||||||||
| self maintenance etc | 100.0 | 1088 | 1088 | 100.0 | 1062 | 1062 | 100.0 | 1075 | 1075 |
| unpaid activities: SNA activities | 1.1 | 1 | 82 | 7.9 | 4 | 46 | 4.3 | 2 | 51 |
| unpaid activities:Non SNA activities | 30.7 | 31 | 102 | 84.4 | 306 | 362 | 56.0 | 161 | 287 |
| all unpaid activities | 31.1 | 32 | 104 | 84.5 | 310 | 366 | 56.2 | 163 | 289 |
| paid activities | 64.3 | 320 | 498 | 19.4 | 69 | 356 | 43.1 | 202 | 468 |
| all unapid/paid acivities | 72.9 | 352 | 483 | 86.0 | 378 | 440 | 79.1 | 365 | 461 |
| rural+urban | |||||||||
| self maintenance etc | 100.0 | 1109 | 1109 | 100.0 | 1047 | 1047 | 100.0 | 1079 | 1079 |
| unpaid activities: SNA activities | 4.4 | 7 | 149 | 15.5 | 12 | 77 | 9.8 | 9 | 94 |
| unpaid activities:Non SNA activities | 26.9 | 26 | 98 | 84.9 | 299 | 352 | 54.9 | 158 | 288 |
| all unpaid activities | 29.7 | 33 | 111 | 85.0 | 311 | 365 | 56.4 | 167 | 296 |
| paid activities | 66.9 | 298 | 445 | 26.7 | 83 | 309 | 47.5 | 194 | 408 |
| all unapid/paid acivities | 74.6 | 331 | 443 | 86.7 | 393 | 454 | 80.4 | 361 | 449 |
Note : The activities under ‘self development/ self care/ self maintenance, etc.’ are ‘residual other activities’
Statement 16.1: Percentage of persons and minutes spent in a day on an average per person/per participant of age 6 years and above in unpaid activities, paid activities and other activities where the activity was a major activity (considering only the major activity of the time slots)
| Haryana | |||||||||
|---|---|---|---|---|---|---|---|---|---|
| Activity | male | female | person | ||||||
| percentage of persons | minutes spent on an average in a day per person | minutes spent on an average in a day per participant | percentage of persons | minutes spent on an average in a day per person | minutes spent on an average in a day per participant | percentage of persons | minutes spent on an average in a day per person | minutes spent on an average in a day per participant | |
| (1) | (2) | (3) | (4) | (5) | (6) | (7) | (8) | (9) | (10) |
| rural | |||||||||
| self maintenance etc | 100.0 | 1145 | 1145 | 100.0 | 1066 | 1066 | 100.0 | 1106 | 1106 |
| unpaid activities: SNA activities | 18.9 | 27 | 143 | 24.6 | 39 | 158 | 21.7 | 33 | 151 |
| unpaid activities:Non SNA activities | 24.6 | 25 | 101 | 80.4 | 295 | 366 | 51.7 | 156 | 302 |
| all unpaid activities | 38.1 | 52 | 137 | 81.4 | 333 | 410 | 59.1 | 189 | 319 |
| paid activities | 57.0 | 243 | 426 | 14.1 | 41 | 287 | 36.2 | 145 | 400 |
| all unapid/paid acivities | 69.2 | 295 | 427 | 82.2 | 374 | 455 | 75.5 | 334 | 442 |
| urban | |||||||||
| self maintenance etc | 100.0 | 1086 | 1086 | 100.0 | 1085 | 1085 | 100.0 | 1086 | 1086 |
| unpaid activities: SNA activities | 3.0 | 3 | 109 | 3.2 | 4 | 126 | 3.1 | 4 | 117 |
| unpaid activities:Non SNA activities | 41.3 | 40 | 96 | 80.3 | 300 | 374 | 59.1 | 159 | 269 |
| all unpaid activities | 42.7 | 43 | 101 | 80.5 | 304 | 378 | 59.9 | 162 | 271 |
| paid activities | 63.7 | 311 | 488 | 13.6 | 51 | 374 | 40.8 | 192 | 470 |
| all unapid/paid acivities | 74.6 | 354 | 474 | 81.3 | 355 | 437 | 77.6 | 354 | 457 |
| rural+urban | |||||||||
| self maintenance etc | 100.0 | 1117 | 1117 | 100.0 | 1074 | 1074 | 100.0 | 1097 | 1097 |
| unpaid activities: SNA activities | 11.4 | 16 | 139 | 15.1 | 23 | 155 | 13.2 | 19 | 148 |
| unpaid activities:Non SNA activities | 32.5 | 32 | 98 | 80.4 | 297 | 370 | 55.1 | 157 | 285 |
| all unpaid activities | 40.2 | 48 | 119 | 81.0 | 321 | 396 | 59.5 | 177 | 297 |
| paid activities | 60.2 | 275 | 457 | 13.9 | 45 | 325 | 38.3 | 166 | 434 |
| all unapid/paid acivities | 71.7 | 323 | 450 | 81.8 | 366 | 447 | 76.5 | 343 | 449 |
Note : The activities under ‘self development/ self care/ self maintenance, etc.’ are ‘residual other activities’
Statement 16.1: Percentage of persons and minutes spent in a day on an average per person/per participant of age 6 years and above in unpaid activities, paid activities and other activities where the activity was a major activity (considering only the major activity of the time slots)
| Himachal Pradesh | |||||||||
|---|---|---|---|---|---|---|---|---|---|
| Activity | male | female | person | ||||||
| percentage of persons | minutes spent on an average in a day per person | minutes spent on an average in a day per participant | percentage of persons | minutes spent on an average in a day per person | minutes spent on an average in a day per participant | percentage of persons | minutes spent on an average in a day per person | minutes spent on an average in a day per participant | |
| (1) | (2) | (3) | (4) | (5) | (6) | (7) | (8) | (9) | (10) |
| rural | |||||||||
| self maintenance etc | 100.0 | 1127 | 1127 | 100.0 | 1034 | 1034 | 100.0 | 1078 | 1078 |
| unpaid activities: SNA activities | 30.9 | 46 | 148 | 49.7 | 76 | 153 | 40.7 | 62 | 151 |
| unpaid activities:Non SNA activities | 33.4 | 35 | 104 | 85.3 | 289 | 339 | 60.5 | 168 | 277 |
| all unpaid activities | 50.9 | 81 | 158 | 86.1 | 366 | 425 | 69.3 | 229 | 331 |
| paid activities | 53.5 | 233 | 435 | 16.3 | 41 | 249 | 34.1 | 133 | 388 |
| all unapid/paid acivities | 76.2 | 313 | 411 | 86.6 | 406 | 469 | 81.6 | 362 | 443 |
| urban | |||||||||
| self maintenance etc | 100.0 | 1068 | 1068 | 100.0 | 1085 | 1085 | 100.0 | 1076 | 1076 |
| unpaid activities: SNA activities | 3.5 | 5 | 149 | 5.1 | 7 | 132 | 4.3 | 6 | 139 |
| unpaid activities:Non SNA activities | 47.1 | 52 | 110 | 79.8 | 257 | 322 | 62.9 | 151 | 240 |
| all unpaid activities | 49.0 | 57 | 116 | 79.8 | 264 | 331 | 63.9 | 157 | 246 |
| paid activities | 65.2 | 315 | 484 | 22.9 | 91 | 398 | 44.7 | 207 | 463 |
| all unapid/paid acivities | 76.1 | 372 | 490 | 83.4 | 355 | 425 | 79.6 | 364 | 457 |
| rural+urban | |||||||||
| self maintenance etc | 100.0 | 1119 | 1119 | 100.0 | 1040 | 1040 | 100.0 | 1078 | 1078 |
| unpaid activities: SNA activities | 27.3 | 40 | 148 | 44.6 | 68 | 153 | 36.3 | 55 | 151 |
| unpaid activities:Non SNA activities | 35.2 | 37 | 105 | 84.7 | 286 | 337 | 60.8 | 166 | 273 |
| all unpaid activities | 50.7 | 77 | 153 | 85.4 | 354 | 415 | 68.6 | 220 | 321 |
| paid activities | 55.1 | 244 | 442 | 17.1 | 46 | 271 | 35.4 | 142 | 400 |
| all unapid/paid acivities | 76.2 | 321 | 421 | 86.2 | 400 | 464 | 81.4 | 362 | 445 |
Note : The activities under ‘self development/ self care/ self maintenance, etc.’ are ‘residual other activities’
Statement 16.1: Percentage of persons and minutes spent in a day on an average per person/per participant of age 6 years and above in unpaid activities, paid activities and other activities where the activity was a major activity (considering only the major activity of the time slots)
| Jharkhand | |||||||||
|---|---|---|---|---|---|---|---|---|---|
| Activity | male | female | person | ||||||
| percentage of persons | minutes spent on an average in a day per person | minutes spent on an average in a day per participant | percentage of persons | minutes spent on an average in a day per person | minutes spent on an average in a day per participant | percentage of persons | minutes spent on an average in a day per person | minutes spent on an average in a day per participant | |
| (1) | (2) | (3) | (4) | (5) | (6) | (7) | (8) | (9) | (10) |
| rural | |||||||||
| self maintenance etc | 100.0 | 1121 | 1121 | 100.0 | 1016 | 1016 | 100.0 | 1068 | 1068 |
| unpaid activities: SNA activities | 25.0 | 41 | 166 | 39.7 | 56 | 142 | 32.4 | 49 | 151 |
| unpaid activities:Non SNA activities | 40.0 | 44 | 110 | 83.4 | 320 | 384 | 61.8 | 183 | 296 |
| all unpaid activities | 52.4 | 86 | 163 | 84.5 | 376 | 446 | 68.5 | 232 | 338 |
| paid activities | 56.4 | 233 | 414 | 19.3 | 48 | 246 | 37.8 | 140 | 371 |
| all unapid/paid acivities | 71.9 | 319 | 443 | 84.8 | 424 | 500 | 78.4 | 372 | 474 |
| urban | |||||||||
| self maintenance etc | 100.0 | 1121 | 1121 | 100.0 | 1064 | 1064 | 100.0 | 1093 | 1093 |
| unpaid activities: SNA activities | 6.0 | 6 | 102 | 9.3 | 9 | 97 | 7.6 | 8 | 99 |
| unpaid activities:Non SNA activities | 39.7 | 45 | 113 | 81.7 | 318 | 390 | 60.2 | 178 | 296 |
| all unpaid activities | 43.1 | 51 | 118 | 81.8 | 327 | 400 | 62.0 | 186 | 300 |
| paid activities | 56.5 | 268 | 475 | 14.9 | 49 | 331 | 36.2 | 161 | 446 |
| all unapid/paid acivities | 69.7 | 319 | 459 | 83.0 | 376 | 454 | 76.2 | 347 | 456 |
| rural+urban | |||||||||
| self maintenance etc | 100.0 | 1121 | 1121 | 100.0 | 1025 | 1025 | 100.0 | 1073 | 1073 |
| unpaid activities: SNA activities | 21.2 | 34 | 162 | 33.9 | 47 | 140 | 27.6 | 41 | 148 |
| unpaid activities:Non SNA activities | 40.0 | 44 | 111 | 83.1 | 320 | 385 | 61.5 | 182 | 296 |
| all unpaid activities | 50.6 | 79 | 156 | 84.0 | 367 | 437 | 67.3 | 223 | 331 |
| paid activities | 56.4 | 240 | 426 | 18.5 | 48 | 259 | 37.5 | 144 | 385 |
| all unapid/paid acivities | 71.5 | 319 | 446 | 84.5 | 415 | 491 | 78.0 | 367 | 471 |
Note : The activities under ‘self development/ self care/ self maintenance, etc.’ are ‘residual other activities’
Statement 16.1: Percentage of persons and minutes spent in a day on an average per person/per participant of age 6 years and above in unpaid activities, paid activities and other activities where the activity was a major activity (considering only the major activity of the time slots)
| Karnataka | |||||||||
|---|---|---|---|---|---|---|---|---|---|
| Activity | male | female | person | ||||||
| percentage of persons | minutes spent on an average in a day per person | minutes spent on an average in a day per participant | percentage of persons | minutes spent on an average in a day per person | minutes spent on an average in a day per participant | percentage of persons | minutes spent on an average in a day per person | minutes spent on an average in a day per participant | |
| (1) | (2) | (3) | (4) | (5) | (6) | (7) | (8) | (9) | (10) |
| rural | |||||||||
| self maintenance etc | 100.0 | 1108 | 1108 | 100.0 | 1039 | 1039 | 100.0 | 1074 | 1074 |
| unpaid activities: SNA activities | 15.2 | 13 | 84 | 13.2 | 9 | 67 | 14.2 | 11 | 76 |
| unpaid activities:Non SNA activities | 37.2 | 33 | 89 | 85.4 | 299 | 351 | 61.4 | 167 | 272 |
| all unpaid activities | 45.1 | 46 | 102 | 85.7 | 308 | 360 | 65.5 | 178 | 271 |
| paid activities | 69.6 | 286 | 411 | 28.2 | 93 | 328 | 48.8 | 189 | 387 |
| all unapid/paid acivities | 78.4 | 332 | 423 | 86.9 | 401 | 461 | 82.6 | 366 | 443 |
| urban | |||||||||
| self maintenance etc | 100.0 | 1099 | 1099 | 100.0 | 1067 | 1067 | 100.0 | 1084 | 1084 |
| unpaid activities: SNA activities | 2.9 | 2 | 58 | 5.4 | 3 | 63 | 4.1 | 2 | 61 |
| unpaid activities:Non SNA activities | 38.3 | 38 | 100 | 81.1 | 290 | 357 | 58.6 | 158 | 269 |
| all unpaid activities | 39.5 | 40 | 101 | 81.2 | 293 | 361 | 59.3 | 160 | 270 |
| paid activities | 63.2 | 301 | 476 | 21.5 | 79 | 369 | 43.5 | 196 | 451 |
| all unapid/paid acivities | 75.9 | 341 | 449 | 84.1 | 373 | 443 | 79.8 | 356 | 446 |
| rural+urban | |||||||||
| self maintenance etc | 100.0 | 1104 | 1104 | 100.0 | 1050 | 1050 | 100.0 | 1078 | 1078 |
| unpaid activities: SNA activities | 10.1 | 8 | 81 | 10.2 | 7 | 66 | 10.2 | 7 | 74 |
| unpaid activities:Non SNA activities | 37.6 | 35 | 94 | 83.7 | 296 | 353 | 60.2 | 163 | 271 |
| all unpaid activities | 42.8 | 43 | 101 | 84.0 | 303 | 360 | 63.0 | 171 | 271 |
| paid activities | 67.0 | 292 | 436 | 25.6 | 87 | 342 | 46.7 | 192 | 411 |
| all unapid/paid acivities | 77.3 | 336 | 434 | 85.8 | 390 | 455 | 81.5 | 362 | 445 |
Note : The activities under ‘self development/ self care/ self maintenance, etc.’ are ‘residual other activities’
Statement 16.1: Percentage of persons and minutes spent in a day on an average per person/per participant of age 6 years and above in unpaid activities, paid activities and other activities where the activity was a major activity (considering only the major activity of the time slots)
| Kerala | |||||||||
|---|---|---|---|---|---|---|---|---|---|
| Activity | male | female | person | ||||||
| percentage of persons | minutes spent on an average in a day per person | minutes spent on an average in a day per participant | percentage of persons | minutes spent on an average in a day per person | minutes spent on an average in a day per participant | percentage of persons | minutes spent on an average in a day per person | minutes spent on an average in a day per participant | |
| (1) | (2) | (3) | (4) | (5) | (6) | (7) | (8) | (9) | (10) |
| rural | |||||||||
| self maintenance etc | 100.0 | 1166 | 1166 | 100.0 | 1075 | 1075 | 100.0 | 1117 | 1117 |
| unpaid activities: SNA activities | 9.2 | 10 | 111 | 11.7 | 9 | 77 | 10.5 | 10 | 91 |
| unpaid activities:Non SNA activities | 48.7 | 54 | 111 | 85.1 | 287 | 337 | 68.1 | 178 | 261 |
| all unpaid activities | 51.9 | 64 | 124 | 85.2 | 296 | 347 | 69.6 | 187 | 269 |
| paid activities | 49.1 | 210 | 427 | 20.0 | 70 | 348 | 33.7 | 135 | 402 |
| all unapid/paid acivities | 74.7 | 274 | 367 | 86.0 | 365 | 425 | 80.7 | 323 | 400 |
| urban | |||||||||
| self maintenance etc | 100.0 | 1159 | 1159 | 100.0 | 1091 | 1091 | 100.0 | 1122 | 1122 |
| unpaid activities: SNA activities | 6.8 | 8 | 115 | 7.7 | 6 | 74 | 7.3 | 7 | 92 |
| unpaid activities:Non SNA activities | 49.2 | 54 | 110 | 83.1 | 272 | 328 | 67.2 | 170 | 253 |
| all unpaid activities | 50.9 | 62 | 122 | 83.2 | 278 | 334 | 68.1 | 177 | 260 |
| paid activities | 49.6 | 219 | 442 | 19.8 | 71 | 361 | 33.7 | 140 | 417 |
| all unapid/paid acivities | 73.8 | 281 | 381 | 84.0 | 349 | 416 | 79.2 | 318 | 401 |
| rural+urban | |||||||||
| self maintenance etc | 100.0 | 1163 | 1163 | 100.0 | 1082 | 1082 | 100.0 | 1120 | 1120 |
| unpaid activities: SNA activities | 8.0 | 9 | 113 | 9.8 | 7 | 76 | 9.0 | 8 | 92 |
| unpaid activities:Non SNA activities | 48.9 | 54 | 111 | 84.1 | 280 | 332 | 67.7 | 174 | 257 |
| all unpaid activities | 51.4 | 63 | 123 | 84.2 | 287 | 341 | 68.9 | 182 | 265 |
| paid activities | 49.3 | 214 | 434 | 19.9 | 71 | 354 | 33.7 | 138 | 409 |
| all unapid/paid acivities | 74.3 | 277 | 374 | 85.1 | 358 | 421 | 80.0 | 320 | 400 |
Note : The activities under ‘self development/ self care/ self maintenance, etc.’ are ‘residual other activities’
Statement 16.1: Percentage of persons and minutes spent in a day on an average per person/per participant of age 6 years and above in unpaid activities, paid activities and other activities where the activity was a major activity (considering only the major activity of the time slots)
| Madhya Pradesh | |||||||||
|---|---|---|---|---|---|---|---|---|---|
| Activity | male | female | person | ||||||
| percentage of persons | minutes spent on an average in a day per person | minutes spent on an average in a day per participant | percentage of persons | minutes spent on an average in a day per person | minutes spent on an average in a day per participant | percentage of persons | minutes spent on an average in a day per person | minutes spent on an average in a day per participant | |
| (1) | (2) | (3) | (4) | (5) | (6) | (7) | (8) | (9) | (10) |
| rural | |||||||||
| self maintenance etc | 100.0 | 1115 | 1115 | 100.0 | 1004 | 1004 | 100.0 | 1062 | 1062 |
| unpaid activities: SNA activities | 32.0 | 39 | 121 | 44.1 | 49 | 111 | 37.8 | 44 | 116 |
| unpaid activities:Non SNA activities | 38.2 | 44 | 116 | 86.3 | 316 | 367 | 61.4 | 175 | 286 |
| all unpaid activities | 55.6 | 83 | 149 | 87.5 | 365 | 418 | 71.0 | 219 | 309 |
| paid activities | 64.1 | 242 | 377 | 24.2 | 71 | 293 | 44.8 | 159 | 355 |
| all unapid/paid acivities | 78.4 | 325 | 414 | 87.9 | 436 | 496 | 83.0 | 378 | 456 |
| urban | |||||||||
| self maintenance etc | 100.0 | 1117 | 1117 | 100.0 | 1075 | 1075 | 100.0 | 1097 | 1097 |
| unpaid activities: SNA activities | 8.5 | 8 | 90 | 17.2 | 11 | 66 | 12.8 | 9 | 74 |
| unpaid activities:Non SNA activities | 36.0 | 39 | 108 | 83.4 | 305 | 365 | 59.0 | 168 | 285 |
| all unpaid activities | 40.0 | 47 | 117 | 83.8 | 316 | 377 | 61.3 | 178 | 290 |
| paid activities | 61.7 | 276 | 447 | 14.5 | 49 | 339 | 38.8 | 166 | 428 |
| all unapid/paid acivities | 73.9 | 323 | 437 | 84.9 | 365 | 430 | 79.3 | 343 | 433 |
| rural+urban | |||||||||
| self maintenance etc | 100.0 | 1116 | 1116 | 100.0 | 1024 | 1024 | 100.0 | 1072 | 1072 |
| unpaid activities: SNA activities | 25.2 | 30 | 118 | 36.3 | 38 | 105 | 30.6 | 34 | 111 |
| unpaid activities:Non SNA activities | 37.5 | 43 | 114 | 85.4 | 313 | 366 | 60.7 | 173 | 286 |
| all unpaid activities | 51.1 | 72 | 142 | 86.4 | 351 | 406 | 68.2 | 207 | 304 |
| paid activities | 63.4 | 252 | 397 | 21.4 | 65 | 302 | 43.1 | 161 | 374 |
| all unapid/paid acivities | 77.1 | 324 | 420 | 87.1 | 416 | 477 | 81.9 | 368 | 450 |
Note : The activities under ‘self development/ self care/ self maintenance, etc.’ are ‘residual other activities’
Statement 16.1: Percentage of persons and minutes spent in a day on an average per person/per participant of age 6 years and above in unpaid activities, paid activities and other activities where the activity was a major activity (considering only the major activity of the time slots)
| Maharashtra | |||||||||
|---|---|---|---|---|---|---|---|---|---|
| Activity | male | female | person | ||||||
| percentage of persons | minutes spent on an average in a day per person | minutes spent on an average in a day per participant | percentage of persons | minutes spent on an average in a day per person | minutes spent on an average in a day per participant | percentage of persons | minutes spent on an average in a day per person | minutes spent on an average in a day per participant | |
| (1) | (2) | (3) | (4) | (5) | (6) | (7) | (8) | (9) | (10) |
| rural | |||||||||
| self maintenance etc | 100.0 | 1121 | 1121 | 100.0 | 1022 | 1022 | 100.0 | 1072 | 1072 |
| unpaid activities: SNA activities | 8.8 | 10 | 111 | 18.1 | 13 | 72 | 13.4 | 11 | 85 |
| unpaid activities:Non SNA activities | 32.8 | 35 | 106 | 86.6 | 283 | 327 | 59.1 | 156 | 264 |
| all unpaid activities | 37.1 | 44 | 120 | 86.8 | 296 | 341 | 61.4 | 168 | 273 |
| paid activities | 66.0 | 274 | 415 | 35.6 | 122 | 342 | 51.2 | 200 | 391 |
| all unapid/paid acivities | 75.4 | 319 | 423 | 87.5 | 418 | 478 | 81.3 | 368 | 452 |
| urban | |||||||||
| self maintenance etc | 100.0 | 1106 | 1106 | 100.0 | 1084 | 1084 | 100.0 | 1095 | 1095 |
| unpaid activities: SNA activities | 2.1 | 2 | 82 | 13.9 | 6 | 45 | 7.7 | 4 | 51 |
| unpaid activities:Non SNA activities | 31.3 | 30 | 94 | 83.7 | 277 | 331 | 56.3 | 148 | 262 |
| all unpaid activities | 32.2 | 31 | 97 | 83.8 | 283 | 338 | 56.8 | 152 | 267 |
| paid activities | 62.5 | 303 | 485 | 18.9 | 73 | 386 | 41.7 | 193 | 463 |
| all unapid/paid acivities | 73.1 | 334 | 457 | 85.6 | 356 | 416 | 79.1 | 345 | 436 |
| rural+urban | |||||||||
| self maintenance etc | 100.0 | 1115 | 1115 | 100.0 | 1048 | 1048 | 100.0 | 1082 | 1082 |
| unpaid activities: SNA activities | 5.9 | 6 | 107 | 16.3 | 10 | 62 | 11.0 | 8 | 75 |
| unpaid activities:Non SNA activities | 32.2 | 32 | 101 | 85.4 | 281 | 329 | 57.9 | 153 | 263 |
| all unpaid activities | 35.0 | 39 | 111 | 85.6 | 291 | 340 | 59.5 | 161 | 270 |
| paid activities | 64.5 | 287 | 445 | 28.6 | 101 | 355 | 47.1 | 197 | 418 |
| all unapid/paid acivities | 74.4 | 325 | 437 | 86.7 | 392 | 452 | 80.4 | 358 | 445 |
Note : The activities under ‘self development/ self care/ self maintenance, etc.’ are ‘residual other activities’
Statement 16.1: Percentage of persons and minutes spent in a day on an average per person/per participant of age 6 years and above in unpaid activities, paid activities and other activities where the activity was a major activity (considering only the major activity of the time slots)
| Manipur | |||||||||
|---|---|---|---|---|---|---|---|---|---|
| Activity | male | female | person | ||||||
| percentage of persons | minutes spent on an average in a day per person | minutes spent on an average in a day per participant | percentage of persons | minutes spent on an average in a day per person | minutes spent on an average in a day per participant | percentage of persons | minutes spent on an average in a day per person | minutes spent on an average in a day per participant | |
| (1) | (2) | (3) | (4) | (5) | (6) | (7) | (8) | (9) | (10) |
| rural | |||||||||
| self maintenance etc | 100.0 | 1149 | 1149 | 100.0 | 1039 | 1039 | 100.0 | 1096 | 1096 |
| unpaid activities: SNA activities | 19.9 | 23 | 115 | 30.2 | 40 | 132 | 24.9 | 31 | 125 |
| unpaid activities:Non SNA activities | 44.9 | 52 | 115 | 79.8 | 266 | 334 | 61.9 | 156 | 252 |
| all unpaid activities | 52.5 | 75 | 142 | 81.3 | 306 | 377 | 66.5 | 187 | 282 |
| paid activities | 56.8 | 217 | 382 | 31.9 | 95 | 296 | 44.7 | 157 | 352 |
| all unapid/paid acivities | 71.8 | 291 | 406 | 82.3 | 401 | 487 | 76.9 | 344 | 448 |
| urban | |||||||||
| self maintenance etc | 100.0 | 1130 | 1130 | 100.0 | 1029 | 1029 | 100.0 | 1079 | 1079 |
| unpaid activities: SNA activities | 13.7 | 15 | 108 | 18.3 | 21 | 113 | 16.1 | 18 | 111 |
| unpaid activities:Non SNA activities | 52.8 | 59 | 113 | 79.2 | 267 | 337 | 66.3 | 165 | 249 |
| all unpaid activities | 58.4 | 74 | 127 | 80.4 | 288 | 358 | 69.6 | 183 | 263 |
| paid activities | 56.9 | 235 | 414 | 38.2 | 123 | 323 | 47.4 | 178 | 376 |
| all unapid/paid acivities | 74.2 | 310 | 417 | 82.2 | 411 | 500 | 78.3 | 361 | 462 |
| rural+urban | |||||||||
| self maintenance etc | 100.0 | 1143 | 1143 | 100.0 | 1036 | 1036 | 100.0 | 1090 | 1090 |
| unpaid activities: SNA activities | 18.1 | 21 | 114 | 26.5 | 34 | 128 | 22.2 | 27 | 122 |
| unpaid activities:Non SNA activities | 47.2 | 54 | 114 | 79.6 | 266 | 335 | 63.2 | 159 | 251 |
| all unpaid activities | 54.2 | 74 | 137 | 81.0 | 300 | 371 | 67.4 | 186 | 276 |
| paid activities | 56.8 | 222 | 391 | 33.9 | 104 | 306 | 45.5 | 164 | 360 |
| all unapid/paid acivities | 72.5 | 297 | 409 | 82.2 | 404 | 491 | 77.3 | 350 | 452 |
Note : The activities under ‘self development/ self care/ self maintenance, etc.’ are ‘residual other activities’
Statement 16.1: Percentage of persons and minutes spent in a day on an average per person/per participant of age 6 years and above in unpaid activities, paid activities and other activities where the activity was a major activity (considering only the major activity of the time slots)
| Meghalaya | |||||||||
|---|---|---|---|---|---|---|---|---|---|
| Activity | male | female | person | ||||||
| percentage of persons | minutes spent on an average in a day per person | minutes spent on an average in a day per participant | percentage of persons | minutes spent on an average in a day per person | minutes spent on an average in a day per participant | percentage of persons | minutes spent on an average in a day per person | minutes spent on an average in a day per participant | |
| $(1)$ | $(2)$ | $(3)$ | $(4)$ | $(5)$ | $(6)$ | $(7)$ | $(8)$ | $(9)$ | $(10)$ |
| rural | |||||||||
| self maintenance etc | 100.0 | 1161 | 1161 | 100.0 | 1085 | 1085 | 100.0 | 1122 | 1122 |
| unpaid activities: SNA activities | 11.2 | 20 | 179 | 9.9 | 12 | 121 | 10.5 | 16 | 151 |
| unpaid activities:Non SNA activities | 48.4 | 49 | 101 | 82.9 | 279 | 337 | 66.1 | 167 | 253 |
| all unpaid activities | 51.7 | 69 | 133 | 83.4 | 291 | 349 | 68.0 | 183 | 270 |
| paid activities | 51.0 | 210 | 413 | 17.9 | 63 | 355 | 33.9 | 135 | 397 |
| all unapid/paid acivities | 74.2 | 279 | 376 | 84.1 | 355 | 422 | 79.3 | 318 | 401 |
| urban | |||||||||
| self maintenance etc | 100.0 | 1136 | 1136 | 100.0 | 1110 | 1110 | 100.0 | 1122 | 1122 |
| unpaid activities: SNA activities | 7.7 | 7 | 97 | 6.0 | 7 | 110 | 6.8 | 7 | 103 |
| unpaid activities:Non SNA activities | 49.1 | 55 | 112 | 80.5 | 254 | 315 | 65.6 | 160 | 243 |
| all unpaid activities | 51.3 | 62 | 121 | 80.9 | 260 | 321 | 66.9 | 167 | 249 |
| paid activities | 53.6 | 241 | 450 | 17.3 | 70 | 405 | 34.4 | 151 | 438 |
| all unapid/paid acivities | 78.3 | 304 | 388 | 82.6 | 330 | 400 | 80.6 | 318 | 394 |
| rural+urban | |||||||||
| self maintenance etc | 100.0 | 1157 | 1157 | 100.0 | 1090 | 1090 | 100.0 | 1122 | 1122 |
| unpaid activities: SNA activities | 10.5 | 18 | 168 | 9.1 | 11 | 120 | 9.8 | 14 | 145 |
| unpaid activities:Non SNA activities | 48.5 | 50 | 103 | 82.4 | 274 | 333 | 66.0 | 166 | 251 |
| all unpaid activities | 51.6 | 68 | 131 | 82.9 | 285 | 344 | 67.8 | 180 | 266 |
| paid activities | 51.5 | 216 | 420 | 17.8 | 65 | 364 | 34.0 | 138 | 405 |
| all unapid/paid acivities | 75.0 | 283 | 378 | 83.9 | 350 | 418 | 79.5 | 318 | 400 |
Note : The activities under ‘self development/ self care/ self maintenance, etc.’ are ‘residual other activities’
Statement 16.1: Percentage of persons and minutes spent in a day on an average per person/per participant of age 6 years and above in unpaid activities, paid activities and other activities where the activity was a major activity (considering only the major activity of the time slots)
| Mizoram | |||||||||
|---|---|---|---|---|---|---|---|---|---|
| Activity | male | female | person | ||||||
| percentage of persons | minutes spent on an average in a day per person | minutes spent on an average in a day per participant | percentage of persons | minutes spent on an average in a day per person | minutes spent on an average in a day per participant | percentage of persons | minutes spent on an average in a day per person | minutes spent on an average in a day per participant | |
| (1) | (2) | (3) | (4) | (5) | (6) | (7) | (8) | (9) | (10) |
| rural | |||||||||
| self maintenance etc | 100.0 | 1106 | 1106 | 100.0 | 987 | 987 | 100.0 | 1048 | 1048 |
| unpaid activities: SNA activities | 27.0 | 22 | 82 | 31.0 | 42 | 137 | 28.9 | 32 | 111 |
| unpaid activities:Non SNA activities | 47.1 | 50 | 106 | 90.8 | 306 | 336 | 68.3 | 174 | 255 |
| all unpaid activities | 57.5 | 72 | 126 | 91.9 | 348 | 378 | 74.2 | 206 | 278 |
| paid activities | 69.0 | 262 | 380 | 30.6 | 105 | 343 | 50.4 | 186 | 369 |
| all unapid/paid acivities | 80.9 | 334 | 413 | 92.5 | 453 | 490 | 86.5 | 392 | 453 |
| urban | |||||||||
| self maintenance etc | 100.0 | 1125 | 1125 | 100.0 | 1031 | 1031 | 100.0 | 1078 | 1078 |
| unpaid activities: SNA activities | 4.1 | 5 | 113 | 9.6 | 12 | 121 | 6.9 | 8 | 118 |
| unpaid activities:Non SNA activities | 49.8 | 63 | 126 | 89.1 | 316 | 355 | 69.5 | 190 | 273 |
| all unpaid activities | 51.0 | 67 | 132 | 89.3 | 328 | 367 | 70.2 | 198 | 282 |
| paid activities | 60.0 | 247 | 413 | 21.7 | 81 | 375 | 40.8 | 164 | 403 |
| all unapid/paid acivities | 75.3 | 315 | 418 | 91.5 | 409 | 447 | 83.5 | 362 | 434 |
| rural+urban | |||||||||
| self maintenance etc | 100.0 | 1114 | 1114 | 100.0 | 1007 | 1007 | 100.0 | 1061 | 1061 |
| unpaid activities: SNA activities | 17.1 | 15 | 86 | 21.4 | 29 | 133 | 19.2 | 21 | 112 |
| unpaid activities:Non SNA activities | 48.3 | 55 | 115 | 90.1 | 310 | 345 | 68.8 | 181 | 263 |
| all unpaid activities | 54.7 | 70 | 128 | 90.8 | 339 | 373 | 72.4 | 203 | 280 |
| paid activities | 65.1 | 256 | 393 | 26.6 | 94 | 355 | 46.1 | 176 | 382 |
| all unapid/paid acivities | 78.5 | 326 | 415 | 92.0 | 433 | 471 | 85.2 | 379 | 445 |
Note : The activities under ‘self development/ self care/ self maintenance, etc.’ are ‘residual other activities’
Statement 16.1: Percentage of persons and minutes spent in a day on an average per person/per participant of age 6 years and above in unpaid activities, paid activities and other activities where the activity was a major activity (considering only the major activity of the time slots)
| Nagaland | |||||||||
|---|---|---|---|---|---|---|---|---|---|
| Activity | male | female | person | ||||||
| percentage of persons | minutes spent on an average in a day per person | minutes spent on an average in a day per participant | percentage of persons | minutes spent on an average in a day per person | minutes spent on an average in a day per participant | percentage of persons | minutes spent on an average in a day per person | minutes spent on an average in a day per participant | |
| (1) | (2) | (3) | (4) | (5) | (6) | (7) | (8) | (9) | (10) |
| rural | |||||||||
| self maintenance etc | 100.0 | 1150 | 1150 | 100.0 | 1049 | 1049 | 100.0 | 1101 | 1101 |
| unpaid activities: SNA activities | 56.8 | 145 | 255 | 52.7 | 117 | 222 | 54.8 | 131 | 239 |
| unpaid activities:Non SNA activities | 64.7 | 82 | 127 | 86.4 | 257 | 297 | 75.4 | 168 | 223 |
| all unpaid activities | 81.3 | 227 | 279 | 88.1 | 374 | 424 | 84.7 | 299 | 353 |
| paid activities | 20.6 | 63 | 306 | 7.8 | 17 | 215 | 14.3 | 40 | 281 |
| all unapid/paid acivities | 84.2 | 290 | 344 | 88.6 | 391 | 441 | 86.4 | 339 | 393 |
| urban | |||||||||
| self maintenance etc | 100.0 | 1171 | 1171 | 100.0 | 1077 | 1077 | 100.0 | 1126 | 1126 |
| unpaid activities: SNA activities | 22.7 | 28 | 125 | 17.1 | 22 | 130 | 20.0 | 25 | 127 |
| unpaid activities:Non SNA activities | 67.1 | 95 | 141 | 84.5 | 295 | 350 | 75.5 | 192 | 254 |
| all unpaid activities | 73.4 | 123 | 168 | 84.8 | 318 | 375 | 78.9 | 218 | 276 |
| paid activities | 39.0 | 145 | 373 | 15.2 | 45 | 299 | 27.4 | 97 | 353 |
| all unapid/paid acivities | 80.6 | 269 | 333 | 86.3 | 363 | 420 | 83.4 | 314 | 377 |
| rural+urban | |||||||||
| self maintenance etc | 100.0 | 1158 | 1158 | 100.0 | 1059 | 1059 | 100.0 | 1109 | 1109 |
| unpaid activities: SNA activities | 45.0 | 104 | 232 | 40.6 | 85 | 209 | 42.9 | 95 | 221 |
| unpaid activities:Non SNA activities | 65.5 | 86 | 132 | 85.7 | 270 | 315 | 75.4 | 176 | 234 |
| all unpaid activities | 78.6 | 191 | 243 | 87.0 | 355 | 408 | 82.7 | 271 | 328 |
| paid activities | 26.9 | 91 | 339 | 10.3 | 27 | 257 | 18.8 | 60 | 317 |
| all unapid/paid acivities | 83.0 | 282 | 340 | 87.8 | 381 | 434 | 85.4 | 331 | 388 |
Note : The activities under ‘self development/ self care/ self maintenance, etc.’ are ‘residual other activities’
Statement 16.1: Percentage of persons and minutes spent in a day on an average per person/per participant of age 6 years and above in unpaid activities, paid activities and other activities where the activity was a major activity (considering only the major activity of the time slots)
| Odisha | |||||||||
|---|---|---|---|---|---|---|---|---|---|
| Activity | male | female | person | ||||||
| percentage of persons | minutes spent on an average in a day per person | minutes spent on an average in a day per participant | percentage of persons | minutes spent on an average in a day per person | minutes spent on an average in a day per participant | percentage of persons | minutes spent on an average in a day per person | minutes spent on an average in a day per participant | |
| (1) | (2) | (3) | (4) | (5) | (6) | (7) | (8) | (9) | (10) |
| rural | |||||||||
| self maintenance etc | 100.0 | 1161 | 1161 | 100.0 | 1071 | 1071 | 100.0 | 1115 | 1115 |
| unpaid activities: SNA activities | 18.5 | 32 | 173 | 36.8 | 39 | 105 | 27.8 | 35 | 127 |
| unpaid activities:Non SNA activities | 33.9 | 40 | 117 | 81.0 | 287 | 354 | 57.8 | 166 | 286 |
| all unpaid activities | 43.5 | 72 | 165 | 82.5 | 325 | 395 | 63.3 | 201 | 317 |
| paid activities | 55.9 | 207 | 371 | 15.1 | 43 | 286 | 35.1 | 124 | 352 |
| all unapid/paid acivities | 72.5 | 279 | 385 | 83.3 | 369 | 443 | 78.0 | 325 | 416 |
| urban | |||||||||
| self maintenance etc | 100.0 | 1133 | 1133 | 100.0 | 1121 | 1121 | 100.0 | 1127 | 1127 |
| unpaid activities: SNA activities | 4.2 | 4 | 99 | 11.2 | 7 | 59 | 7.8 | 5 | 70 |
| unpaid activities:Non SNA activities | 39.8 | 44 | 110 | 79.6 | 267 | 335 | 60.4 | 159 | 264 |
| all unpaid activities | 41.9 | 48 | 115 | 79.9 | 274 | 343 | 61.5 | 165 | 268 |
| paid activities | 58.9 | 258 | 439 | 13.3 | 45 | 338 | 35.3 | 148 | 419 |
| all unapid/paid acivities | 73.7 | 307 | 416 | 80.6 | 319 | 396 | 77.2 | 313 | 405 |
| rural+urban | |||||||||
| self maintenance etc | 100.0 | 1156 | 1156 | 100.0 | 1080 | 1080 | 100.0 | 1117 | 1117 |
| unpaid activities: SNA activities | 16.1 | 27 | 170 | 32.5 | 33 | 102 | 24.5 | 30 | 124 |
| unpaid activities:Non SNA activities | 34.8 | 40 | 116 | 80.8 | 284 | 351 | 58.3 | 164 | 282 |
| all unpaid activities | 43.2 | 68 | 157 | 82.0 | 317 | 386 | 63.0 | 195 | 309 |
| paid activities | 56.4 | 216 | 383 | 14.8 | 44 | 294 | 35.2 | 128 | 364 |
| all unapid/paid acivities | 72.7 | 284 | 390 | 82.8 | 360 | 435 | 77.9 | 323 | 414 |
Note : The activities under ‘self development/ self care/ self maintenance, etc.’ are ‘residual other activities’
Statement 16.1: Percentage of persons and minutes spent in a day on an average per person/per participant of age 6 years and above in unpaid activities, paid activities and other activities where the activity was a major activity (considering only the major activity of the time slots)
| Punjab | |||||||||
|---|---|---|---|---|---|---|---|---|---|
| Activity | male | female | person | ||||||
| percentage of persons | minutes spent on an average in a day per person | minutes spent on an average in a day per participant | percentage of persons | minutes spent on an average in a day per person | minutes spent on an average in a day per participant | percentage of persons | minutes spent on an average in a day per person | minutes spent on an average in a day per participant | |
| (1) | (2) | (3) | (4) | (5) | (6) | (7) | (8) | (9) | (10) |
| rural | |||||||||
| self maintenance etc | 100.0 | 1105 | 1105 | 100.0 | 1075 | 1075 | 100.0 | 1091 | 1091 |
| unpaid activities: SNA activities | 10.7 | 15 | 145 | 12.9 | 16 | 123 | 11.7 | 16 | 134 |
| unpaid activities:Non SNA activities | 36.1 | 36 | 100 | 83.4 | 295 | 354 | 58.5 | 159 | 271 |
| all unpaid activities | 41.9 | 51 | 123 | 83.6 | 311 | 372 | 61.7 | 175 | 283 |
| paid activities | 63.9 | 283 | 443 | 19.8 | 54 | 273 | 43.0 | 174 | 406 |
| all unapid/paid acivities | 75.6 | 335 | 443 | 84.4 | 365 | 432 | 79.8 | 349 | 437 |
| urban | |||||||||
| self maintenance etc | 100.0 | 1081 | 1081 | 100.0 | 1073 | 1073 | 100.0 | 1077 | 1077 |
| unpaid activities: SNA activities | 2.1 | 5 | 244 | 2.1 | 3 | 153 | 2.1 | 4 | 202 |
| unpaid activities:Non SNA activities | 42.2 | 45 | 106 | 84.5 | 294 | 348 | 62.1 | 162 | 261 |
| all unpaid activities | 43.1 | 50 | 116 | 84.6 | 297 | 351 | 62.6 | 166 | 265 |
| paid activities | 63.8 | 309 | 484 | 19.1 | 69 | 363 | 42.8 | 196 | 459 |
| all unapid/paid acivities | 77.1 | 359 | 466 | 85.3 | 367 | 430 | 81.0 | 363 | 448 |
| rural+urban | |||||||||
| self maintenance etc | 100.0 | 1096 | 1096 | 100.0 | 1075 | 1075 | 100.0 | 1086 | 1086 |
| unpaid activities: SNA activities | 7.2 | 11 | 156 | 8.6 | 11 | 126 | 7.9 | 11 | 141 |
| unpaid activities:Non SNA activities | 38.5 | 40 | 103 | 83.8 | 294 | 351 | 59.9 | 160 | 267 |
| all unpaid activities | 42.4 | 51 | 120 | 84.0 | 305 | 364 | 62.1 | 171 | 276 |
| paid activities | 63.9 | 293 | 459 | 19.5 | 60 | 308 | 42.9 | 183 | 427 |
| all unapid/paid acivities | 76.2 | 344 | 452 | 84.8 | 365 | 431 | 80.3 | 354 | 442 |
Note : The activities under ‘self development/ self care/ self maintenance, etc.’ are ‘residual other activities’
Statement 16.1: Percentage of persons and minutes spent in a day on an average per person/per participant of age 6 years and above in unpaid activities, paid activities and other activities where the activity was a major activity (considering only the major activity of the time slots)
| Rajasthan | |||||||||
|---|---|---|---|---|---|---|---|---|---|
| Activity | male | female | person | ||||||
| percentage of persons | minutes spent on an average in a day per person | minutes spent on an average in a day per participant | percentage of persons | minutes spent on an average in a day per person | minutes spent on an average in a day per participant | percentage of persons | minutes spent on an average in a day per person | minutes spent on an average in a day per participant | |
| (1) | (2) | (3) | (4) | (5) | (6) | (7) | (8) | (9) | (10) |
| rural | |||||||||
| self maintenance etc | 100.0 | 1148 | 1148 | 100.0 | 1037 | 1037 | 100.0 | 1091 | 1091 |
| unpaid activities: SNA activities | 24.2 | 41 | 169 | 44.3 | 78 | 176 | 34.6 | 60 | 174 |
| unpaid activities:Non SNA activities | 33.0 | 32 | 96 | 83.5 | 251 | 301 | 59.0 | 145 | 245 |
| all unpaid activities | 45.9 | 72 | 158 | 84.8 | 330 | 389 | 66.0 | 205 | 311 |
| paid activities | 52.8 | 219 | 416 | 27.1 | 73 | 269 | 39.5 | 144 | 364 |
| all unapid/paid acivities | 71.3 | 292 | 409 | 85.5 | 403 | 471 | 78.6 | 349 | 444 |
| urban | |||||||||
| self maintenance etc | 100.0 | 1120 | 1120 | 100.0 | 1113 | 1113 | 100.0 | 1117 | 1117 |
| unpaid activities: SNA activities | 3.0 | 4 | 139 | 8.1 | 8 | 98 | 5.4 | 6 | 110 |
| unpaid activities:Non SNA activities | 34.3 | 35 | 101 | 81.0 | 266 | 328 | 56.4 | 144 | 255 |
| all unpaid activities | 35.9 | 39 | 109 | 81.3 | 274 | 337 | 57.3 | 150 | 262 |
| paid activities | 59.5 | 281 | 473 | 16.2 | 53 | 329 | 39.0 | 174 | 444 |
| all unapid/paid acivities | 72.1 | 320 | 444 | 82.3 | 327 | 398 | 76.9 | 323 | 421 |
| rural+urban | |||||||||
| self maintenance etc | 100.0 | 1140 | 1140 | 100.0 | 1056 | 1056 | 100.0 | 1098 | 1098 |
| unpaid activities: SNA activities | 18.2 | 31 | 168 | 35.3 | 61 | 172 | 26.8 | 46 | 170 |
| unpaid activities:Non SNA activities | 33.4 | 32 | 97 | 82.9 | 255 | 308 | 58.3 | 145 | 248 |
| all unpaid activities | 43.1 | 63 | 146 | 83.9 | 316 | 376 | 63.7 | 190 | 299 |
| paid activities | 54.7 | 237 | 433 | 24.4 | 68 | 279 | 39.4 | 152 | 385 |
| all unapid/paid acivities | 71.6 | 300 | 419 | 84.7 | 384 | 453 | 78.2 | 342 | 438 |
Note : The activities under ‘self development/ self care/ self maintenance, etc.’ are ‘residual other activities’
Statement 16.1: Percentage of persons and minutes spent in a day on an average per person/per participant of age 6 years and above in unpaid activities, paid activities and other activities where the activity was a major activity (considering only the major activity of the time slots)
| Sikkim | |||||||||
|---|---|---|---|---|---|---|---|---|---|
| Activity | male | female | person | ||||||
| percentage of persons | minutes spent on an average in a day per person | minutes spent on an average in a day per participant | percentage of persons | minutes spent on an average in a day per person | minutes spent on an average in a day per participant | percentage of persons | minutes spent on an average in a day per person | minutes spent on an average in a day per participant | |
| (1) | (2) | (3) | (4) | (5) | (6) | (7) | (8) | (9) | (10) |
| rural | |||||||||
| self maintenance etc | 100.0 | 1080 | 1080 | 100.0 | 1044 | 1044 | 100.0 | 1063 | 1063 |
| unpaid activities: SNA activities | 22.7 | 42 | 186 | 19.3 | 24 | 127 | 21.0 | 34 | 160 |
| unpaid activities:Non SNA activities | 64.3 | 71 | 111 | 89.7 | 298 | 333 | 76.7 | 182 | 237 |
| all unpaid activities | 70.8 | 113 | 160 | 89.9 | 323 | 359 | 80.1 | 215 | 269 |
| paid activities | 64.9 | 246 | 380 | 25.2 | 73 | 290 | 45.5 | 162 | 355 |
| all unapid/paid acivities | 84.2 | 360 | 427 | 91.3 | 396 | 434 | 87.6 | 377 | 430 |
| urban | |||||||||
| self maintenance etc | 100.0 | 1036 | 1036 | 100.0 | 1006 | 1006 | 100.0 | 1022 | 1022 |
| unpaid activities: SNA activities | 1.4 | 1 | 84 | 2.5 | 2 | 76 | 1.9 | 2 | 79 |
| unpaid activities:Non SNA activities | 68.6 | 87 | 127 | 94.8 | 324 | 342 | 80.7 | 196 | 243 |
| all unpaid activities | 68.8 | 88 | 128 | 94.8 | 326 | 344 | 80.8 | 198 | 245 |
| paid activities | 65.2 | 316 | 485 | 28.5 | 108 | 379 | 48.3 | 220 | 456 |
| all unapid/paid acivities | 89.1 | 404 | 453 | 95.5 | 434 | 454 | 92.1 | 418 | 454 |
| rural+urban | |||||||||
| self maintenance etc | 100.0 | 1069 | 1069 | 100.0 | 1035 | 1035 | 100.0 | 1052 | 1052 |
| unpaid activities: SNA activities | 17.1 | 31 | 184 | 15.3 | 19 | 125 | 16.2 | 25 | 157 |
| unpaid activities:Non SNA activities | 65.4 | 75 | 115 | 90.9 | 304 | 335 | 77.7 | 185 | 239 |
| all unpaid activities | 70.3 | 107 | 152 | 91.1 | 324 | 355 | 80.2 | 211 | 263 |
| paid activities | 65.0 | 265 | 407 | 26.0 | 82 | 314 | 46.2 | 177 | 382 |
| all unapid/paid acivities | 85.5 | 371 | 434 | 92.3 | 405 | 439 | 88.8 | 388 | 437 |
Note : The activities under ‘self development/ self care/ self maintenance, etc.’ are ‘residual other activities’
Statement 16.1: Percentage of persons and minutes spent in a day on an average per person/per participant of age 6 years and above in unpaid activities, paid activities and other activities where the activity was a major activity (considering only the major activity of the time slots)
| Tamil Nadu | |||||||||
|---|---|---|---|---|---|---|---|---|---|
| Activity | male | female | person | ||||||
| percentage of persons | minutes spent on an average in a day per person | minutes spent on an average in a day per participant | percentage of persons | minutes spent on an average in a day per person | minutes spent on an average in a day per participant | percentage of persons | minutes spent on an average in a day per person | minutes spent on an average in a day per participant | |
| (1) | (2) | (3) | (4) | (5) | (6) | (7) | (8) | (9) | (10) |
| rural | |||||||||
| self maintenance etc | 100.0 | 1124 | 1124 | 100.0 | 1069 | 1069 | 100.0 | 1095 | 1095 |
| unpaid activities: SNA activities | 9.4 | 8 | 87 | 22.9 | 13 | 55 | 16.5 | 11 | 64 |
| unpaid activities:Non SNA activities | 37.3 | 35 | 93 | 83.5 | 230 | 276 | 61.5 | 137 | 223 |
| all unpaid activities | 42.5 | 43 | 101 | 84.3 | 243 | 288 | 64.4 | 148 | 229 |
| paid activities | 62.1 | 273 | 440 | 37.6 | 128 | 341 | 49.3 | 197 | 400 |
| all unapid/paid acivities | 75.7 | 316 | 418 | 85.8 | 371 | 432 | 81.0 | 345 | 426 |
| urban | |||||||||
| self maintenance etc | 100.0 | 1098 | 1098 | 100.0 | 1081 | 1081 | 100.0 | 1089 | 1089 |
| unpaid activities: SNA activities | 4.6 | 2 | 54 | 9.6 | 5 | 51 | 7.1 | 4 | 52 |
| unpaid activities:Non SNA activities | 41.1 | 40 | 98 | 82.4 | 256 | 311 | 61.9 | 149 | 241 |
| all unpaid activities | 43.1 | 43 | 99 | 82.7 | 261 | 316 | 63.0 | 153 | 242 |
| paid activities | 63.0 | 299 | 475 | 25.1 | 98 | 391 | 43.9 | 198 | 451 |
| all unapid/paid acivities | 77.7 | 342 | 440 | 84.8 | 359 | 424 | 81.3 | 351 | 431 |
| rural+urban | |||||||||
| self maintenance etc | 100.0 | 1111 | 1111 | 100.0 | 1075 | 1075 | 100.0 | 1092 | 1092 |
| unpaid activities: SNA activities | 7.1 | 5 | 77 | 16.7 | 9 | 54 | 12.0 | 7 | 61 |
| unpaid activities:Non SNA activities | 39.1 | 37 | 95 | 83.0 | 242 | 292 | 61.7 | 143 | 231 |
| all unpaid activities | 42.8 | 43 | 100 | 83.5 | 251 | 301 | 63.7 | 150 | 235 |
| paid activities | 62.5 | 286 | 457 | 31.7 | 114 | 359 | 46.7 | 198 | 423 |
| all unapid/paid acivities | 76.7 | 329 | 429 | 85.3 | 365 | 428 | 81.1 | 348 | 429 |
Note : The activities under ‘self development/ self care/ self maintenance, etc.’ are ‘residual other activities’
Statement 16.1: Percentage of persons and minutes spent in a day on an average per person/per participant of age 6 years and above in unpaid activities, paid activities and other activities where the activity was a major activity (considering only the major activity of the time slots)
| Telangana | |||||||||
|---|---|---|---|---|---|---|---|---|---|
| Activity | male | female | person | ||||||
| percentage of persons | minutes spent on an average in a day per person | minutes spent on an average in a day per participant | percentage of persons | minutes spent on an average in a day per person | minutes spent on an average in a day per participant | percentage of persons | minutes spent on an average in a day per person | minutes spent on an average in a day per participant | |
| (1) | (2) | (3) | (4) | (5) | (6) | (7) | (8) | (9) | (10) |
| rural | |||||||||
| self maintenance etc | 100.0 | 1121 | 1121 | 100.0 | 1026 | 1026 | 100.0 | 1073 | 1073 |
| unpaid activities: SNA activities | 10.4 | 6 | 62 | 8.6 | 6 | 68 | 9.5 | 6 | 65 |
| unpaid activities:Non SNA activities | 46.9 | 46 | 97 | 85.8 | 264 | 307 | 66.8 | 157 | 235 |
| all unpaid activities | 50.8 | 52 | 102 | 85.9 | 270 | 314 | 68.7 | 163 | 237 |
| paid activities | 66.7 | 267 | 400 | 42.5 | 144 | 339 | 54.3 | 204 | 376 |
| all unapid/paid acivities | 77.0 | 319 | 414 | 86.3 | 414 | 480 | 81.8 | 367 | 449 |
| urban | |||||||||
| self maintenance etc | 100.0 | 1120 | 1120 | 100.0 | 1074 | 1074 | 100.0 | 1097 | 1097 |
| unpaid activities: SNA activities | 3.9 | 2 | 43 | 2.9 | 2 | 62 | 3.5 | 2 | 51 |
| unpaid activities:Non SNA activities | 49.1 | 48 | 98 | 80.5 | 274 | 341 | 64.5 | 159 | 246 |
| all unpaid activities | 50.4 | 50 | 98 | 80.6 | 276 | 343 | 65.2 | 161 | 246 |
| paid activities | 58.5 | 270 | 462 | 23.7 | 90 | 380 | 41.5 | 182 | 439 |
| all unapid/paid acivities | 73.9 | 320 | 433 | 82.7 | 366 | 443 | 78.2 | 343 | 438 |
| rural+urban | |||||||||
| self maintenance etc | 100.0 | 1121 | 1121 | 100.0 | 1046 | 1046 | 100.0 | 1083 | 1083 |
| unpaid activities: SNA activities | 7.6 | 4 | 58 | 6.3 | 4 | 67 | 6.9 | 4 | 62 |
| unpaid activities:Non SNA activities | 47.9 | 47 | 97 | 83.6 | 268 | 321 | 65.8 | 158 | 240 |
| all unpaid activities | 50.6 | 51 | 101 | 83.7 | 272 | 325 | 67.2 | 162 | 241 |
| paid activities | 63.2 | 268 | 425 | 34.8 | 122 | 351 | 48.9 | 195 | 398 |
| all unapid/paid acivities | 75.7 | 319 | 422 | 84.8 | 394 | 465 | 80.3 | 357 | 445 |
Note : The activities under ‘self development/ self care/ self maintenance, etc.’ are ‘residual other activities’
Statement 16.1: Percentage of persons and minutes spent in a day on an average per person/per participant of age 6 years and above in unpaid activities, paid activities and other activities where the activity was a major activity (considering only the major activity of the time slots)
| Tripura | |||||||||
|---|---|---|---|---|---|---|---|---|---|
| Activity | male | female | person | ||||||
| percentage of persons | minutes spent on an average in a day per person | minutes spent on an average in a day per participant | percentage of persons | minutes spent on an average in a day per person | minutes spent on an average in a day per participant | percentage of persons | minutes spent on an average in a day per person | minutes spent on an average in a day per participant | |
| (1) | (2) | (3) | (4) | (5) | (6) | (7) | (8) | (9) | (10) |
| rural | |||||||||
| self maintenance etc | 100.0 | 1131 | 1131 | 100.0 | 1074 | 1074 | 100.0 | 1102 | 1102 |
| unpaid activities: SNA activities | 17.8 | 21 | 115 | 36.9 | 38 | 104 | 27.5 | 30 | 107 |
| unpaid activities:Non SNA activities | 44.2 | 48 | 108 | 83.2 | 282 | 339 | 64.1 | 167 | 261 |
| all unpaid activities | 50.7 | 68 | 135 | 83.8 | 320 | 382 | 67.5 | 197 | 291 |
| paid activities | 64.3 | 240 | 374 | 16.6 | 45 | 274 | 40.0 | 141 | 353 |
| all unapid/paid acivities | 76.6 | 309 | 403 | 84.5 | 366 | 433 | 80.6 | 338 | 419 |
| urban | |||||||||
| self maintenance etc | 100.0 | 1149 | 1149 | 100.0 | 1111 | 1111 | 100.0 | 1129 | 1129 |
| unpaid activities: SNA activities | 6.7 | 7 | 102 | 10.4 | 7 | 64 | 8.6 | 7 | 78 |
| unpaid activities:Non SNA activities | 41.9 | 45 | 107 | 81.4 | 275 | 338 | 62.3 | 164 | 263 |
| all unpaid activities | 43.8 | 51 | 118 | 81.8 | 282 | 345 | 63.4 | 170 | 269 |
| paid activities | 56.6 | 240 | 424 | 14.9 | 47 | 313 | 35.1 | 140 | 400 |
| all unapid/paid acivities | 71.7 | 291 | 406 | 82.9 | 329 | 397 | 77.5 | 311 | 401 |
| rural+urban | |||||||||
| self maintenance etc | 100.0 | 1135 | 1135 | 100.0 | 1083 | 1083 | 100.0 | 1108 | 1108 |
| unpaid activities: SNA activities | 15.4 | 18 | 114 | 31.1 | 31 | 101 | 23.4 | 25 | 105 |
| unpaid activities:Non SNA activities | 43.7 | 47 | 108 | 82.8 | 281 | 339 | 63.7 | 166 | 261 |
| all unpaid activities | 49.2 | 65 | 132 | 83.4 | 312 | 374 | 66.6 | 191 | 286 |
| paid activities | 62.6 | 240 | 384 | 16.2 | 46 | 282 | 38.9 | 141 | 362 |
| all unapid/paid acivities | 75.6 | 305 | 404 | 84.2 | 357 | 425 | 79.9 | 332 | 415 |
Note : The activities under ‘self development/ self care/ self maintenance, etc.’ are ‘residual other activities’
Statement 16.1: Percentage of persons and minutes spent in a day on an average per person/per participant of age 6 years and above in unpaid activities, paid activities and other activities where the activity was a major activity (considering only the major activity of the time slots)
| Uttar Pradesh | |||||||||
|---|---|---|---|---|---|---|---|---|---|
| Activity | male | female | person | ||||||
| percentage of persons | minutes spent on an average in a day per person | minutes spent on an average in a day per participant | percentage of persons | minutes spent on an average in a day per person | minutes spent on an average in a day per participant | percentage of persons | minutes spent on an average in a day per person | minutes spent on an average in a day per participant | |
| (1) | (2) | (3) | (4) | (5) | (6) | (7) | (8) | (9) | (10) |
| rural | |||||||||
| self maintenance etc | 100.0 | 1127 | 1127 | 100.0 | 1058 | 1058 | 100.0 | 1092 | 1092 |
| unpaid activities: SNA activities | 23.1 | 41 | 178 | 21.2 | 30 | 142 | 22.2 | 36 | 160 |
| unpaid activities:Non SNA activities | 36.3 | 39 | 108 | 82.6 | 319 | 386 | 59.7 | 181 | 302 |
| all unpaid activities | 48.3 | 80 | 166 | 83.5 | 349 | 418 | 66.1 | 216 | 327 |
| paid activities | 56.5 | 233 | 412 | 13.9 | 33 | 238 | 34.9 | 132 | 377 |
| all unapid/paid acivities | 73.2 | 313 | 428 | 84.3 | 382 | 453 | 78.8 | 348 | 442 |
| urban | |||||||||
| self maintenance etc | 100.0 | 1110 | 1110 | 100.0 | 1080 | 1080 | 100.0 | 1096 | 1096 |
| unpaid activities: SNA activities | 3.2 | 5 | 143 | 3.7 | 5 | 124 | 3.5 | 5 | 133 |
| unpaid activities:Non SNA activities | 37.0 | 41 | 110 | 82.1 | 320 | 389 | 59.1 | 177 | 300 |
| all unpaid activities | 38.6 | 45 | 117 | 82.3 | 324 | 394 | 60.0 | 182 | 303 |
| paid activities | 60.5 | 285 | 471 | 10.2 | 36 | 348 | 35.9 | 163 | 454 |
| all unapid/paid acivities | 72.6 | 330 | 454 | 83.2 | 360 | 432 | 77.8 | 344 | 443 |
| rural+urban | |||||||||
| self maintenance etc | 100.0 | 1123 | 1123 | 100.0 | 1062 | 1062 | 100.0 | 1093 | 1093 |
| unpaid activities: SNA activities | 18.9 | 33 | 176 | 17.7 | 25 | 142 | 18.3 | 29 | 159 |
| unpaid activities:Non SNA activities | 36.4 | 39 | 108 | 82.5 | 319 | 387 | 59.6 | 180 | 302 |
| all unpaid activities | 46.3 | 73 | 157 | 83.3 | 344 | 413 | 64.9 | 209 | 322 |
| paid activities | 57.3 | 244 | 425 | 13.2 | 34 | 255 | 35.1 | 138 | 393 |
| all unapid/paid acivities | 73.0 | 317 | 433 | 84.1 | 378 | 449 | 78.6 | 347 | 442 |
Note : The activities under ‘self development/ self care/ self maintenance, etc.’ are ‘residual other activities’
Statement 16.1: Percentage of persons and minutes spent in a day on an average per person/per participant of age 6 years and above in unpaid activities, paid activities and other activities where the activity was a major activity (considering only the major activity of the time slots)
| Uttarakhand | |||||||||
|---|---|---|---|---|---|---|---|---|---|
| Activity | male | female | person | ||||||
| percentage of persons | minutes spent on an average in a day per person | minutes spent on an average in a day per participant | percentage of persons | minutes spent on an average in a day per person | minutes spent on an average in a day per participant | percentage of persons | minutes spent on an average in a day per person | minutes spent on an average in a day per participant | |
| (1) | (2) | (3) | (4) | (5) | (6) | (7) | (8) | (9) | (10) |
| rural | |||||||||
| self maintenance etc | 100.0 | 1166 | 1166 | 100.0 | 1081 | 1081 | 100.0 | 1123 | 1123 |
| unpaid activities: SNA activities | 17.3 | 34 | 199 | 36.0 | 74 | 205 | 26.7 | 54 | 203 |
| unpaid activities:Non SNA activities | 41.2 | 41 | 100 | 83.1 | 263 | 316 | 62.3 | 152 | 245 |
| all unpaid activities | 49.5 | 76 | 153 | 84.6 | 336 | 398 | 67.1 | 207 | 308 |
| paid activities | 50.1 | 199 | 397 | 8.4 | 23 | 270 | 29.1 | 110 | 379 |
| all unapid/paid acivities | 73.8 | 274 | 372 | 85.4 | 359 | 421 | 79.6 | 317 | 398 |
| urban | |||||||||
| self maintenance etc | 100.0 | 1146 | 1146 | 100.0 | 1113 | 1113 | 100.0 | 1130 | 1130 |
| unpaid activities: SNA activities | 2.1 | 3 | 126 | 5.9 | 5 | 81 | 3.9 | 4 | 93 |
| unpaid activities:Non SNA activities | 46.8 | 48 | 103 | 82.9 | 281 | 339 | 64.5 | 162 | 251 |
| all unpaid activities | 47.5 | 51 | 107 | 83.0 | 286 | 344 | 64.9 | 166 | 255 |
| paid activities | 56.4 | 243 | 431 | 11.9 | 41 | 346 | 34.6 | 144 | 417 |
| all unapid/paid acivities | 75.6 | 294 | 388 | 84.1 | 327 | 389 | 79.8 | 310 | 388 |
| rural+urban | |||||||||
| self maintenance etc | 100.0 | 1160 | 1160 | 100.0 | 1089 | 1089 | 100.0 | 1125 | 1125 |
| unpaid activities: SNA activities | 13.2 | 26 | 196 | 28.3 | 56 | 198 | 20.7 | 41 | 197 |
| unpaid activities:Non SNA activities | 42.7 | 43 | 101 | 83.1 | 267 | 322 | 62.8 | 155 | 247 |
| all unpaid activities | 49.0 | 69 | 141 | 84.2 | 323 | 384 | 66.5 | 196 | 294 |
| paid activities | 51.7 | 211 | 407 | 9.3 | 27 | 295 | 30.6 | 119 | 390 |
| all unapid/paid acivities | 74.3 | 280 | 376 | 85.0 | 351 | 413 | 79.7 | 315 | 396 |
Note : The activities under ‘self development/ self care/ self maintenance, etc.’ are ‘residual other activities’
Statement 16.1: Percentage of persons and minutes spent in a day on an average per person/per participant of age 6 years and above in unpaid activities, paid activities and other activities where the activity was a major activity (considering only the major activity of the time slots)
| West Bengal | |||||||||
|---|---|---|---|---|---|---|---|---|---|
| Activity | male | female | person | ||||||
| percentage of persons | minutes spent on an average in a day per person | minutes spent on an average in a day per participant | percentage of persons | minutes spent on an average in a day per person | minutes spent on an average in a day per participant | percentage of persons | minutes spent on an average in a day per person | minutes spent on an average in a day per participant | |
| (1) | (2) | (3) | (4) | (5) | (6) | (7) | (8) | (9) | (10) |
| rural | |||||||||
| self maintenance etc | 100.0 | 1124 | 1124 | 100.0 | 1063 | 1063 | 100.0 | 1093 | 1093 |
| unpaid activities: SNA activities | 11.1 | 14 | 128 | 31.1 | 26 | 85 | 21.2 | 20 | 96 |
| unpaid activities:Non SNA activities | 37.8 | 42 | 110 | 82.5 | 303 | 368 | 60.4 | 174 | 288 |
| all unpaid activities | 42.4 | 56 | 132 | 82.8 | 330 | 398 | 62.8 | 194 | 309 |
| paid activities | 65.1 | 260 | 400 | 17.4 | 47 | 270 | 41.0 | 152 | 372 |
| all unapid/paid acivities | 76.4 | 316 | 414 | 83.4 | 377 | 452 | 79.9 | 347 | 434 |
| urban | |||||||||
| self maintenance etc | 100.0 | 1113 | 1113 | 100.0 | 1085 | 1085 | 100.0 | 1099 | 1099 |
| unpaid activities: SNA activities | 3.7 | 3 | 83 | 12.6 | 7 | 59 | 8.2 | 5 | 64 |
| unpaid activities:Non SNA activities | 40.0 | 43 | 107 | 80.4 | 280 | 348 | 60.3 | 162 | 269 |
| all unpaid activities | 41.3 | 46 | 111 | 80.7 | 288 | 356 | 61.1 | 167 | 274 |
| paid activities | 61.2 | 281 | 459 | 20.2 | 68 | 334 | 40.6 | 174 | 427 |
| all unapid/paid acivities | 74.8 | 327 | 437 | 83.2 | 355 | 427 | 79.0 | 341 | 431 |
| rural+urban | |||||||||
| self maintenance etc | 100.0 | 1121 | 1121 | 100.0 | 1070 | 1070 | 100.0 | 1095 | 1095 |
| unpaid activities: SNA activities | 8.8 | 11 | 122 | 25.5 | 21 | 81 | 17.2 | 16 | 92 |
| unpaid activities:Non SNA activities | 38.5 | 42 | 109 | 81.9 | 296 | 362 | 60.4 | 170 | 282 |
| all unpaid activities | 42.0 | 53 | 125 | 82.2 | 317 | 386 | 62.3 | 186 | 299 |
| paid activities | 63.9 | 266 | 417 | 18.2 | 53 | 292 | 40.9 | 159 | 389 |
| all unapid/paid acivities | 75.9 | 319 | 420 | 83.4 | 370 | 444 | 79.7 | 345 | 433 |
Note : The activities under ‘self development/ self care/ self maintenance, etc.’ are ‘residual other activities’
Statement 16.1: Percentage of persons and minutes spent in a day on an average per person/per participant of age 6 years and above in unpaid activities, paid activities and other activities where the activity was a major activity (considering only the major activity of the time slots)
| A \& N Islands | |||||||||
|---|---|---|---|---|---|---|---|---|---|
| Activity | male | female | person | ||||||
| percentage of persons | minutes spent on an average in a day per person | minutes spent on an average in a day per participant | percentage of persons | minutes spent on an average in a day per person | minutes spent on an average in a day per participant | percentage of persons | minutes spent on an average in a day per person | minutes spent on an average in a day per participant | |
| $(1)$ | $(2)$ | $(3)$ | $(4)$ | $(5)$ | $(6)$ | $(7)$ | $(8)$ | $(9)$ | $(10)$ |
| rural | |||||||||
| self maintenance etc | 100.0 | 1100 | 1100 | 100.0 | 1056 | 1056 | 100.0 | 1080 | 1080 |
| unpaid activities: SNA activities | 27.9 | 46 | 164 | 31.5 | 47 | 150 | 29.5 | 46 | 157 |
| unpaid activities:Non SNA activities | 31.9 | 41 | 128 | 82.9 | 279 | 337 | 55.4 | 151 | 272 |
| all unpaid activities | 48.2 | 87 | 179 | 84.5 | 326 | 386 | 65.0 | 197 | 303 |
| paid activities | 56.0 | 253 | 452 | 13.7 | 58 | 422 | 36.5 | 163 | 447 |
| all unapid/paid acivities | 74.4 | 340 | 456 | 84.9 | 384 | 453 | 79.3 | 360 | 454 |
| urban | |||||||||
| self maintenance etc | 100.0 | 1152 | 1152 | 100.0 | 1101 | 1101 | 100.0 | 1128 | 1128 |
| unpaid activities: SNA activities | 2.3 | 4 | 153 | 7.8 | 4 | 57 | 4.9 | 4 | 81 |
| unpaid activities:Non SNA activities | 29.2 | 33 | 113 | 74.2 | 252 | 339 | 50.6 | 137 | 271 |
| all unpaid activities | 30.0 | 36 | 121 | 74.2 | 256 | 345 | 51.1 | 141 | 277 |
| paid activities | 50.9 | 251 | 494 | 19.0 | 82 | 433 | 35.7 | 171 | 478 |
| all unapid/paid acivities | 65.1 | 288 | 442 | 75.3 | 339 | 450 | 70.0 | 312 | 446 |
| rural+urban | |||||||||
| self maintenance etc | 100.0 | 1119 | 1119 | 100.0 | 1073 | 1073 | 100.0 | 1098 | 1098 |
| unpaid activities: SNA activities | 18.5 | 30 | 163 | 22.5 | 31 | 137 | 20.4 | 31 | 150 |
| unpaid activities:Non SNA activities | 30.9 | 38 | 123 | 79.6 | 269 | 338 | 53.6 | 146 | 272 |
| all unpaid activities | 41.6 | 68 | 164 | 80.6 | 300 | 372 | 59.8 | 176 | 295 |
| paid activities | 54.1 | 253 | 467 | 15.7 | 67 | 427 | 36.2 | 166 | 459 |
| all unapid/paid acivities | 71.0 | 321 | 451 | 81.3 | 367 | 452 | 75.8 | 342 | 452 |
Note : The activities under ‘self development/ self care/ self maintenance, etc.’ are ‘residual other activities’
Statement 16.1: Percentage of persons and minutes spent in a day on an average per person/per participant of age 6 years and above in unpaid activities, paid activities and other activities where the activity was a major activity (considering only the major activity of the time slots)
| Chandigarh | |||||||||
|---|---|---|---|---|---|---|---|---|---|
| Activity | male | female | person | ||||||
| percentage of persons | minutes spent on an average in a day per person | minutes spent on an average in a day per participant | percentage of persons | minutes spent on an average in a day per person | minutes spent on an average in a day per participant | percentage of persons | minutes spent on an average in a day per person | minutes spent on an average in a day per participant | |
| (1) | (2) | (3) | (4) | (5) | (6) | (7) | (8) | (9) | (10) |
| urban | |||||||||
| self maintenance etc | 100.0 | 1075 | 1075 | 100.0 | 1084 | 1084 | 100.0 | 1079 | 1079 |
| unpaid activities: SNA activities | 0.2 | 0 | 60 | 1.6 | 2 | 123 | 0.9 | 1 | 114 |
| unpaid activities:Non SNA activities | 43.1 | 54 | 126 | 79.9 | 272 | 341 | 60.5 | 158 | 260 |
| all unpaid activities | 43.4 | 55 | 126 | 80.2 | 274 | 342 | 60.8 | 159 | 261 |
| paid activities | 66.1 | 311 | 471 | 22.1 | 82 | 371 | 45.2 | 203 | 448 |
| all unapid/paid acivities | 77.1 | 365 | 474 | 81.4 | 356 | 437 | 79.1 | 361 | 456 |
| rural+urban | |||||||||
| self maintenance etc | 100.0 | 1075 | 1075 | 100.0 | 1084 | 1084 | 100.0 | 1079 | 1079 |
| unpaid activities: SNA activities | 0.2 | 0 | 60 | 1.6 | 2 | 123 | 0.9 | 1 | 114 |
| unpaid activities:Non SNA activities | 43.1 | 54 | 126 | 79.9 | 272 | 341 | 60.5 | 158 | 260 |
| all unpaid activities | 43.4 | 55 | 126 | 80.2 | 274 | 342 | 60.8 | 159 | 261 |
| paid activities | 66.1 | 311 | 471 | 22.1 | 82 | 371 | 45.2 | 203 | 448 |
| all unapid/paid acivities | 77.1 | 365 | 474 | 81.4 | 356 | 437 | 79.1 | 361 | 456 |
Note : The activities under ‘self development/ self care/ self maintenance, etc.’ are ‘residual other activities’
Statement 16.1: Percentage of persons and minutes spent in a day on an average per person/per participant of age 6 years and above in unpaid activities, paid activities and other activities where the activity was a major activity (considering only the major activity of the time slots)
| {Dadra \& Nagar Haveli and Daman \& Diu} | |||||||||
|---|---|---|---|---|---|---|---|---|---|
| Activity | male | female | person | ||||||
| percentage of persons | minutes spent on an average in a day per person | minutes spent on an average in a day per participant | percentage of persons | minutes spent on an average in a day per person | minutes spent on an average in a day per participant | percentage of persons | minutes spent on an average in a day per person | minutes spent on an average in a day per participant | |
| (1) | (2) | (3) | (4) | (5) | (6) | (7) | (8) | (9) | (10) |
| rural | |||||||||
| self maintenance etc | 100.0 | 1089 | 1089 | 100.0 | 1048 | 1048 | 100.0 | 1069 | 1069 |
| unpaid activities: SNA activities | 9.0 | 12 | 139 | 26.8 | 32 | 119 | 17.6 | 22 | 125 |
| unpaid activities:Non SNA activities | 34.4 | 28 | 83 | 82.5 | 214 | 259 | 57.6 | 118 | 204 |
| all unpaid activities | 38.3 | 41 | 107 | 82.5 | 246 | 298 | 59.6 | 140 | 234 |
| paid activities | 57.7 | 310 | 537 | 35.2 | 146 | 415 | 46.9 | 231 | 493 |
| all unapid/paid acivities | 70.1 | 351 | 500 | 84.4 | 392 | 464 | 77.0 | 371 | 481 |
| urban | |||||||||
| self maintenance etc | 100.0 | 967 | 967 | 100.0 | 1035 | 1035 | 100.0 | 995 | 995 |
| unpaid activities: SNA activities | 4.4 | 3 | 68 | 3.1 | 5 | 163 | 4.1 | 4 | 104 |
| unpaid activities:Non SNA activities | 47.0 | 46 | 98 | 82.4 | 243 | 295 | 61.9 | 129 | 208 |
| all unpaid activities | 48.2 | 49 | 102 | 83.3 | 249 | 298 | 63.0 | 133 | 211 |
| paid activities | 72.2 | 424 | 587 | 33.2 | 156 | 470 | 56.0 | 312 | 557 |
| all unapid/paid acivities | 78.7 | 473 | 602 | 83.5 | 405 | 485 | 80.7 | 445 | 551 |
| rural+urban | |||||||||
| self maintenance etc | 100.0 | 1008 | 1008 | 100.0 | 1040 | 1040 | 100.0 | 1022 | 1022 |
| unpaid activities: SNA activities | 6.0 | 6 | 103 | 12.5 | 16 | 126 | 9.0 | 11 | 118 |
| unpaid activities:Non SNA activities | 42.8 | 40 | 94 | 82.4 | 232 | 281 | 60.3 | 125 | 207 |
| all unpaid activities | 44.9 | 46 | 103 | 83.0 | 247 | 298 | 61.8 | 135 | 219 |
| paid activities | 67.4 | 386 | 573 | 34.0 | 152 | 448 | 52.7 | 283 | 537 |
| all unapid/paid acivities | 75.8 | 432 | 570 | 83.9 | 400 | 477 | 79.4 | 418 | 527 |
Note : The activities under ‘self development/ self care/ self maintenance, etc.’ are ‘residual other activities’
Statement 16.1: Percentage of persons and minutes spent in a day on an average per person/per participant of age 6 years and above in unpaid activities, paid activities and other activities where the activity was a major activity (considering only the major activity of the time slots)
| {Jammu \& Kashmir} | |||||||||
|---|---|---|---|---|---|---|---|---|---|
| Activity | male | female | person | ||||||
| percentage of persons | minutes spent on an average in a day per person | minutes spent on an average in a day per participant | percentage of persons | minutes spent on an average in a day per person | minutes spent on an average in a day per participant | percentage of persons | minutes spent on an average in a day per person | minutes spent on an average in a day per participant | |
| (1) | (2) | (3) | (4) | (5) | (6) | (7) | (8) | (9) | (10) |
| rural | |||||||||
| self maintenance etc | 100.0 | 1140 | 1140 | 100.0 | 1085 | 1085 | 100.0 | 1113 | 1113 |
| unpaid activities: SNA activities | 26.1 | 47 | 181 | 37.6 | 47 | 125 | 31.7 | 47 | 149 |
| unpaid activities:Non SNA activities | 30.2 | 30 | 100 | 77.9 | 295 | 379 | 53.3 | 159 | 297 |
| all unpaid activities | 49.7 | 78 | 156 | 79.3 | 342 | 431 | 64.1 | 206 | 321 |
| paid activities | 53.0 | 223 | 420 | 4.2 | 14 | 318 | 29.4 | 121 | 413 |
| all unapid/paid acivities | 73.0 | 300 | 411 | 80.0 | 355 | 444 | 76.4 | 327 | 428 |
| urban | |||||||||
| self maintenance etc | 100.0 | 1118 | 1118 | 100.0 | 1066 | 1066 | 100.0 | 1093 | 1093 |
| unpaid activities: SNA activities | 7.9 | 11 | 141 | 9.5 | 12 | 122 | 8.6 | 11 | 131 |
| unpaid activities:Non SNA activities | 23.8 | 20 | 85 | 80.8 | 308 | 381 | 51.4 | 159 | 310 |
| all unpaid activities | 28.7 | 31 | 110 | 81.0 | 319 | 394 | 54.0 | 171 | 316 |
| paid activities | 63.0 | 291 | 462 | 17.0 | 54 | 318 | 40.7 | 176 | 433 |
| all unapid/paid acivities | 73.3 | 322 | 439 | 81.9 | 374 | 456 | 77.5 | 347 | 448 |
| rural+urban | |||||||||
| self maintenance etc | 100.0 | 1134 | 1134 | 100.0 | 1080 | 1080 | 100.0 | 1108 | 1108 |
| unpaid activities: SNA activities | 21.5 | 38 | 178 | 30.4 | 38 | 125 | 25.8 | 38 | 147 |
| unpaid activities:Non SNA activities | 28.6 | 28 | 97 | 78.6 | 298 | 379 | 52.8 | 159 | 301 |
| all unpaid activities | 44.3 | 66 | 148 | 79.7 | 336 | 422 | 61.5 | 197 | 320 |
| paid activities | 55.6 | 240 | 432 | 7.5 | 24 | 318 | 32.3 | 135 | 419 |
| all unapid/paid acivities | 73.1 | 306 | 419 | 80.4 | 360 | 447 | 76.6 | 332 | 433 |
Note : The activities under ‘self development/ self care/ self maintenance, etc.’ are ‘residual other activities’
Statement 16.1: Percentage of persons and minutes spent in a day on an average per person/per participant of age 6 years and above in unpaid activities, paid activities and other activities where the activity was a major activity (considering only the major activity of the time slots)
| Ladakh | |||||||||
|---|---|---|---|---|---|---|---|---|---|
| Activity | male | female | person | ||||||
| percentage of persons | minutes spent on an average in a day per person | minutes spent on an average in a day per participant | percentage of persons | minutes spent on an average in a day per person | minutes spent on an average in a day per participant | percentage of persons | minutes spent on an average in a day per person | minutes spent on an average in a day per participant | |
| (1) | (2) | (3) | (4) | (5) | (6) | (7) | (8) | (9) | (10) |
| rural | |||||||||
| self maintenance etc | 100.0 | 1125 | 1125 | 100.0 | 1033 | 1033 | 100.0 | 1082 | 1082 |
| unpaid activities: SNA activities | 16.2 | 21 | 129 | 34.5 | 40 | 116 | 24.9 | 30 | 120 |
| unpaid activities:Non SNA activities | 42.8 | 40 | 94 | 84.0 | 349 | 415 | 62.4 | 187 | 300 |
| all unpaid activities | 54.4 | 61 | 112 | 84.7 | 389 | 459 | 68.8 | 217 | 316 |
| paid activities | 62.1 | 253 | 408 | 5.5 | 18 | 325 | 35.2 | 141 | 402 |
| all unapid/paid acivities | 78.0 | 315 | 403 | 85.1 | 407 | 478 | 81.4 | 358 | 441 |
| urban | |||||||||
| self maintenance etc | 100.0 | 1133 | 1133 | 100.0 | 1041 | 1041 | 100.0 | 1091 | 1091 |
| unpaid activities: SNA activities | 3.1 | 4 | 118 | 10.8 | 9 | 83 | 6.6 | 6 | 92 |
| unpaid activities:Non SNA activities | 39.9 | 41 | 104 | 88.1 | 351 | 398 | 62.0 | 183 | 296 |
| all unpaid activities | 40.7 | 45 | 110 | 88.1 | 359 | 408 | 62.4 | 189 | 303 |
| paid activities | 62.3 | 262 | 421 | 11.4 | 40 | 347 | 38.9 | 160 | 411 |
| all unapid/paid acivities | 74.7 | 307 | 411 | 88.3 | 399 | 452 | 81.0 | 349 | 431 |
| rural+urban | |||||||||
| self maintenance etc | 100.0 | 1126 | 1126 | 100.0 | 1034 | 1034 | 100.0 | 1083 | 1083 |
| unpaid activities: SNA activities | 14.7 | 19 | 128 | 31.9 | 37 | 115 | 22.8 | 27 | 120 |
| unpaid activities:Non SNA activities | 42.4 | 41 | 95 | 84.4 | 349 | 413 | 62.3 | 187 | 299 |
| all unpaid activities | 52.8 | 59 | 112 | 85.0 | 386 | 454 | 68.1 | 214 | 314 |
| paid activities | 62.1 | 254 | 409 | 6.1 | 20 | 330 | 35.6 | 143 | 403 |
| all unapid/paid acivities | 77.6 | 314 | 404 | 85.5 | 406 | 475 | 81.3 | 357 | 439 |
Note : The activities under ‘self development/ self care/ self maintenance, etc.’ are ‘residual other activities’
Statement 16.1: Percentage of persons and minutes spent in a day on an average per person/per participant of age 6 years and above in unpaid activities, paid activities and other activities where the activity was a major activity (considering only the major activity of the time slots)
| Lakshadweep | |||||||||
|---|---|---|---|---|---|---|---|---|---|
| Activity | male | female | person | ||||||
| percentage of persons | minutes spent on an average in a day per person | minutes spent on an average in a day per participant | percentage of persons | minutes spent on an average in a day per person | minutes spent on an average in a day per participant | percentage of persons | minutes spent on an average in a day per person | minutes spent on an average in a day per participant | |
| $(1)$ | $(2)$ | $(3)$ | $(4)$ | $(5)$ | $(6)$ | $(7)$ | $(8)$ | $(9)$ | $(10)$ |
| rural | |||||||||
| self maintenance etc | 100.0 | 1158 | 1158 | 100.0 | 1095 | 1095 | 100.0 | 1124 | 1124 |
| unpaid activities: SNA activities | 14.2 | 23 | 160 | 12.8 | 10 | 79 | 13.5 | 16 | 119 |
| unpaid activities:Non SNA activities | 41.5 | 40 | 97 | 87.1 | 296 | 340 | 65.7 | 176 | 268 |
| all unpaid activities | 47.0 | 63 | 134 | 87.1 | 307 | 352 | 68.2 | 192 | 281 |
| paid activities | 52.4 | 219 | 419 | 14.2 | 39 | 275 | 32.2 | 124 | 385 |
| all unapid/paid acivities | 77.6 | 282 | 364 | 88.3 | 345 | 391 | 83.3 | 316 | 379 |
| urban | |||||||||
| self maintenance etc | 100.0 | 1161 | 1161 | 100.0 | 1093 | 1093 | 100.0 | 1123 | 1123 |
| unpaid activities: SNA activities | 13.7 | 17 | 127 | 9.2 | 8 | 89 | 11.3 | 12 | 110 |
| unpaid activities:Non SNA activities | 44.2 | 51 | 115 | 85.1 | 297 | 350 | 66.8 | 187 | 280 |
| all unpaid activities | 51.5 | 68 | 132 | 85.1 | 306 | 359 | 70.1 | 200 | 285 |
| paid activities | 51.3 | 210 | 410 | 14.5 | 42 | 288 | 31.0 | 117 | 378 |
| all unapid/paid acivities | 76.9 | 279 | 362 | 85.1 | 347 | 408 | 81.4 | 317 | 389 |
| rural+urban | |||||||||
| self maintenance etc | 100.0 | 1160 | 1160 | 100.0 | 1093 | 1093 | 100.0 | 1123 | 1123 |
| unpaid activities: SNA activities | 13.8 | 19 | 134 | 9.9 | 9 | 87 | 11.7 | 13 | 112 |
| unpaid activities:Non SNA activities | 43.6 | 49 | 111 | 85.5 | 297 | 348 | 66.6 | 185 | 278 |
| all unpaid activities | 50.6 | 67 | 133 | 85.5 | 306 | 358 | 69.7 | 198 | 284 |
| paid activities | 51.6 | 212 | 412 | 14.4 | 41 | 285 | 31.2 | 119 | 380 |
| all unapid/paid acivities | 77.0 | 280 | 363 | 85.7 | 347 | 405 | 81.8 | 317 | 387 |
Note : The activities under ‘self development/ self care/ self maintenance, etc.’ are ‘residual other activities’
Statement 16.1: Percentage of persons and minutes spent in a day on an average per person/per participant of age 6 years and above in unpaid activities, paid activities and other activities where the activity was a major activity (considering only the major activity of the time slots)
| Puducherry | |||||||||
|---|---|---|---|---|---|---|---|---|---|
| Activity | male | female | person | ||||||
| percentage of persons | minutes spent on an average in a day per person | minutes spent on an average in a day per participant | percentage of persons | minutes spent on an average in a day per person | minutes spent on an average in a day per participant | percentage of persons | minutes spent on an average in a day per person | minutes spent on an average in a day per participant | |
| (1) | (2) | (3) | (4) | (5) | (6) | (7) | (8) | (9) | (10) |
| rural | |||||||||
| self maintenance etc | 100.0 | 1070 | 1070 | 100.0 | 1024 | 1024 | 100.0 | 1046 | 1046 |
| unpaid activities: SNA activities | 11.7 | 7 | 61 | 20.9 | 12 | 57 | 16.5 | 10 | 59 |
| unpaid activities:Non SNA activities | 57.1 | 72 | 126 | 88.6 | 299 | 338 | 73.5 | 190 | 259 |
| all unpaid activities | 60.0 | 79 | 132 | 89.0 | 311 | 350 | 75.1 | 200 | 267 |
| paid activities | 60.4 | 291 | 482 | 26.1 | 105 | 401 | 42.5 | 194 | 456 |
| all unapid/paid acivities | 80.6 | 370 | 459 | 90.0 | 416 | 462 | 85.5 | 394 | 461 |
| urban | |||||||||
| self maintenance etc | 100.0 | 1124 | 1124 | 100.0 | 1077 | 1077 | 100.0 | 1098 | 1098 |
| unpaid activities: SNA activities | 9.0 | 5 | 57 | 15.0 | 9 | 58 | 12.3 | 7 | 58 |
| unpaid activities:Non SNA activities | 46.8 | 61 | 131 | 83.8 | 276 | 330 | 67.0 | 178 | 267 |
| all unpaid activities | 49.4 | 66 | 134 | 83.8 | 285 | 340 | 68.1 | 186 | 272 |
| paid activities | 51.0 | 250 | 490 | 19.6 | 78 | 397 | 33.9 | 156 | 461 |
| all unapid/paid acivities | 75.8 | 316 | 417 | 85.2 | 363 | 426 | 80.9 | 342 | 422 |
| rural+urban | |||||||||
| self maintenance etc | 100.0 | 1106 | 1106 | 100.0 | 1060 | 1060 | 100.0 | 1081 | 1081 |
| unpaid activities: SNA activities | 9.9 | 6 | 59 | 16.9 | 10 | 58 | 13.7 | 8 | 58 |
| unpaid activities:Non SNA activities | 50.3 | 65 | 129 | 85.3 | 284 | 332 | 69.1 | 182 | 264 |
| all unpaid activities | 53.0 | 71 | 133 | 85.4 | 293 | 343 | 70.4 | 190 | 270 |
| paid activities | 54.2 | 264 | 487 | 21.7 | 87 | 399 | 36.7 | 169 | 459 |
| all unapid/paid acivities | 77.5 | 334 | 432 | 86.7 | 380 | 438 | 82.5 | 359 | 435 |
Note : The activities under ‘self development/ self care/ self maintenance, etc.’ are ‘residual other activities’
Statement 16.1: Percentage of persons and minutes spent in a day on an average per person/per participant of age 6 years and above in unpaid activities, paid activities and other activities where the activity was a major activity (considering only the major activity of the time slots)
| All India | |||||||||
|---|---|---|---|---|---|---|---|---|---|
| Activity | male | female | person | ||||||
| percentage of persons | minutes spent on an average in a day per person | minutes spent on an average in a day per participant | percentage of persons | minutes spent on an average in a day per person | minutes spent on an average in a day per participant | percentage of persons | minutes spent on an average in a day per person | minutes spent on an average in a day per participant | |
| (1) | (2) | (3) | (4) | (5) | (6) | (7) | (8) | (9) | (10) |
| rural | |||||||||
| self maintenance etc | 100.0 | 1131 | 1131 | 100.0 | 1052 | 1052 | 100.0 | 1091 | 1091 |
| unpaid activities: SNA activities | 17.1 | 25 | 149 | 25.0 | 29 | 117 | 21.1 | 27 | 130 |
| unpaid activities:Non SNA activities | 36.2 | 38 | 106 | 83.2 | 294 | 354 | 59.8 | 167 | 279 |
| all unpaid activities | 45.0 | 64 | 141 | 83.9 | 323 | 385 | 64.5 | 194 | 301 |
| paid activities | 60.1 | 245 | 408 | 21.7 | 65 | 299 | 40.8 | 155 | 379 |
| all unapid/paid acivities | 73.8 | 309 | 418 | 84.6 | 388 | 459 | 79.3 | 349 | 440 |
| urban | |||||||||
| self maintenance etc | 100.0 | 1108 | 1108 | 100.0 | 1082 | 1082 | 100.0 | 1095 | 1095 |
| unpaid activities: SNA activities | 3.5 | 3 | 95 | 8.7 | 6 | 64 | 6.0 | 4 | 74 |
| unpaid activities:Non SNA activities | 38.0 | 40 | 104 | 82.0 | 287 | 351 | 59.4 | 160 | 269 |
| all unpaid activities | 39.6 | 43 | 109 | 82.1 | 293 | 357 | 60.2 | 164 | 273 |
| paid activities | 61.1 | 290 | 474 | 18.0 | 65 | 364 | 40.2 | 181 | 450 |
| all unapid/paid acivities | 73.9 | 332 | 450 | 83.7 | 358 | 428 | 78.7 | 345 | 439 |
| rural+urban | |||||||||
| self maintenance etc | 100.0 | 1124 | 1124 | 100.0 | 1061 | 1061 | 100.0 | 1093 | 1093 |
| unpaid activities: SNA activities | 12.8 | 18 | 145 | 20.1 | 22 | 110 | 16.4 | 20 | 123 |
| unpaid activities:Non SNA activities | 36.8 | 39 | 105 | 82.8 | 292 | 353 | 59.6 | 165 | 276 |
| all unpaid activities | 43.3 | 57 | 132 | 83.3 | 314 | 377 | 63.2 | 185 | 292 |
| paid activities | 60.4 | 259 | 429 | 20.6 | 65 | 316 | 40.6 | 163 | 401 |
| all unapid/paid acivities | 73.9 | 316 | 428 | 84.4 | 379 | 449 | 79.1 | 347 | 439 |
Note : The activities under ‘self development/ self care/ self maintenance, etc.’ are ‘residual other activities’
Statement 17.1: Percentage of persons and minutes spent in a day on an average per person/per participant of age 6 years and above in unpaid activities paid activities and other activities irrespective of whether the activity was a major activity or not (considering all the activities in a time slot)
| Andhra Pradesh | |||||||||
|---|---|---|---|---|---|---|---|---|---|
| Activity | male | female | person | ||||||
| percentage of persons | minutes spent on an average in a day per person | minutes spent on an average in a day per participant | percentage of persons | minutes spent on an average in a day per person | minutes spent on an average in a day per participant | percentage of persons | minutes spent on an average in a day per person | minutes spent on an average in a day per participant | |
| (1) | (2) | (3) | (4) | (5) | (6) | (7) | (8) | (9) | (10) |
| rural | |||||||||
| self maintenance etc | 100.0 | 1128 | 1128 | 100.0 | 1057 | 1057 | 100.0 | 1092 | 1092 |
| unpaid activities: SNA activities | 10.8 | 8 | 78 | 16.6 | 10 | 62 | 13.7 | 9 | 68 |
| unpaid activities:Non SNA activities | 28.3 | 25 | 87 | 86.6 | 249 | 287 | 57.8 | 138 | 239 |
| all unpaid activities | 35.0 | 33 | 94 | 87.0 | 259 | 298 | 61.3 | 147 | 240 |
| paid activities | 65.5 | 279 | 426 | 35.5 | 124 | 349 | 50.3 | 201 | 399 |
| all unapid/paid acivities | 74.1 | 312 | 422 | 88.2 | 383 | 434 | 81.2 | 348 | 428 |
| urban | |||||||||
| self maintenance etc | 100.0 | 1152 | 1152 | 100.0 | 1098 | 1098 | 100.0 | 1125 | 1125 |
| unpaid activities: SNA activities | 4.5 | 2 | 48 | 15.3 | 7 | 44 | 9.9 | 4 | 45 |
| unpaid activities:Non SNA activities | 33.5 | 31 | 94 | 82.3 | 264 | 321 | 57.9 | 148 | 256 |
| all unpaid activities | 35.7 | 34 | 94 | 82.5 | 271 | 329 | 59.1 | 152 | 258 |
| paid activities | 57.5 | 255 | 443 | 20.4 | 71 | 350 | 38.9 | 163 | 419 |
| all unapid/paid acivities | 69.6 | 288 | 415 | 83.7 | 342 | 409 | 76.6 | 315 | 412 |
| rural+urban | |||||||||
| self maintenance etc | 100.0 | 1136 | 1136 | 100.0 | 1070 | 1070 | 100.0 | 1103 | 1103 |
| unpaid activities: SNA activities | 8.7 | 6 | 73 | 16.2 | 9 | 57 | 12.5 | 8 | 62 |
| unpaid activities:Non SNA activities | 30.0 | 27 | 90 | 85.2 | 254 | 298 | 57.8 | 141 | 244 |
| all unpaid activities | 35.2 | 33 | 94 | 85.5 | 263 | 307 | 60.6 | 149 | 246 |
| paid activities | 62.8 | 271 | 431 | 30.6 | 107 | 350 | 46.6 | 188 | 404 |
| all unapid/paid acivities | 72.6 | 304 | 419 | 86.8 | 370 | 426 | 79.7 | 337 | 423 |
Note : The activities under ‘self development/ self care/ self maintenance, etc.’ are ‘residual other activities’
Statement 17.1: Percentage of persons and minutes spent in a day on an average per person/per participant of age 6 years and above in unpaid activities paid activities and other activities irrespective of whether the activity was a major activity or not (considering all the activities in a time slot)
| Arunachal Pradesh | |||||||||
|---|---|---|---|---|---|---|---|---|---|
| Activity | male | female | person | ||||||
| percentage of persons | minutes spent on an average in a day per person | minutes spent on an average in a day per participant | percentage of persons | minutes spent on an average in a day per person | minutes spent on an average in a day per participant | percentage of persons | minutes spent on an average in a day per person | minutes spent on an average in a day per participant | |
| (1) | (2) | (3) | (4) | (5) | (6) | (7) | (8) | (9) | (10) |
| rural | |||||||||
| self maintenance etc | 100.0 | 1096 | 1096 | 100.0 | 936 | 936 | 100.0 | 1019 | 1019 |
| unpaid activities: SNA activities | 29.1 | 38 | 132 | 55.2 | 89 | 162 | 41.7 | 63 | 151 |
| unpaid activities:Non SNA activities | 66.4 | 80 | 120 | 90.2 | 384 | 426 | 77.9 | 227 | 292 |
| all unpaid activities | 72.6 | 118 | 163 | 90.6 | 474 | 523 | 81.3 | 290 | 357 |
| paid activities | 69.0 | 226 | 327 | 11.6 | 30 | 260 | 41.2 | 131 | 318 |
| all unapid/paid acivities | 83.4 | 344 | 412 | 90.9 | 504 | 554 | 87.0 | 421 | 484 |
| urban | |||||||||
| self maintenance etc | 100.0 | 1129 | 1129 | 100.0 | 970 | 970 | 100.0 | 1055 | 1055 |
| unpaid activities: SNA activities | 6.3 | 7 | 105 | 23.8 | 23 | 99 | 14.5 | 14 | 100 |
| unpaid activities:Non SNA activities | 62.4 | 70 | 112 | 91.9 | 401 | 437 | 76.2 | 225 | 295 |
| all unpaid activities | 63.6 | 77 | 120 | 91.9 | 425 | 462 | 76.8 | 239 | 311 |
| paid activities | 63.2 | 234 | 370 | 14.1 | 45 | 320 | 40.3 | 146 | 362 |
| all unapid/paid acivities | 81.0 | 311 | 384 | 92.6 | 470 | 507 | 86.4 | 385 | 446 |
| rural+urban | |||||||||
| self maintenance etc | 100.0 | 1103 | 1103 | 100.0 | 943 | 943 | 100.0 | 1026 | 1026 |
| unpaid activities: SNA activities | 24.3 | 32 | 130 | 49.0 | 76 | 156 | 36.2 | 53 | 147 |
| unpaid activities:Non SNA activities | 65.5 | 78 | 119 | 90.5 | 388 | 428 | 77.5 | 227 | 293 |
| all unpaid activities | 70.7 | 109 | 155 | 90.9 | 464 | 511 | 80.4 | 280 | 348 |
| paid activities | 67.8 | 227 | 335 | 12.1 | 33 | 274 | 41.0 | 134 | 327 |
| all unapid/paid acivities | 82.9 | 337 | 406 | 91.2 | 497 | 545 | 86.9 | 414 | 476 |
Note : The activities under ‘self development’ self care/ self maintenance, etc.’ are ‘residual other activities’
Statement 17.1: Percentage of persons and minutes spent in a day on an average per person/per participant of age 6 years and above in unpaid activities , paid activities and other activities irrespective of whether the activity was a major activity or not (considering all the activities in a time slot)
| Assam | |||||||||
|---|---|---|---|---|---|---|---|---|---|
| Activity | male | female | person | ||||||
| percentage of persons | minutes spent on an average in a day per person | minutes spent on an average in a day per participant | percentage of persons | minutes spent on an average in a day per person | minutes spent on an average in a day per participant | percentage of persons | minutes spent on an average in a day per person | minutes spent on an average in a day per participant | |
| (1) | (2) | (3) | (4) | (5) | (6) | (7) | (8) | (9) | (10) |
| rura | |||||||||
| self maintenance etc | 100.0 | 1130 | 1130 | 100.0 | 1071 | 1071 | 100.0 | 1101 | 1101 |
| unpaid activities: SNA activities | 17.3 | 14 | 81 | 27.4 | 22 | 80 | 22.3 | 18 | 80 |
| unpaid activities:Non SNA activities | 48.3 | 47 | 98 | 82.2 | 312 | 380 | 65.1 | 178 | 274 |
| all unpaid activities | 53.9 | 61 | 114 | 82.7 | 334 | 404 | 68.2 | 196 | 288 |
| paid activities | 63.8 | 249 | 390 | 12.8 | 35 | 272 | 38.5 | 143 | 371 |
| all unapid/paid acivities | 75.8 | 310 | 409 | 83.0 | 369 | 444 | 79.4 | 339 | 428 |
| urban | |||||||||
| self maintenance etc | 100.0 | 1128 | 1128 | 100.0 | 1088 | 1088 | 100.0 | 1109 | 1109 |
| unpaid activities: SNA activities | 4.6 | 3 | 71 | 8.5 | 6 | 75 | 6.4 | 5 | 73 |
| unpaid activities:Non SNA activities | 50.6 | 54 | 106 | 82.5 | 301 | 364 | 65.5 | 168 | 257 |
| all unpaid activities | 51.7 | 57 | 110 | 82.7 | 307 | 371 | 66.2 | 173 | 262 |
| paid activities | 59.5 | 256 | 430 | 13.1 | 45 | 342 | 37.9 | 158 | 416 |
| all unapid/paid acivities | 74.7 | 312 | 419 | 83.6 | 352 | 421 | 78.9 | 331 | 419 |
| rural+urban | |||||||||
| self maintenance etc | 100.0 | 1129 | 1129 | 100.0 | 1073 | 1073 | 100.0 | 1102 | 1102 |
| unpaid activities: SNA activities | 15.8 | 13 | 80 | 25.4 | 20 | 80 | 20.5 | 16 | 80 |
| unpaid activities:Non SNA activities | 48.6 | 48 | 99 | 82.2 | 311 | 378 | 65.1 | 177 | 272 |
| all unpaid activities | 53.6 | 61 | 113 | 82.7 | 331 | 400 | 67.9 | 194 | 285 |
| paid activities | 63.3 | 250 | 395 | 12.8 | 36 | 280 | 38.5 | 145 | 376 |
| all unapid/paid acivities | 75.6 | 311 | 411 | 83.1 | 367 | 442 | 79.3 | 338 | 427 |
Note : The activities under ‘self development/ self care/ self maintenance, etc.’ are ‘residual other activities’
Statement 17.1: Percentage of persons and minutes spent in a day on an average per person/per participant of age 6 years and above in unpaid activities , paid activities and other activities irrespective of whether the activity was a major activity or not (considering all the activities in a time slot)
| Bihar | female | person | |||||||
| Activity | percentage of persons | minutes spent on an average in a day per person | minutes spent on an average in a day per participant | percentage of persons | minutes spent on an average in a day per person | minutes spent on an average in a day per participant | percentage of persons | minutes spent on an average in a day per person | minutes spent on an average in a day per participant |
| (1) | (2) | (3) | (4) | (5) | (6) | (7) | (8) | (9) | (10) |
| rura | |||||||||
| self maintenance etc | 100.0 | 1169 | 1169 | 100.0 | 1091 | 1091 | 100.0 | 1130 | 1130 |
| unpaid activities: SNA activities | 14.5 | 22 | 152 | 15.1 | 18 | 119 | 14.8 | 20 | 136 |
| unpaid activities:Non SNA activities | 40.4 | 41 | 102 | 79.3 | 307 | 387 | 59.8 | 174 | 291 |
| all unpaid activities | 47.1 | 63 | 135 | 79.7 | 325 | 408 | 63.3 | 194 | 306 |
| paid activities | 54.4 | 207 | 382 | 10.8 | 24 | 221 | 32.7 | 116 | 355 |
| all unapid/paid acivities | 67.1 | 271 | 404 | 80.0 | 349 | 437 | 73.5 | 310 | 421 |
| urban | |||||||||
| self maintenance etc | 100.0 | 1149 | 1149 | 100.0 | 1105 | 1105 | 100.0 | 1128 | 1128 |
| unpaid activities: SNA activities | 2.6 | 4 | 157 | 4.7 | 4 | 85 | 3.6 | 4 | 112 |
| unpaid activities:Non SNA activities | 41.9 | 44 | 106 | 80.1 | 305 | 380 | 60.1 | 168 | 280 |
| all unpaid activities | 43.2 | 48 | 112 | 80.2 | 309 | 385 | 60.8 | 172 | 283 |
| paid activities | 54.3 | 242 | 446 | 8.5 | 26 | 308 | 32.5 | 140 | 429 |
| all unapid/paid acivities | 69.7 | 291 | 417 | 80.9 | 335 | 414 | 75.1 | 312 | 415 |
| rural+urban | |||||||||
| self maintenance etc | 100.0 | 1167 | 1167 | 100.0 | 1092 | 1092 | 100.0 | 1130 | 1130 |
| unpaid activities: SNA activities | 13.1 | 20 | 153 | 14.0 | 17 | 118 | 13.6 | 18 | 135 |
| unpaid activities:Non SNA activities | 40.6 | 42 | 102 | 79.4 | 307 | 386 | 59.9 | 173 | 289 |
| all unpaid activities | 46.7 | 62 | 132 | 79.7 | 323 | 406 | 63.1 | 192 | 304 |
| paid activities | 54.4 | 211 | 389 | 10.6 | 24 | 229 | 32.6 | 119 | 363 |
| all unapid/paid acivities | 67.4 | 273 | 405 | 80.1 | 348 | 434 | 73.7 | 310 | 421 |
Note : The activities under ‘self development’ self care/ self maintenance, etc.’ are ‘residual other activities’
Statement 17.1: Percentage of persons and minutes spent in a day on an average per person/per participant of age 6 years and above in unpaid activities paid activities and other activities irrespective of whether the activity was a major activity or not (considering all the activities in a time slot)
| Sch | male | female | person | ||||||
|---|---|---|---|---|---|---|---|---|---|
| percentage of persons | minutes spent on an average in a day per person | minutes spent on an average in a day per participant | percentage of persons | minutes spent on an average in a day per person | minutes spent on an average in a day per participant | percentage of persons | minutes spent on an average in a day per person | minutes spent on an average in a day per participant | |
| $(1)$ | $(2)$ | $(3)$ | $(4)$ | $(5)$ | $(6)$ | $(7)$ | $(8)$ | $(9)$ | $(10)$ |
| rural | |||||||||
| self maintenance etc | 100.0 | 1125 | 1125 | 100.0 | 1064 | 1064 | 100.0 | 1094 | 1094 |
| unpaid activities: SNA activities | 20.6 | 51 | 247 | 29.3 | 34 | 116 | 25.0 | 42 | 170 |
| unpaid activities:Non SNA activities | 37.4 | 40 | 106 | 82.5 | 243 | 295 | 60.1 | 142 | 236 |
| all unpaid activities | 47.2 | 91 | 192 | 83.5 | 277 | 332 | 65.5 | 185 | 282 |
| paid activities | 55.9 | 224 | 401 | 30.6 | 99 | 323 | 43.2 | 161 | 373 |
| all unapid/paid acivities | 75.3 | 315 | 418 | 84.4 | 376 | 445 | 79.9 | 346 | 433 |
| urban | |||||||||
| self maintenance etc | 100.0 | 1117 | 1117 | 100.0 | 1116 | 1116 | 100.0 | 1117 | 1117 |
| unpaid activities: SNA activities | 3.4 | 3 | 98 | 12.4 | 7 | 55 | 7.9 | 5 | 64 |
| unpaid activities:Non SNA activities | 34.9 | 36 | 103 | 77.2 | 237 | 307 | 56.0 | 137 | 244 |
| all unpaid activities | 36.2 | 39 | 108 | 77.5 | 244 | 315 | 56.8 | 142 | 249 |
| paid activities | 59.5 | 284 | 477 | 22.9 | 80 | 349 | 41.2 | 182 | 441 |
| all unapid/paid acivities | 71.3 | 323 | 453 | 79.3 | 324 | 408 | 75.3 | 323 | 429 |
| rural+urban | |||||||||
| self maintenance etc | 100.0 | 1123 | 1123 | 100.0 | 1076 | 1076 | 100.0 | 1099 | 1099 |
| unpaid activities: SNA activities | 16.7 | 40 | 240 | 25.6 | 28 | 110 | 21.2 | 34 | 161 |
| unpaid activities:Non SNA activities | 36.8 | 39 | 105 | 81.3 | 242 | 297 | 59.2 | 141 | 238 |
| all unpaid activities | 44.7 | 79 | 177 | 82.1 | 270 | 328 | 63.5 | 175 | 275 |
| paid activities | 56.7 | 238 | 419 | 28.9 | 95 | 328 | 42.7 | 166 | 388 |
| all unapid/paid acivities | 74.4 | 317 | 426 | 83.3 | 364 | 438 | 78.9 | 341 | 432 |
Note : The activities under ‘self development’ self care/ self maintenance, etc.’ are ‘residual other activities’
Statement 17.1: Percentage of persons and minutes spent in a day on an average per person/per participant of age 6 years and above in unpaid activities , paid activities and other activities irrespective of whether the activity was a major activity or not (considering all the activities in a time slot)
| male | female | person | |||||||
|---|---|---|---|---|---|---|---|---|---|
| Activity | percentage of persons | minutes spent on an average in a day per person | minutes spent on an average in a day per participant | percentage of persons | minutes spent on an average in a day per person | minutes spent on an average in a day per participant | percentage of persons | minutes spent on an average in a day per person | minutes spent on an average in a day per participant |
| (1) | (2) | (3) | (4) | (5) | (6) | (7) | (8) | (9) | (10) |
| rural | |||||||||
| self maintenance etc | 100.0 | 948 | 948 | 100.0 | 988 | 988 | 100.0 | 964 | 964 |
| unpaid activities: SNA activities | 0.0 | 0 | 0 | 0.0 | 0 | 0 | 0.0 | 0 | 0 |
| unpaid activities:Non SNA activities | 61.1 | 86 | 141 | 86.2 | 383 | 444 | 71.3 | 207 | 290 |
| all unpaid activities | 61.1 | 86 | 141 | 86.2 | 383 | 444 | 71.3 | 207 | 290 |
| paid activities | 78.7 | 406 | 516 | 14.8 | 69 | 469 | 52.7 | 269 | 511 |
| all unapid/paid acivities | 82.7 | 492 | 595 | 86.2 | 452 | 525 | 84.2 | 476 | 566 |
| urban | |||||||||
| self maintenance etc | 100.0 | 1039 | 1039 | 100.0 | 1077 | 1077 | 100.0 | 1055 | 1055 |
| unpaid activities: SNA activities | 0.2 | 0 | 239 | 0.4 | 1 | 132 | 0.3 | 0 | 172 |
| unpaid activities:Non SNA activities | 47.0 | 47 | 100 | 80.9 | 316 | 391 | 61.9 | 165 | 267 |
| all unpaid activities | 47.1 | 48 | 101 | 80.9 | 317 | 392 | 61.9 | 166 | 268 |
| paid activities | 69.4 | 354 | 509 | 11.2 | 46 | 411 | 43.9 | 219 | 498 |
| all unapid/paid acivities | 77.6 | 401 | 517 | 81.9 | 363 | 443 | 79.5 | 385 | 484 |
| rural+urban | |||||||||
| self maintenance etc | 100.0 | 1034 | 1034 | 100.0 | 1073 | 1073 | 100.0 | 1051 | 1051 |
| unpaid activities: SNA activities | 0.2 | 0 | 239 | 0.4 | 0 | 132 | 0.3 | 0 | 172 |
| unpaid activities:Non SNA activities | 47.8 | 49 | 103 | 81.2 | 320 | 394 | 62.4 | 168 | 269 |
| all unpaid activities | 47.8 | 50 | 104 | 81.2 | 320 | 394 | 62.4 | 168 | 269 |
| paid activities | 69.9 | 357 | 510 | 11.4 | 47 | 414 | 44.3 | 221 | 499 |
| all unapid/paid acivities | 77.9 | 406 | 522 | 82.1 | 367 | 447 | 79.7 | 389 | 488 |
Note : The activities under ‘self development/ self care/ self maintenance, etc.’ are ‘residual other activities’
Statement 17.1: Percentage of persons and minutes spent in a day on an average per person/per participant of age 6 years and above in unpaid activities paid activities and other activities irrespective of whether the activity was a major activity or not (considering all the activities in a time slot)
| Goa | |||||||||
|---|---|---|---|---|---|---|---|---|---|
| Activity | male | female | person | ||||||
| percentage of persons | minutes spent on an average in a day per person | minutes spent on an average in a day per participant | percentage of persons | minutes spent on an average in a day per person | minutes spent on an average in a day per participant | percentage of persons | minutes spent on an average in a day per person | minutes spent on an average in a day per participant | |
| (1) | (2) | (3) | (4) | (5) | (6) | (7) | (8) | (9) | (10) |
| rural | |||||||||
| self maintenance etc | 100.0 | 1113 | 1113 | 100.0 | 1106 | 1106 | 100.0 | 1110 | 1110 |
| unpaid activities: SNA activities | 7.0 | 13 | 191 | 9.6 | 14 | 148 | 8.3 | 14 | 165 |
| unpaid activities:Non SNA activities | 35.5 | 37 | 103 | 76.5 | 233 | 305 | 56.5 | 138 | 244 |
| all unpaid activities | 39.1 | 50 | 128 | 77.6 | 248 | 319 | 58.9 | 151 | 257 |
| paid activities | 58.7 | 277 | 471 | 19.7 | 87 | 439 | 38.7 | 179 | 463 |
| all unapid/paid acivities | 80.8 | 327 | 404 | 86.9 | 334 | 385 | 83.9 | 330 | 394 |
| urban | |||||||||
| self maintenance etc | 100.0 | 1086 | 1086 | 100.0 | 1108 | 1108 | 100.0 | 1097 | 1097 |
| unpaid activities: SNA activities | 4.3 | 5 | 115 | 3.0 | 2 | 68 | 3.7 | 4 | 96 |
| unpaid activities:Non SNA activities | 38.8 | 31 | 79 | 66.3 | 208 | 313 | 52.3 | 117 | 225 |
| all unpaid activities | 40.1 | 36 | 89 | 66.3 | 210 | 316 | 52.9 | 121 | 229 |
| paid activities | 66.6 | 318 | 477 | 27.4 | 122 | 446 | 47.4 | 222 | 468 |
| all unapid/paid acivities | 78.1 | 354 | 453 | 81.9 | 332 | 405 | 80.0 | 343 | 429 |
| rural+urban | |||||||||
| self maintenance etc | 100.0 | 1097 | 1097 | 100.0 | 1107 | 1107 | 100.0 | 1102 | 1102 |
| unpaid activities: SNA activities | 5.3 | 8 | 152 | 5.7 | 7 | 122 | 5.5 | 8 | 137 |
| unpaid activities:Non SNA activities | 37.6 | 33 | 88 | 70.4 | 218 | 310 | 53.9 | 125 | 232 |
| all unpaid activities | 39.7 | 41 | 104 | 70.8 | 225 | 318 | 55.2 | 133 | 241 |
| paid activities | 63.6 | 302 | 475 | 24.3 | 108 | 443 | 44.0 | 205 | 466 |
| all unapid/paid acivities | 79.1 | 343 | 434 | 83.9 | 333 | 397 | 81.5 | 338 | 415 |
Note : The activities under ‘self development/ self care/ self maintenance, etc.’ are ‘residual other activities’
Statement 17.1: Percentage of persons and minutes spent in a day on an average per person/per participant of age 6 years and above in unpaid activities paid activities and other activities irrespective of whether the activity was a major activity or not (considering all the activities in a time slot)
| Gujarat | |||||||||
|---|---|---|---|---|---|---|---|---|---|
| Activity | male | female | person | ||||||
| percentage of persons | minutes spent on an average in a day per person | minutes spent on an average in a day per participant | percentage of persons | minutes spent on an average in a day per person | minutes spent on an average in a day per participant | percentage of persons | minutes spent on an average in a day per person | minutes spent on an average in a day per participant | |
| (1) | (2) | (3) | (4) | (5) | (6) | (7) | (8) | (9) | (10) |
| rura | |||||||||
| self maintenance etc | 100.0 | 1143 | 1143 | 100.0 | 1043 | 1043 | 100.0 | 1094 | 1094 |
| unpaid activities: SNA activities | 7.3 | 11 | 149 | 22.1 | 18 | 81 | 14.6 | 14 | 98 |
| unpaid activities:Non SNA activities | 25.7 | 22 | 86 | 85.6 | 290 | 339 | 55.1 | 154 | 279 |
| all unpaid activities | 30.6 | 33 | 107 | 85.8 | 308 | 359 | 57.7 | 168 | 291 |
| paid activities | 69.0 | 264 | 383 | 32.8 | 89 | 273 | 51.2 | 178 | 348 |
| all unapid/paid acivities | 76.3 | 297 | 389 | 87.4 | 397 | 455 | 81.8 | 346 | 424 |
| urban | |||||||||
| self maintenance etc | 100.0 | 1103 | 1103 | 100.0 | 1077 | 1077 | 100.0 | 1091 | 1091 |
| unpaid activities: SNA activities | 1.2 | 1 | 74 | 8.3 | 3 | 41 | 4.6 | 2 | 46 |
| unpaid activities:Non SNA activities | 32.6 | 30 | 93 | 84.9 | 294 | 346 | 57.2 | 155 | 270 |
| all unpaid activities | 33.1 | 31 | 94 | 85.0 | 298 | 350 | 57.5 | 157 | 272 |
| paid activities | 64.3 | 306 | 475 | 19.4 | 65 | 335 | 43.2 | 192 | 446 |
| all unapid/paid acivities | 73.2 | 337 | 461 | 86.3 | 363 | 420 | 79.4 | 349 | 440 |
| rural+urban | |||||||||
| self maintenance etc | 100.0 | 1125 | 1125 | 100.0 | 1058 | 1058 | 100.0 | 1092 | 1092 |
| unpaid activities: SNA activities | 4.5 | 6 | 139 | 16.2 | 12 | 72 | 10.1 | 9 | 88 |
| unpaid activities:Non SNA activities | 28.8 | 26 | 89 | 85.3 | 292 | 342 | 56.1 | 154 | 275 |
| all unpaid activities | 31.7 | 32 | 101 | 85.4 | 303 | 355 | 57.6 | 163 | 283 |
| paid activities | 66.9 | 283 | 423 | 27.0 | 79 | 292 | 47.7 | 185 | 387 |
| all unapid/paid acivities | 74.9 | 315 | 421 | 86.9 | 382 | 440 | 80.7 | 348 | 431 |
Note : The activities under ‘self development/ self care/ self maintenance, etc.’ are ‘residual other activities’
Statement 17.1: Percentage of persons and minutes spent in a day on an average per person/per participant of age 6 years and above in unpaid activities paid activities and other activities irrespective of whether the activity was a major activity or not (considering all the activities in a time slot)
| Haryana | |||||||||
|---|---|---|---|---|---|---|---|---|---|
| Activity | male | female | person | ||||||
| percentage of persons | minutes spent on an average in a day per person | minutes spent on an average in a day per participant | percentage of persons | minutes spent on an average in a day per person | minutes spent on an average in a day per participant | percentage of persons | minutes spent on an average in a day per person | minutes spent on an average in a day per participant | |
| $(1)$ | $(2)$ | $(3)$ | $(4)$ | $(5)$ | $(6)$ | $(7)$ | $(8)$ | $(9)$ | $(10)$ |
| rural | |||||||||
| self maintenance etc | 100.0 | 1155 | 1155 | 100.0 | 1086 | 1086 | 100.0 | 1122 | 1122 |
| unpaid activities: SNA activities | 19.3 | 25 | 131 | 25.9 | 37 | 143 | 22.5 | 31 | 138 |
| unpaid activities:Non SNA activities | 30.0 | 25 | 83 | 81.2 | 278 | 343 | 54.9 | 148 | 270 |
| all unpaid activities | 41.9 | 50 | 120 | 82.1 | 315 | 384 | 61.5 | 179 | 291 |
| paid activities | 57.1 | 235 | 411 | 14.2 | 39 | 273 | 36.2 | 139 | 385 |
| all unapid/paid acivities | 69.8 | 285 | 408 | 82.8 | 354 | 427 | 76.1 | 318 | 418 |
| urban | |||||||||
| self maintenance etc | 100.0 | 1088 | 1088 | 100.0 | 1094 | 1094 | 100.0 | 1091 | 1091 |
| unpaid activities: SNA activities | 3.0 | 3 | 107 | 3.2 | 4 | 126 | 3.1 | 4 | 115 |
| unpaid activities:Non SNA activities | 45.6 | 40 | 88 | 80.6 | 291 | 361 | 61.6 | 155 | 251 |
| all unpaid activities | 46.6 | 43 | 93 | 80.8 | 295 | 365 | 62.2 | 158 | 255 |
| paid activities | 63.7 | 309 | 485 | 13.6 | 51 | 371 | 40.8 | 191 | 468 |
| all unapid/paid acivities | 75.0 | 352 | 470 | 81.5 | 346 | 424 | 77.9 | 349 | 448 |
| rural+urban | |||||||||
| self maintenance etc | 100.0 | 1123 | 1123 | 100.0 | 1090 | 1090 | 100.0 | 1107 | 1107 |
| unpaid activities: SNA activities | 11.6 | 15 | 128 | 15.8 | 22 | 141 | 13.6 | 18 | 135 |
| unpaid activities:Non SNA activities | 37.3 | 32 | 86 | 80.9 | 284 | 351 | 57.9 | 151 | 261 |
| all unpaid activities | 44.1 | 47 | 106 | 81.5 | 306 | 376 | 61.8 | 170 | 274 |
| paid activities | 60.2 | 270 | 448 | 13.9 | 44 | 316 | 38.3 | 163 | 425 |
| all unapid/paid acivities | 72.3 | 317 | 438 | 82.2 | 350 | 426 | 77.0 | 333 | 432 |
Note : The activities under ‘self development’ self care/ self maintenance, etc.’ are ‘residual other activities’
Statement 17.1: Percentage of persons and minutes spent in a day on an average per person/per participant of age 6 years and above in unpaid activities paid activities and other activities irrespective of whether the activity was a major activity or not (considering all the activities in a time slot)
| Himachal Pradesh | |||||||||
|---|---|---|---|---|---|---|---|---|---|
| Activity | male | female | person | ||||||
| percentage of persons | minutes spent on an average in a day per person | minutes spent on an average in a day per participant | percentage of persons | minutes spent on an average in a day per person | minutes spent on an average in a day per participant | percentage of persons | minutes spent on an average in a day per person | minutes spent on an average in a day per participant | |
| (1) | (2) | (3) | (4) | (5) | (6) | (7) | (8) | (9) | (10) |
| rural | |||||||||
| self maintenance etc | 100.0 | 1129 | 1129 | 100.0 | 1040 | 1040 | 100.0 | 1083 | 1083 |
| unpaid activities: SNA activities | 31.3 | 46 | 146 | 49.9 | 76 | 152 | 41.0 | 61 | 149 |
| unpaid activities:Non SNA activities | 35.7 | 35 | 98 | 85.8 | 284 | 331 | 61.8 | 165 | 267 |
| all unpaid activities | 52.8 | 80 | 152 | 86.5 | 360 | 416 | 70.4 | 226 | 321 |
| paid activities | 53.5 | 231 | 431 | 16.6 | 40 | 241 | 34.3 | 131 | 383 |
| all unapid/paid acivities | 76.4 | 311 | 407 | 87.0 | 400 | 460 | 81.9 | 357 | 436 |
| urban | |||||||||
| self maintenance etc | 100.0 | 1087 | 1087 | 100.0 | 1100 | 1100 | 100.0 | 1093 | 1093 |
| unpaid activities: SNA activities | 4.1 | 5 | 123 | 5.1 | 6 | 127 | 4.6 | 6 | 125 |
| unpaid activities:Non SNA activities | 51.3 | 49 | 96 | 81.4 | 246 | 303 | 65.9 | 145 | 220 |
| all unpaid activities | 53.3 | 54 | 102 | 81.4 | 253 | 311 | 66.9 | 150 | 225 |
| paid activities | 65.2 | 299 | 459 | 22.9 | 87 | 380 | 44.7 | 196 | 439 |
| all unapid/paid acivities | 77.0 | 353 | 459 | 85.1 | 340 | 400 | 80.9 | 347 | 429 |
| rural+urban | |||||||||
| self maintenance etc | 100.0 | 1124 | 1124 | 100.0 | 1047 | 1047 | 100.0 | 1084 | 1084 |
| unpaid activities: SNA activities | 27.7 | 40 | 145 | 44.8 | 68 | 151 | 36.6 | 55 | 149 |
| unpaid activities:Non SNA activities | 37.7 | 37 | 97 | 85.3 | 280 | 328 | 62.3 | 162 | 261 |
| all unpaid activities | 52.9 | 77 | 146 | 86.0 | 348 | 405 | 70.0 | 217 | 310 |
| paid activities | 55.1 | 240 | 435 | 17.3 | 45 | 262 | 35.5 | 139 | 391 |
| all unapid/paid acivities | 76.5 | 316 | 414 | 86.8 | 393 | 453 | 81.8 | 356 | 435 |
Note : The activities under ‘self development’ self care/ self maintenance, etc.’ are ‘residual other activities’
Statement 17.1: Percentage of persons and minutes spent in a day on an average per person/per participant of age 6 years and above in unpaid activities paid activities and other activities irrespective of whether the activity was a major activity or not (considering all the activities in a time slot)
| Jharkhand | |||||||||
|---|---|---|---|---|---|---|---|---|---|
| Activity | male | female | person | ||||||
| percentage of persons | minutes spent on an average in a day per person | minutes spent on an average in a day per participant | percentage of persons | minutes spent on an average in a day per person | minutes spent on an average in a day per participant | percentage of persons | minutes spent on an average in a day per person | minutes spent on an average in a day per participant | |
| (1) | (2) | (3) | (4) | (5) | (6) | (7) | (8) | (9) | (10) |
| rural | |||||||||
| self maintenance etc | 100.0 | 1127 | 1127 | 100.0 | 1034 | 1034 | 100.0 | 1080 | 1080 |
| unpaid activities: SNA activities | 25.7 | 40 | 155 | 41.2 | 55 | 135 | 33.4 | 48 | 143 |
| unpaid activities:Non SNA activities | 43.6 | 44 | 101 | 84.2 | 304 | 361 | 64.0 | 175 | 273 |
| all unpaid activities | 54.8 | 84 | 153 | 85.1 | 360 | 423 | 70.0 | 222 | 318 |
| paid activities | 56.6 | 229 | 405 | 19.5 | 46 | 237 | 38.0 | 137 | 362 |
| all unapid/paid acivities | 72.5 | 313 | 432 | 85.5 | 406 | 475 | 79.0 | 360 | 455 |
| urban | |||||||||
| self maintenance etc | 100.0 | 1125 | 1125 | 100.0 | 1077 | 1077 | 100.0 | 1102 | 1102 |
| unpaid activities: SNA activities | 6.3 | 6 | 95 | 9.8 | 8 | 87 | 8.0 | 7 | 90 |
| unpaid activities:Non SNA activities | 44.2 | 45 | 101 | 82.5 | 306 | 371 | 62.9 | 172 | 274 |
| all unpaid activities | 47.3 | 51 | 107 | 82.7 | 315 | 380 | 64.6 | 180 | 278 |
| paid activities | 56.6 | 264 | 466 | 14.9 | 48 | 322 | 36.2 | 158 | 437 |
| all unapid/paid acivities | 70.8 | 315 | 445 | 83.6 | 363 | 434 | 77.0 | 338 | 439 |
| rural+urban | |||||||||
| self maintenance etc | 100.0 | 1127 | 1127 | 100.0 | 1042 | 1042 | 100.0 | 1085 | 1085 |
| unpaid activities: SNA activities | 21.8 | 33 | 152 | 35.2 | 47 | 132 | 28.5 | 40 | 140 |
| unpaid activities:Non SNA activities | 43.7 | 44 | 101 | 83.9 | 304 | 363 | 63.8 | 174 | 273 |
| all unpaid activities | 53.3 | 77 | 145 | 84.7 | 351 | 415 | 69.0 | 214 | 310 |
| paid activities | 56.6 | 236 | 417 | 18.7 | 47 | 250 | 37.6 | 141 | 376 |
| all unapid/paid acivities | 72.2 | 313 | 434 | 85.1 | 398 | 467 | 78.6 | 355 | 452 |
Note : The activities under ‘self development’ self care/ self maintenance, etc.’ are ‘residual other activities’
Statement 17.1: Percentage of persons and minutes spent in a day on an average per person/per participant of age 6 years and above in unpaid activities paid activities and other activities irrespective of whether the activity was a major activity or not (considering all the activities in a time slot)
| Karnataka | |||||||||
|---|---|---|---|---|---|---|---|---|---|
| Activity | male | female | person | ||||||
| percentage of persons | minutes spent on an average in a day per person | minutes spent on an average in a day per participant | percentage of persons | minutes spent on an average in a day per person | minutes spent on an average in a day per participant | percentage of persons | minutes spent on an average in a day per person | minutes spent on an average in a day per participant | |
| (1) | (2) | (3) | (4) | (5) | (6) | (7) | (8) | (9) | (10) |
| rural | |||||||||
| self maintenance etc | 100.0 | 1126 | 1126 | 100.0 | 1062 | 1062 | 100.0 | 1094 | 1094 |
| unpaid activities: SNA activities | 15.5 | 12 | 79 | 13.7 | 8 | 60 | 14.6 | 10 | 70 |
| unpaid activities:Non SNA activities | 40.1 | 32 | 81 | 86.1 | 283 | 329 | 63.2 | 158 | 250 |
| all unpaid activities | 47.5 | 45 | 94 | 86.4 | 291 | 337 | 67.0 | 168 | 251 |
| paid activities | 69.7 | 269 | 386 | 28.2 | 87 | 307 | 48.9 | 178 | 363 |
| all unapid/paid acivities | 78.7 | 314 | 399 | 87.2 | 378 | 433 | 83.0 | 346 | 417 |
| urban | |||||||||
| self maintenance etc | 100.0 | 1121 | 1121 | 100.0 | 1088 | 1088 | 100.0 | 1105 | 1105 |
| unpaid activities: SNA activities | 3.0 | 2 | 52 | 5.5 | 3 | 61 | 4.2 | 2 | 57 |
| unpaid activities:Non SNA activities | 41.9 | 37 | 89 | 81.7 | 275 | 336 | 60.8 | 150 | 247 |
| all unpaid activities | 43.1 | 39 | 90 | 81.8 | 278 | 340 | 61.4 | 152 | 248 |
| paid activities | 63.2 | 280 | 442 | 21.6 | 74 | 344 | 43.5 | 182 | 419 |
| all unapid/paid acivities | 76.6 | 319 | 416 | 84.6 | 352 | 417 | 80.4 | 335 | 416 |
| rural+urban | |||||||||
| self maintenance etc | 100.0 | 1124 | 1124 | 100.0 | 1072 | 1072 | 100.0 | 1099 | 1099 |
| unpaid activities: SNA activities | 10.3 | 8 | 76 | 10.5 | 6 | 60 | 10.4 | 7 | 68 |
| unpaid activities:Non SNA activities | 40.8 | 34 | 84 | 84.4 | 280 | 332 | 62.2 | 155 | 249 |
| all unpaid activities | 45.6 | 42 | 93 | 84.6 | 286 | 338 | 64.8 | 162 | 250 |
| paid activities | 67.0 | 274 | 408 | 25.6 | 82 | 319 | 46.7 | 180 | 384 |
| all unapid/paid acivities | 77.8 | 316 | 406 | 86.2 | 368 | 427 | 81.9 | 341 | 417 |
Note : The activities under ‘self development/ self care/ self maintenance, etc.’ are ‘residual other activities’
Statement 17.1: Percentage of persons and minutes spent in a day on an average per person/per participant of age 6 years and above in unpaid activities paid activities and other activities irrespective of whether the activity was a major activity or not (considering all the activities in a time slot)
| Kerala | |||||||||
|---|---|---|---|---|---|---|---|---|---|
| Activity | male | female | person | ||||||
| percentage of persons | minutes spent on an average in a day per person | minutes spent on an average in a day per participant | percentage of persons | minutes spent on an average in a day per person | minutes spent on an average in a day per participant | percentage of persons | minutes spent on an average in a day per person | minutes spent on an average in a day per participant | |
| (1) | (2) | (3) | (4) | (5) | (6) | (7) | (8) | (9) | (10) |
| rura | |||||||||
| self maintenance etc | 100.0 | 1173 | 1173 | 100.0 | 1086 | 1086 | 100.0 | 1127 | 1127 |
| unpaid activities: SNA activities | 9.5 | 10 | 104 | 12.1 | 9 | 71 | 10.9 | 9 | 84 |
| unpaid activities:Non SNA activities | 53.0 | 52 | 98 | 86.1 | 277 | 322 | 70.6 | 172 | 243 |
| all unpaid activities | 55.7 | 62 | 111 | 86.1 | 286 | 332 | 71.9 | 181 | 252 |
| paid activities | 49.1 | 205 | 417 | 20.1 | 68 | 339 | 33.7 | 132 | 392 |
| all unapid/paid acivities | 75.9 | 267 | 352 | 86.8 | 354 | 408 | 81.7 | 313 | 383 |
| urban | |||||||||
| self maintenance etc | 100.0 | 1167 | 1167 | 100.0 | 1099 | 1099 | 100.0 | 1131 | 1131 |
| unpaid activities: SNA activities | 7.4 | 8 | 104 | 8.3 | 6 | 67 | 7.9 | 7 | 83 |
| unpaid activities:Non SNA activities | 53.2 | 52 | 98 | 84.4 | 266 | 315 | 69.9 | 166 | 238 |
| all unpaid activities | 54.9 | 60 | 109 | 84.5 | 272 | 321 | 70.7 | 173 | 244 |
| paid activities | 49.6 | 214 | 431 | 19.8 | 69 | 349 | 33.7 | 137 | 405 |
| all unapid/paid acivities | 75.0 | 273 | 364 | 85.2 | 341 | 400 | 80.4 | 309 | 385 |
| rural+urban | |||||||||
| self maintenance etc | 100.0 | 1170 | 1170 | 100.0 | 1092 | 1092 | 100.0 | 1129 | 1129 |
| unpaid activities: SNA activities | 8.5 | 9 | 104 | 10.3 | 7 | 70 | 9.5 | 8 | 84 |
| unpaid activities:Non SNA activities | 53.1 | 52 | 98 | 85.3 | 272 | 319 | 70.2 | 169 | 241 |
| all unpaid activities | 55.3 | 61 | 110 | 85.4 | 279 | 327 | 71.3 | 177 | 248 |
| paid activities | 49.3 | 209 | 424 | 20.0 | 69 | 344 | 33.7 | 134 | 399 |
| all unapid/paid acivities | 75.5 | 270 | 358 | 86.1 | 348 | 404 | 81.1 | 311 | 384 |
Note : The activities under ‘self development/ self care/ self maintenance, etc.’ are ‘residual other activities’
Statement 17.1: Percentage of persons and minutes spent in a day on an average per person/per participant of age 6 years and above in unpaid activities paid activities and other activities irrespective of whether the activity was a major activity or not (considering all the activities in a time slot)
| Madhya Pradesh | |||||||||
|---|---|---|---|---|---|---|---|---|---|
| Activity | male | female | person | ||||||
| percentage of persons | minutes spent on an average in a day per person | minutes spent on an average in a day per participant | percentage of persons | minutes spent on an average in a day per person | minutes spent on an average in a day per participant | percentage of persons | minutes spent on an average in a day per person | minutes spent on an average in a day per participant | |
| (1) | (2) | (3) | (4) | (5) | (6) | (7) | (8) | (9) | (10) |
| rura | |||||||||
| self maintenance etc | 100.0 | 1119 | 1119 | 100.0 | 1010 | 1010 | 100.0 | 1066 | 1066 |
| unpaid activities: SNA activities | 32.3 | 38 | 119 | 45.1 | 49 | 109 | 38.5 | 44 | 113 |
| unpaid activities:Non SNA activities | 39.8 | 44 | 110 | 86.6 | 311 | 359 | 62.4 | 173 | 277 |
| all unpaid activities | 56.6 | 82 | 145 | 87.7 | 361 | 411 | 71.6 | 216 | 302 |
| paid activities | 64.1 | 239 | 372 | 24.2 | 70 | 289 | 44.8 | 157 | 351 |
| all unapid/paid acivities | 78.5 | 321 | 409 | 88.2 | 430 | 488 | 83.1 | 374 | 449 |
| urban | |||||||||
| self maintenance etc | 100.0 | 1122 | 1122 | 100.0 | 1083 | 1083 | 100.0 | 1103 | 1103 |
| unpaid activities: SNA activities | 8.6 | 8 | 88 | 17.5 | 11 | 64 | 12.9 | 9 | 72 |
| unpaid activities:Non SNA activities | 37.7 | 38 | 101 | 83.7 | 297 | 355 | 60.0 | 164 | 273 |
| all unpaid activities | 41.5 | 46 | 110 | 84.1 | 308 | 366 | 62.2 | 173 | 278 |
| paid activities | 61.7 | 272 | 442 | 14.5 | 49 | 334 | 38.8 | 164 | 422 |
| all unapid/paid acivities | 74.3 | 318 | 428 | 85.1 | 357 | 419 | 79.5 | 337 | 424 |
| rural+urban | |||||||||
| self maintenance etc | 100.0 | 1120 | 1120 | 100.0 | 1031 | 1031 | 100.0 | 1077 | 1077 |
| unpaid activities: SNA activities | 25.5 | 30 | 116 | 37.1 | 38 | 103 | 31.1 | 34 | 108 |
| unpaid activities:Non SNA activities | 39.2 | 42 | 107 | 85.8 | 307 | 358 | 61.7 | 170 | 276 |
| all unpaid activities | 52.2 | 72 | 137 | 86.7 | 345 | 398 | 68.9 | 204 | 296 |
| paid activities | 63.4 | 248 | 392 | 21.4 | 64 | 298 | 43.1 | 159 | 369 |
| all unapid/paid acivities | 77.3 | 320 | 414 | 87.3 | 409 | 469 | 82.1 | 363 | 442 |
Note : The activities under ‘self development’ self care/ self maintenance, etc.’ are ‘residual other activities’
Statement 17.1: Percentage of persons and minutes spent in a day on an average per person/per participant of age 6 years and above in unpaid activities paid activities and other activities irrespective of whether the activity was a major activity or not (considering all the activities in a time slot)
| Maharashtra | |||||||||
|---|---|---|---|---|---|---|---|---|---|
| Activity | male | female | person | ||||||
| percentage of persons | minutes spent on an average in a day per person | minutes spent on an average in a day per participant | percentage of persons | minutes spent on an average in a day per person | minutes spent on an average in a day per participant | percentage of persons | minutes spent on an average in a day per person | minutes spent on an average in a day per participant | |
| (1) | (2) | (3) | (4) | (5) | (6) | (7) | (8) | (9) | (10) |
| rura | |||||||||
| self maintenance etc | 100.0 | 1129 | 1129 | 100.0 | 1029 | 1029 | 100.0 | 1080 | 1080 |
| unpaid activities: SNA activities | 9.1 | 10 | 105 | 18.9 | 13 | 67 | 13.9 | 11 | 79 |
| unpaid activities:Non SNA activities | 35.3 | 34 | 96 | 86.9 | 278 | 320 | 60.6 | 154 | 254 |
| all unpaid activities | 39.3 | 43 | 110 | 87.2 | 291 | 334 | 62.7 | 165 | 263 |
| paid activities | 66.0 | 267 | 404 | 35.7 | 119 | 335 | 51.2 | 195 | 381 |
| all unapid/paid acivities | 75.8 | 311 | 410 | 87.8 | 411 | 468 | 81.7 | 360 | 440 |
| urban | |||||||||
| self maintenance etc | 100.0 | 1111 | 1111 | 100.0 | 1092 | 1092 | 100.0 | 1102 | 1102 |
| unpaid activities: SNA activities | 2.2 | 2 | 77 | 14.5 | 6 | 43 | 8.1 | 4 | 48 |
| unpaid activities:Non SNA activities | 34.2 | 29 | 85 | 84.4 | 270 | 320 | 58.2 | 144 | 248 |
| all unpaid activities | 35.0 | 31 | 88 | 84.5 | 277 | 328 | 58.6 | 148 | 253 |
| paid activities | 62.9 | 298 | 474 | 19.0 | 72 | 377 | 42.0 | 190 | 453 |
| all unapid/paid acivities | 74.0 | 329 | 445 | 86.2 | 348 | 404 | 79.8 | 338 | 424 |
| rural+urban | |||||||||
| self maintenance etc | 100.0 | 1121 | 1121 | 100.0 | 1056 | 1056 | 100.0 | 1090 | 1090 |
| unpaid activities: SNA activities | 6.1 | 6 | 100 | 17.1 | 10 | 58 | 11.4 | 8 | 70 |
| unpaid activities:Non SNA activities | 34.8 | 32 | 91 | 85.9 | 275 | 320 | 59.6 | 150 | 251 |
| all unpaid activities | 37.4 | 38 | 101 | 86.0 | 285 | 331 | 61.0 | 158 | 258 |
| paid activities | 64.7 | 281 | 434 | 28.6 | 99 | 347 | 47.2 | 193 | 408 |
| all unapid/paid acivities | 75.0 | 319 | 425 | 87.1 | 384 | 441 | 80.9 | 350 | 433 |
Note : The activities under ‘self development’ self care/ self maintenance, etc.’ are ‘residual other activities’
Statement 17.1: Percentage of persons and minutes spent in a day on an average per person/per participant of age 6 years and above in unpaid activities paid activities and other activities irrespective of whether the activity was a major activity or not (considering all the activities in a time slot)
| Manipur | |||||||||
|---|---|---|---|---|---|---|---|---|---|
| Activity | male | female | person | ||||||
| percentage of persons | minutes spent on an average in a day per person | minutes spent on an average in a day per participant | percentage of persons | minutes spent on an average in a day per person | minutes spent on an average in a day per participant | percentage of persons | minutes spent on an average in a day per person | minutes spent on an average in a day per participant | |
| (1) | (2) | (3) | (4) | (5) | (6) | (7) | (8) | (9) | (10) |
| rura | |||||||||
| self maintenance etc | 100.0 | 1161 | 1161 | 100.0 | 1050 | 1050 | 100.0 | 1107 | 1107 |
| unpaid activities: SNA activities | 20.8 | 22 | 106 | 30.8 | 38 | 124 | 25.6 | 30 | 117 |
| unpaid activities:Non SNA activities | 48.6 | 50 | 103 | 80.5 | 265 | 328 | 64.1 | 155 | 241 |
| all unpaid activities | 55.4 | 72 | 131 | 82.0 | 303 | 369 | 68.3 | 184 | 270 |
| paid activities | 56.8 | 207 | 364 | 32.1 | 87 | 271 | 44.8 | 148 | 332 |
| all unapid/paid acivities | 72.8 | 279 | 384 | 82.7 | 390 | 471 | 77.6 | 333 | 429 |
| urban | |||||||||
| self maintenance etc | 100.0 | 1147 | 1147 | 100.0 | 1044 | 1044 | 100.0 | 1095 | 1095 |
| unpaid activities: SNA activities | 14.0 | 14 | 101 | 18.8 | 19 | 101 | 16.4 | 17 | 101 |
| unpaid activities:Non SNA activities | 57.2 | 59 | 103 | 81.6 | 265 | 324 | 69.6 | 164 | 235 |
| all unpaid activities | 62.1 | 73 | 118 | 82.6 | 284 | 344 | 72.5 | 180 | 249 |
| paid activities | 56.9 | 220 | 387 | 38.4 | 112 | 292 | 47.4 | 165 | 348 |
| all unapid/paid acivities | 75.4 | 293 | 389 | 84.1 | 396 | 471 | 79.8 | 345 | 433 |
| rural+urban | |||||||||
| self maintenance etc | 100.0 | 1157 | 1157 | 100.0 | 1049 | 1049 | 100.0 | 1103 | 1103 |
| unpaid activities: SNA activities | 18.8 | 20 | 105 | 27.0 | 32 | 119 | 22.8 | 26 | 113 |
| unpaid activities:Non SNA activities | 51.1 | 53 | 103 | 80.9 | 265 | 327 | 65.8 | 157 | 239 |
| all unpaid activities | 57.4 | 72 | 126 | 82.1 | 297 | 361 | 69.6 | 183 | 263 |
| paid activities | 56.8 | 211 | 371 | 34.1 | 95 | 278 | 45.6 | 154 | 337 |
| all unapid/paid acivities | 73.6 | 283 | 385 | 83.2 | 391 | 471 | 78.3 | 337 | 430 |
Note : The activities under ‘self development’ self care/ self maintenance, etc.’ are ‘residual other activities’
Statement 17.1: Percentage of persons and minutes spent in a day on an average per person/per participant of age 6 years and above in unpaid activities paid activities and other activities irrespective of whether the activity was a major activity or not (considering all the activities in a time slot)
| Meghalaya | |||||||||
|---|---|---|---|---|---|---|---|---|---|
| Activity | male | female | person | ||||||
| percentage of persons | minutes spent on an average in a day per person | minutes spent on an average in a day per participant | percentage of persons | minutes spent on an average in a day per person | minutes spent on an average in a day per participant | percentage of persons | minutes spent on an average in a day per person | minutes spent on an average in a day per participant | |
| (1) | (2) | (3) | (4) | (5) | (6) | (7) | (8) | (9) | (10) |
| rura | |||||||||
| self maintenance etc | 100.0 | 1165 | 1165 | 100.0 | 1083 | 1083 | 100.0 | 1122 | 1122 |
| unpaid activities: SNA activities | 11.6 | 20 | 173 | 10.0 | 12 | 120 | 10.8 | 16 | 148 |
| unpaid activities:Non SNA activities | 50.3 | 49 | 98 | 83.4 | 285 | 341 | 67.4 | 170 | 253 |
| all unpaid activities | 53.8 | 69 | 129 | 83.9 | 297 | 354 | 69.3 | 186 | 269 |
| paid activities | 51.0 | 206 | 404 | 17.9 | 61 | 340 | 33.9 | 131 | 387 |
| all unapid/paid acivities | 74.5 | 275 | 369 | 84.5 | 357 | 423 | 79.7 | 318 | 399 |
| urban | |||||||||
| self maintenance etc | 100.0 | 1150 | 1150 | 100.0 | 1111 | 1111 | 100.0 | 1130 | 1130 |
| unpaid activities: SNA activities | 7.7 | 7 | 96 | 6.0 | 7 | 110 | 6.8 | 7 | 102 |
| unpaid activities:Non SNA activities | 50.9 | 55 | 108 | 82.7 | 258 | 312 | 67.7 | 162 | 239 |
| all unpaid activities | 53.0 | 62 | 118 | 83.2 | 264 | 318 | 68.9 | 169 | 245 |
| paid activities | 53.6 | 227 | 424 | 17.3 | 65 | 373 | 34.4 | 141 | 410 |
| all unapid/paid acivities | 78.9 | 290 | 367 | 84.7 | 329 | 388 | 82.0 | 310 | 379 |
| rural+urban | |||||||||
| self maintenance etc | 100.0 | 1162 | 1162 | 100.0 | 1088 | 1088 | 100.0 | 1124 | 1124 |
| unpaid activities: SNA activities | 10.9 | 18 | 163 | 9.3 | 11 | 119 | 10.0 | 14 | 142 |
| unpaid activities:Non SNA activities | 50.4 | 50 | 100 | 83.3 | 280 | 336 | 67.4 | 169 | 251 |
| all unpaid activities | 53.7 | 68 | 127 | 83.8 | 291 | 347 | 69.2 | 183 | 265 |
| paid activities | 51.5 | 210 | 408 | 17.8 | 61 | 346 | 34.0 | 133 | 391 |
| all unapid/paid acivities | 75.3 | 278 | 369 | 84.5 | 352 | 416 | 80.1 | 316 | 395 |
Note : The activities under ‘self development’ self care/ self maintenance, etc.’ are ‘residual other activities’
Statement 17.1: Percentage of persons and minutes spent in a day on an average per person/per participant of age 6 years and above in unpaid activities, paid activities and other activities irrespective of whether the activity was a major activity or not (considering all the activities in a time slot)
| Mizo | |||||||||
|---|---|---|---|---|---|---|---|---|---|
| Activity | male | female | person | ||||||
| percentage of persons | minutes spent on an average in a day per person | minutes spent on an average in a day per participant | percentage of persons | minutes spent on an average in a day per person | minutes spent on an average in a day per participant | percentage of persons | minutes spent on an average in a day per person | minutes spent on an average in a day per participant | |
| (1) | (2) | (3) | (4) | (5) | (6) | (7) | (8) | (9) | (10) |
| rura | |||||||||
| self maintenance etc | 100.0 | 1127 | 1127 | 100.0 | 1003 | 1003 | 100.0 | 1067 | 1067 |
| unpaid activities: SNA activities | 27.7 | 20 | 73 | 31.8 | 38 | 120 | 29.7 | 29 | 98 |
| unpaid activities:Non SNA activities | 50.3 | 46 | 92 | 92.4 | 300 | 325 | 70.7 | 169 | 240 |
| all unpaid activities | 60.1 | 67 | 111 | 92.7 | 338 | 365 | 75.9 | 198 | 261 |
| paid activities | 69.0 | 247 | 357 | 30.6 | 99 | 323 | 50.4 | 175 | 347 |
| all unapid/paid acivities | 81.7 | 313 | 384 | 93.3 | 437 | 469 | 87.3 | 373 | 428 |
| urban | |||||||||
| self maintenance etc | 100.0 | 1151 | 1151 | 100.0 | 1042 | 1042 | 100.0 | 1096 | 1096 |
| unpaid activities: SNA activities | 4.5 | 4 | 95 | 9.8 | 11 | 107 | 7.2 | 7 | 103 |
| unpaid activities:Non SNA activities | 52.5 | 57 | 108 | 91.1 | 310 | 340 | 71.9 | 184 | 256 |
| all unpaid activities | 53.4 | 61 | 114 | 91.2 | 321 | 352 | 72.4 | 192 | 265 |
| paid activities | 60.0 | 228 | 381 | 21.7 | 77 | 356 | 40.8 | 152 | 374 |
| all unapid/paid acivities | 75.9 | 289 | 381 | 92.8 | 398 | 429 | 84.4 | 344 | 408 |
| rural+urban | |||||||||
| self maintenance etc | 100.0 | 1137 | 1137 | 100.0 | 1020 | 1020 | 100.0 | 1079 | 1079 |
| unpaid activities: SNA activities | 17.7 | 13 | 76 | 22.0 | 26 | 117 | 19.8 | 19 | 98 |
| unpaid activities:Non SNA activities | 51.3 | 51 | 99 | 91.8 | 305 | 332 | 71.3 | 176 | 247 |
| all unpaid activities | 57.2 | 64 | 112 | 92.1 | 330 | 359 | 74.4 | 195 | 263 |
| paid activities | 65.1 | 239 | 367 | 26.6 | 89 | 335 | 46.1 | 165 | 358 |
| all unapid/paid acivities | 79.2 | 303 | 383 | 93.1 | 420 | 451 | 86.0 | 361 | 419 |
Note : The activities under ‘self development’ self care/ self maintenance, etc.’ are ‘residual other activities’
Statement 17.1: Percentage of persons and minutes spent in a day on an average per person/per participant of age 6 years and above in unpaid activities paid activities and other activities irrespective of whether the activity was a major activity or not (considering all the activities in a time slot)
| Nagaland | |||||||||
|---|---|---|---|---|---|---|---|---|---|
| Activity | male | female | person | ||||||
| percentage of persons | minutes spent on an average in a day per person | minutes spent on an average in a day per participant | percentage of persons | minutes spent on an average in a day per person | minutes spent on an average in a day per participant | percentage of persons | minutes spent on an average in a day per person | minutes spent on an average in a day per participant | |
| (1) | (2) | (3) | (4) | (5) | (6) | (7) | (8) | (9) | (10) |
| rura | |||||||||
| self maintenance etc | 100.0 | 1159 | 1159 | 100.0 | 1062 | 1062 | 100.0 | 1112 | 1112 |
| unpaid activities: SNA activities | 57.1 | 140 | 246 | 54.7 | 114 | 208 | 55.9 | 127 | 227 |
| unpaid activities:Non SNA activities | 67.2 | 80 | 118 | 87.6 | 249 | 284 | 77.3 | 163 | 211 |
| all unpaid activities | 81.9 | 220 | 268 | 89.2 | 362 | 406 | 85.5 | 290 | 339 |
| paid activities | 20.6 | 61 | 294 | 7.8 | 15 | 198 | 14.3 | 38 | 268 |
| all unapid/paid acivities | 84.7 | 281 | 331 | 89.7 | 378 | 421 | 87.1 | 328 | 377 |
| urban | |||||||||
| self maintenance etc | 100.0 | 1189 | 1189 | 100.0 | 1089 | 1089 | 100.0 | 1141 | 1141 |
| unpaid activities: SNA activities | 23.0 | 27 | 118 | 18.4 | 21 | 116 | 20.8 | 24 | 117 |
| unpaid activities:Non SNA activities | 69.6 | 91 | 130 | 85.8 | 288 | 336 | 77.5 | 187 | 241 |
| all unpaid activities | 75.2 | 118 | 157 | 86.1 | 310 | 359 | 80.5 | 211 | 262 |
| paid activities | 39.0 | 133 | 341 | 15.3 | 41 | 270 | 27.5 | 88 | 322 |
| all unapid/paid acivities | 81.7 | 251 | 307 | 87.7 | 351 | 400 | 84.6 | 299 | 354 |
| rural+urban | |||||||||
| self maintenance etc | 100.0 | 1170 | 1170 | 100.0 | 1071 | 1071 | 100.0 | 1122 | 1122 |
| unpaid activities: SNA activities | 45.3 | 101 | 223 | 42.4 | 82 | 194 | 43.9 | 92 | 210 |
| unpaid activities:Non SNA activities | 68.1 | 83 | 123 | 87.0 | 262 | 301 | 77.3 | 171 | 221 |
| all unpaid activities | 79.6 | 185 | 232 | 88.2 | 344 | 391 | 83.8 | 263 | 314 |
| paid activities | 26.9 | 86 | 317 | 10.4 | 24 | 234 | 18.8 | 56 | 295 |
| all unapid/paid acivities | 83.6 | 270 | 323 | 89.0 | 369 | 414 | 86.3 | 318 | 369 |
Note : The activities under ‘self development/ self care/ self maintenance, etc.’ are ‘residual other activities’
Statement 17.1: Percentage of persons and minutes spent in a day on an average per person/per participant of age 6 years and above in unpaid activities , paid activities and other activities irrespective of whether the activity was a major activity or not (considering all the activities in a time slot)
| {Odisha} | |||||||||
|---|---|---|---|---|---|---|---|---|---|
| Activity | male | female | person | ||||||
| percentage of persons | minutes spent on an average in a day per person | minutes spent on an average in a day per participant | percentage of persons | minutes spent on an average in a day per person | minutes spent on an average in a day per participant | percentage of persons | minutes spent on an average in a day per person | minutes spent on an average in a day per participant | |
| (1) | (2) | (3) | (4) | (5) | (6) | (7) | (8) | (9) | (10) |
| rural | |||||||||
| self maintenance etc | 100.0 | 1167 | 1167 | 100.0 | 1080 | 1080 | 100.0 | 1123 | 1123 |
| unpaid activities: SNA activities | 19.8 | 33 | 167 | 38.1 | 38 | 100 | 29.1 | 36 | 123 |
| unpaid activities:Non SNA activities | 35.4 | 39 | 109 | 81.8 | 280 | 342 | 59.0 | 161 | 273 |
| all unpaid activities | 45.4 | 72 | 158 | 83.1 | 318 | 382 | 64.6 | 197 | 305 |
| paid activities | 55.9 | 201 | 359 | 15.2 | 42 | 277 | 35.2 | 120 | 341 |
| all unapid/paid acivities | 72.8 | 273 | 374 | 83.9 | 360 | 429 | 78.4 | 317 | 404 |
| urban | |||||||||
| self maintenance etc | 100.0 | 1140 | 1140 | 100.0 | 1130 | 1130 | 100.0 | 1135 | 1135 |
| unpaid activities: SNA activities | 4.2 | 4 | 98 | 12.1 | 7 | 55 | 8.3 | 5 | 66 |
| unpaid activities:Non SNA activities | 41.6 | 43 | 103 | 80.7 | 259 | 322 | 61.8 | 155 | 251 |
| all unpaid activities | 43.7 | 47 | 108 | 80.9 | 266 | 329 | 62.9 | 160 | 255 |
| paid activities | 58.9 | 253 | 429 | 13.3 | 44 | 332 | 35.3 | 145 | 410 |
| all unapid/paid acivities | 74.0 | 300 | 405 | 81.6 | 310 | 381 | 77.9 | 305 | 392 |
| rural+urban | |||||||||
| self maintenance etc | 100.0 | 1163 | 1163 | 100.0 | 1089 | 1089 | 100.0 | 1125 | 1125 |
| unpaid activities: SNA activities | 17.3 | 28 | 165 | 33.8 | 33 | 98 | 25.7 | 31 | 120 |
| unpaid activities:Non SNA activities | 36.4 | 39 | 108 | 81.6 | 276 | 339 | 59.5 | 160 | 269 |
| all unpaid activities | 45.1 | 68 | 150 | 82.8 | 309 | 374 | 64.3 | 191 | 297 |
| paid activities | 56.4 | 209 | 371 | 14.8 | 42 | 285 | 35.2 | 124 | 353 |
| all unapid/paid acivities | 73.0 | 277 | 379 | 83.5 | 351 | 421 | 78.3 | 315 | 402 |
Note : The activities under ‘self development/ self care/ self maintenance, etc.’ are ‘residual other activities’
Statement 17.1: Percentage of persons and minutes spent in a day on an average per person/per participant of age 6 years and above in unpaid activities , paid activities and other activities irrespective of whether the activity was a major activity or not (considering all the activities in a time slot)
| Punjab | |||||||||
|---|---|---|---|---|---|---|---|---|---|
| Activity | male | female | person | ||||||
| percentage of persons | minutes spent on an average in a day per person | minutes spent on an average in a day per participant | percentage of persons | minutes spent on an average in a day per person | minutes spent on an average in a day per participant | percentage of persons | minutes spent on an average in a day per person | minutes spent on an average in a day per participant | |
| (1) | (2) | (3) | (4) | (5) | (6) | (7) | (8) | (9) | (10) |
| rural | |||||||||
| self maintenance etc | 100.0 | 1111 | 1111 | 100.0 | 1088 | 1088 | 100.0 | 1100 | 1100 |
| unpaid activities: SNA activities | 10.8 | 15 | 143 | 12.9 | 16 | 122 | 11.8 | 16 | 132 |
| unpaid activities:Non SNA activities | 37.7 | 35 | 93 | 83.8 | 284 | 339 | 59.6 | 153 | 257 |
| all unpaid activities | 43.4 | 51 | 116 | 83.9 | 300 | 357 | 62.6 | 169 | 269 |
| paid activities | 63.9 | 279 | 436 | 19.8 | 53 | 267 | 43.0 | 172 | 399 |
| all unapid/paid acivities | 75.9 | 329 | 434 | 84.8 | 352 | 416 | 80.1 | 340 | 425 |
| urban | |||||||||
| self maintenance etc | 100.0 | 1095 | 1095 | 100.0 | 1091 | 1091 | 100.0 | 1093 | 1093 |
| unpaid activities: SNA activities | 2.1 | 5 | 237 | 2.1 | 3 | 145 | 2.1 | 4 | 193 |
| unpaid activities:Non SNA activities | 44.0 | 43 | 98 | 84.9 | 279 | 328 | 63.2 | 154 | 243 |
| all unpaid activities | 45.0 | 48 | 107 | 85.0 | 282 | 332 | 63.8 | 158 | 248 |
| paid activities | 63.9 | 297 | 465 | 19.1 | 67 | 352 | 42.8 | 189 | 441 |
| all unapid/paid acivities | 77.5 | 345 | 445 | 85.6 | 349 | 408 | 81.3 | 347 | 427 |
| rural+urban | |||||||||
| self maintenance etc | 100.0 | 1104 | 1104 | 100.0 | 1089 | 1089 | 100.0 | 1097 | 1097 |
| unpaid activities: SNA activities | 7.3 | 11 | 154 | 8.7 | 11 | 124 | 7.9 | 11 | 138 |
| unpaid activities:Non SNA activities | 40.2 | 38 | 95 | 84.2 | 282 | 335 | 61.0 | 153 | 251 |
| all unpaid activities | 44.0 | 50 | 113 | 84.4 | 293 | 347 | 63.1 | 164 | 261 |
| paid activities | 63.9 | 286 | 448 | 19.5 | 59 | 300 | 42.9 | 179 | 416 |
| all unapid/paid acivities | 76.6 | 336 | 438 | 85.1 | 351 | 413 | 80.6 | 343 | 425 |
Note : The activities under ‘self development/ self care/ self maintenance, etc.’ are ‘residual other activities’
Statement 17.1: Percentage of persons and minutes spent in a day on an average per person/per participant of age 6 years and above in unpaid activities paid activities and other activities irrespective of whether the activity was a major activity or not (considering all the activities in a time slot)
| Rajasthan | |||||||||
|---|---|---|---|---|---|---|---|---|---|
| Activity | male | female | person | ||||||
| percentage of persons | minutes spent on an average in a day per person | minutes spent on an average in a day per participant | percentage of persons | minutes spent on an average in a day per person | minutes spent on an average in a day per participant | percentage of persons | minutes spent on an average in a day per person | minutes spent on an average in a day per participant | |
| (1) | (2) | (3) | (4) | (5) | (6) | (7) | (8) | (9) | (10) |
| rural | |||||||||
| self maintenance etc | 100.0 | 1151 | 1151 | 100.0 | 1043 | 1043 | 100.0 | 1095 | 1095 |
| unpaid activities: SNA activities | 24.4 | 40 | 164 | 44.8 | 76 | 171 | 34.9 | 59 | 168 |
| unpaid activities:Non SNA activities | 39.8 | 34 | 84 | 85.0 | 249 | 293 | 63.1 | 145 | 229 |
| all unpaid activities | 51.0 | 74 | 144 | 86.0 | 326 | 379 | 69.0 | 203 | 295 |
| paid activities | 52.9 | 216 | 408 | 27.2 | 71 | 263 | 39.6 | 141 | 357 |
| all unapid/paid acivities | 73.2 | 289 | 395 | 86.5 | 397 | 459 | 80.1 | 345 | 431 |
| urban | |||||||||
| self maintenance etc | 100.0 | 1123 | 1123 | 100.0 | 1117 | 1117 | 100.0 | 1120 | 1120 |
| unpaid activities: SNA activities | 3.1 | 4 | 131 | 8.8 | 8 | 90 | 5.8 | 6 | 102 |
| unpaid activities:Non SNA activities | 41.1 | 35 | 86 | 82.2 | 263 | 320 | 60.5 | 143 | 236 |
| all unpaid activities | 42.4 | 39 | 93 | 82.4 | 271 | 329 | 61.3 | 149 | 243 |
| paid activities | 59.5 | 277 | 466 | 16.2 | 52 | 323 | 39.1 | 171 | 438 |
| all unapid/paid acivities | 73.7 | 317 | 430 | 83.4 | 323 | 388 | 78.3 | 320 | 409 |
| rural+urban | |||||||||
| self maintenance etc | 100.0 | 1143 | 1143 | 100.0 | 1061 | 1061 | 100.0 | 1102 | 1102 |
| unpaid activities: SNA activities | 18.4 | 30 | 162 | 35.8 | 59 | 166 | 27.2 | 45 | 165 |
| unpaid activities:Non SNA activities | 40.2 | 34 | 85 | 84.3 | 253 | 300 | 62.4 | 144 | 231 |
| all unpaid activities | 48.6 | 64 | 132 | 85.1 | 312 | 367 | 67.0 | 189 | 282 |
| paid activities | 54.8 | 233 | 426 | 24.4 | 67 | 273 | 39.5 | 149 | 378 |
| all unapid/paid acivities | 73.3 | 297 | 405 | 85.7 | 379 | 442 | 79.6 | 338 | 425 |
Note : The activities under ‘self development/ self care/ self maintenance, etc.’ are ‘residual other activities’
Statement 17.1: Percentage of persons and minutes spent in a day on an average per person/per participant of age 6 years and above in unpaid activities, paid activities and other activities irrespective of whether the activity was a major activity or not (considering all the activities in a time slot)
| Sikkim | |||||||||
|---|---|---|---|---|---|---|---|---|---|
| Activity | male | female | person | ||||||
| percentage of persons | minutes spent on an average in a day per person | minutes spent on an average in a day per participant | percentage of persons | minutes spent on an average in a day per person | minutes spent on an average in a day per participant |
percentage of persons | minutes spent on an average in a day per person | minutes spent on an average in a day per participant | |
| (1) | (2) | (3) | (4) | (5) | (6) | (7) | (8) | (9) | (10) |
| rural | |||||||||
| self maintenance etc | 100.0 | 1082 | 1082 | 100.0 | 1047 | 1047 | 100.0 | 1065 | 1065 |
| unpaid activities: SNA activities | 23.1 | 42 | 183 | 19.4 | 24 | 125 | 21.3 | 33 | 157 |
| unpaid activities:Non SNA activities | 66.0 | 71 | 107 | 90.4 | 297 | 328 | 77.9 | 181 | 232 |
| all unpaid activities | 72.0 | 113 | 157 | 90.6 | 321 | 355 | 81.0 | 214 | 265 |
| paid activities | 64.9 | 245 | 377 | 25.3 | 72 | 286 | 45.6 | 161 | 353 |
| all unapid/paid acivities | 84.6 | 358 | 423 | 91.8 | 393 | 429 | 88.1 | 375 | 426 |
| urban | |||||||||
| self maintenance etc | 100.0 | 1042 | 1042 | 100.0 | 1004 | 1004 | 100.0 | 1025 | 1025 |
| unpaid activities: SNA activities | 1.5 | 1 | 63 | 2.5 | 2 | 74 | 2.0 | 1 | 69 |
| unpaid activities:Non SNA activities | 70.5 | 84 | 119 | 95.3 | 327 | 344 | 81.9 | 196 | 239 |
| all unpaid activities | 70.6 | 85 | 121 | 95.3 | 329 | 346 | 82.0 | 197 | 241 |
| paid activities | 65.2 | 313 | 480 | 28.5 | 106 | 374 | 48.3 | 218 | 451 |
| all unapid/paid acivities | 89.1 | 398 | 447 | 96.0 | 436 | 454 | 92.3 | 415 | 450 |
| rural+urban | |||||||||
| self maintenance etc | 100.0 | 1072 | 1072 | 100.0 | 1036 | 1036 | 100.0 | 1055 | 1055 |
| unpaid activities: SNA activities | 17.4 | 31 | 180 | 15.3 | 19 | 123 | 16.4 | 25 | 154 |
| unpaid activities:Non SNA activities | 67.2 | 74 | 111 | 91.6 | 304 | 332 | 78.9 | 185 | 234 |
| all unpaid activities | 71.6 | 106 | 148 | 91.7 | 323 | 352 | 81.3 | 210 | 259 |
| paid activities | 65.0 | 263 | 404 | 26.0 | 81 | 309 | 46.3 | 175 | 379 |
| all unapid/paid acivities | 85.8 | 368 | 429 | 92.8 | 404 | 435 | 89.2 | 385 | 432 |
Note : The activities under ‘self development/ self care/ self maintenance, etc.’ are ‘residual other activities’
Statement 17.1: Percentage of persons and minutes spent in a day on an average per person/per participant of age 6 years and above in unpaid activities paid activities and other activities irrespective of whether the activity was a major activity or not (considering all the activities in a time slot)
| Tamil Nadu | |||||||||
|---|---|---|---|---|---|---|---|---|---|
| Activity | male | female | person | ||||||
| percentage of persons | minutes spent on an average in a day per person | minutes spent on an average in a day per participant | percentage of persons | minutes spent on an average in a day per person | minutes spent on an average in a day per participant | percentage of persons | minutes spent on an average in a day per person | minutes spent on an average in a day per participant | |
| (1) | (2) | (3) | (4) | (5) | (6) | (7) | (8) | (9) | (10) |
| rural | |||||||||
| self maintenance etc | 100.0 | 1149 | 1149 | 100.0 | 1098 | 1098 | 100.0 | 1122 | 1122 |
| unpaid activities: SNA activities | 9.7 | 7 | 77 | 25.0 | 12 | 47 | 17.7 | 10 | 55 |
| unpaid activities:Non SNA activities | 40.6 | 33 | 82 | 84.4 | 213 | 253 | 63.5 | 127 | 201 |
| all unpaid activities | 45.5 | 41 | 89 | 85.0 | 225 | 265 | 66.1 | 137 | 207 |
| paid activities | 62.2 | 250 | 402 | 37.6 | 117 | 311 | 49.3 | 181 | 366 |
| all unapid/paid acivities | 76.4 | 291 | 381 | 86.3 | 342 | 396 | 81.6 | 318 | 389 |
| urban | |||||||||
| self maintenance etc | 100.0 | 1123 | 1123 | 100.0 | 1108 | 1108 | 100.0 | 1115 | 1115 |
| unpaid activities: SNA activities | 4.8 | 2 | 48 | 10.7 | 5 | 42 | 7.8 | 3 | 44 |
| unpaid activities:Non SNA activities | 44.8 | 37 | 84 | 83.5 | 236 | 282 | 64.3 | 137 | 214 |
| all unpaid activities | 46.9 | 40 | 85 | 83.8 | 240 | 287 | 65.5 | 141 | 215 |
| paid activities | 63.0 | 278 | 440 | 25.1 | 92 | 366 | 43.9 | 184 | 419 |
| all unapid/paid acivities | 78.5 | 317 | 404 | 85.6 | 332 | 388 | 82.1 | 325 | 396 |
| rural+urban | |||||||||
| self maintenance etc | 100.0 | 1136 | 1136 | 100.0 | 1103 | 1103 | 100.0 | 1119 | 1119 |
| unpaid activities: SNA activities | 7.3 | 5 | 68 | 18.3 | 8 | 46 | 13.0 | 7 | 52 |
| unpaid activities:Non SNA activities | 42.6 | 35 | 83 | 84.0 | 224 | 266 | 63.9 | 132 | 207 |
| all unpaid activities | 46.1 | 40 | 87 | 84.4 | 232 | 275 | 65.8 | 139 | 211 |
| paid activities | 62.6 | 264 | 421 | 31.8 | 105 | 332 | 46.7 | 182 | 390 |
| all unapid/paid acivities | 77.4 | 304 | 392 | 86.0 | 337 | 392 | 81.8 | 321 | 392 |
Note : The activities under ‘self development/ self care/ self maintenance, etc.’ are ‘residual other activities’
Statement 17.1: Percentage of persons and minutes spent in a day on an average per person/per participant of age 6 years and above in unpaid activities paid activities and other activities irrespective of whether the activity was a major activity or not (considering all the activities in a time slot)
| Telangana | |||||||||
|---|---|---|---|---|---|---|---|---|---|
| Activity | male | female | person | ||||||
| percentage of persons | minutes spent on an average in a day per person | minutes spent on an average in a day per participant | percentage of persons | minutes spent on an average in a day per person | minutes spent on an average in a day per participant | percentage of persons | minutes spent on an average in a day per person | minutes spent on an average in a day per participant | |
| (1) | (2) | (3) | (4) | (5) | (6) | (7) | (8) | (9) | (10) |
| rural | |||||||||
| self maintenance etc | 100.0 | 1136 | 1136 | 100.0 | 1054 | 1054 | 100.0 | 1094 | 1094 |
| unpaid activities: SNA activities | 10.6 | 6 | 56 | 9.2 | 5 | 58 | 9.9 | 6 | 57 |
| unpaid activities:Non SNA activities | 49.5 | 43 | 87 | 86.4 | 249 | 289 | 68.4 | 149 | 217 |
| all unpaid activities | 53.2 | 49 | 93 | 86.5 | 255 | 295 | 70.2 | 154 | 220 |
| paid activities | 66.7 | 255 | 381 | 42.6 | 131 | 309 | 54.4 | 192 | 352 |
| all unapid/paid acivities | 77.5 | 304 | 392 | 86.9 | 386 | 445 | 82.3 | 346 | 420 |
| urban | |||||||||
| self maintenance etc | 100.0 | 1136 | 1136 | 100.0 | 1089 | 1089 | 100.0 | 1113 | 1113 |
| unpaid activities: SNA activities | 4.2 | 2 | 37 | 3.7 | 2 | 46 | 4.0 | 2 | 41 |
| unpaid activities:Non SNA activities | 52.1 | 46 | 89 | 81.2 | 264 | 325 | 66.4 | 153 | 231 |
| all unpaid activities | 53.3 | 48 | 90 | 81.3 | 266 | 327 | 67.0 | 155 | 231 |
| paid activities | 58.5 | 257 | 438 | 23.7 | 85 | 359 | 41.5 | 173 | 416 |
| all unapid/paid acivities | 75.0 | 304 | 406 | 83.3 | 351 | 422 | 79.0 | 327 | 414 |
| rural+urban | |||||||||
| self maintenance etc | 100.0 | 1136 | 1136 | 100.0 | 1068 | 1068 | 100.0 | 1102 | 1102 |
| unpaid activities: SNA activities | 7.9 | 4 | 52 | 6.9 | 4 | 56 | 7.4 | 4 | 54 |
| unpaid activities:Non SNA activities | 50.7 | 45 | 88 | 84.3 | 256 | 303 | 67.5 | 150 | 223 |
| all unpaid activities | 53.3 | 49 | 91 | 84.4 | 259 | 308 | 68.9 | 154 | 224 |
| paid activities | 63.2 | 255 | 404 | 34.8 | 113 | 323 | 49.0 | 184 | 375 |
| all unapid/paid acivities | 76.4 | 304 | 398 | 85.4 | 372 | 436 | 80.9 | 338 | 418 |
Note : The activities under ‘self development/ self care/ self maintenance, etc.’ are ‘residual other activities’
Statement 17.1: Percentage of persons and minutes spent in a day on an average per person/per participant of age 6 years and above in unpaid activities paid activities and other activities irrespective of whether the activity was a major activity or not (considering all the activities in a time slot)
| {Tripura} | |||||||||
|---|---|---|---|---|---|---|---|---|---|
| Activity | male | female | person | ||||||
| percentage of persons | minutes spent on an average in a day per person | minutes spent on an average in a day per participant | percentage of persons | minutes spent on an average in a day per person | minutes spent on an average in a day per participant | percentage of persons | minutes spent on an average in a day per person | minutes spent on an average in a day per participant | |
| (1) | (2) | (3) | (4) | (5) | (6) | (7) | (8) | (9) | (10) |
| rural | |||||||||
| self maintenance etc | 100.0 | 1133 | 1133 | 100.0 | 1096 | 1096 | 100.0 | 1114 | 1114 |
| unpaid activities: SNA activities | 18.4 | 20 | 110 | 37.9 | 38 | 101 | 28.4 | 29 | 104 |
| unpaid activities:Non SNA activities | 49.0 | 48 | 99 | 85.2 | 261 | 307 | 67.4 | 157 | 232 |
| all unpaid activities | 54.8 | 69 | 125 | 85.5 | 299 | 350 | 70.4 | 186 | 264 |
| paid activities | 64.4 | 239 | 370 | 16.6 | 45 | 270 | 40.1 | 140 | 349 |
| all unapid/paid acivities | 77.8 | 307 | 395 | 86.2 | 344 | 399 | 82.1 | 326 | 397 |
| urban | |||||||||
| self maintenance etc | 100.0 | 1151 | 1151 | 100.0 | 1130 | 1130 | 100.0 | 1140 | 1140 |
| unpaid activities: SNA activities | 6.8 | 7 | 100 | 10.7 | 6 | 60 | 8.8 | 7 | 75 |
| unpaid activities:Non SNA activities | 46.3 | 45 | 97 | 82.9 | 258 | 311 | 65.2 | 155 | 237 |
| all unpaid activities | 48.1 | 52 | 107 | 83.1 | 264 | 318 | 66.2 | 161 | 244 |
| paid activities | 56.6 | 238 | 420 | 15.1 | 46 | 304 | 35.2 | 139 | 394 |
| all unapid/paid acivities | 73.0 | 289 | 396 | 84.2 | 310 | 368 | 78.8 | 300 | 381 |
| rural+urban | |||||||||
| self maintenance etc | 100.0 | 1137 | 1137 | 100.0 | 1103 | 1103 | 100.0 | 1120 | 1120 |
| unpaid activities: SNA activities | 15.9 | 17 | 109 | 31.9 | 31 | 98 | 24.1 | 24 | 101 |
| unpaid activities:Non SNA activities | 48.4 | 48 | 99 | 84.7 | 260 | 307 | 66.9 | 156 | 234 |
| all unpaid activities | 53.4 | 65 | 122 | 84.9 | 291 | 343 | 69.5 | 181 | 260 |
| paid activities | 62.7 | 238 | 380 | 16.3 | 45 | 277 | 39.0 | 140 | 358 |
| all unapid/paid acivities | 76.8 | 303 | 395 | 85.7 | 337 | 393 | 81.4 | 320 | 394 |
Note : The activities under ‘self development’ self care/ self maintenance, etc.’ are ‘residual other activities’
Statement 17.1: Percentage of persons and minutes spent in a day on an average per person/per participant of age 6 years and above in unpaid activities paid activities and other activities irrespective of whether the activity was a major activity or not (considering all the activities in a time slot)
| Uttar Pradesh | |||||||||
|---|---|---|---|---|---|---|---|---|---|
| Activity | male | female | person | ||||||
| percentage of persons | minutes spent on an average in a day per person | minutes spent on an average in a day per participant | percentage of persons | minutes spent on an average in a day per person | minutes spent on an average in a day per participant | percentage of persons | minutes spent on an average in a day per person | minutes spent on an average in a day per participant | |
| (1) | (2) | (3) | (4) | (5) | (6) | (7) | (8) | (9) | (10) |
| rura | |||||||||
| self maintenance etc | 100.0 | 1132 | 1132 | 100.0 | 1065 | 1065 | 100.0 | 1098 | 1098 |
| unpaid activities: SNA activities | 23.6 | 40 | 171 | 21.9 | 30 | 136 | 22.7 | 35 | 154 |
| unpaid activities:Non SNA activities | 38.8 | 39 | 101 | 83.0 | 313 | 377 | 61.2 | 178 | 290 |
| all unpaid activities | 50.3 | 79 | 158 | 83.9 | 342 | 408 | 67.3 | 213 | 316 |
| paid activities | 56.6 | 228 | 403 | 14.0 | 32 | 231 | 35.0 | 129 | 369 |
| all unapid/paid acivities | 73.6 | 308 | 418 | 84.6 | 375 | 443 | 79.2 | 342 | 431 |
| urban | |||||||||
| self maintenance etc | 100.0 | 1117 | 1117 | 100.0 | 1089 | 1089 | 100.0 | 1103 | 1103 |
| unpaid activities: SNA activities | 3.5 | 4 | 125 | 3.8 | 4 | 115 | 3.7 | 4 | 120 |
| unpaid activities:Non SNA activities | 39.2 | 40 | 102 | 82.7 | 312 | 378 | 60.5 | 173 | 286 |
| all unpaid activities | 40.8 | 44 | 109 | 82.9 | 317 | 382 | 61.4 | 178 | 289 |
| paid activities | 60.5 | 279 | 461 | 10.2 | 35 | 340 | 35.9 | 159 | 444 |
| all unapid/paid acivities | 73.0 | 323 | 443 | 83.6 | 351 | 420 | 78.2 | 337 | 431 |
| rural+urban | |||||||||
| self maintenance etc | 100.0 | 1129 | 1129 | 100.0 | 1070 | 1070 | 100.0 | 1099 | 1099 |
| unpaid activities: SNA activities | 19.3 | 33 | 169 | 18.3 | 25 | 135 | 18.8 | 29 | 153 |
| unpaid activities:Non SNA activities | 38.9 | 39 | 101 | 82.9 | 313 | 377 | 61.0 | 177 | 289 |
| all unpaid activities | 48.3 | 72 | 149 | 83.7 | 337 | 403 | 66.1 | 205 | 311 |
| paid activities | 57.4 | 239 | 416 | 13.2 | 33 | 248 | 35.2 | 135 | 384 |
| all unapid/paid acivities | 73.5 | 311 | 423 | 84.4 | 370 | 438 | 79.0 | 341 | 431 |
Note : The activities under ‘self development’ self care/ self maintenance, etc.’ are ‘residual other activities’
Statement 17.1: Percentage of persons and minutes spent in a day on an average per person/per participant of age 6 years and above in unpaid activities , paid activities and other activities irrespective of whether the activity was a major activity or not (considering all the activities in a time slot)
| Uttarakhand | |||||||||
|---|---|---|---|---|---|---|---|---|---|
| Activity | male | female | person | ||||||
| percentage of persons | minutes spent on an average in a day per person | minutes spent on an average in a day per participant | percentage of persons | minutes spent on an average in a day per person | minutes spent on an average in a day per participant | percentage of persons | minutes spent on an average in a day per person | minutes spent on an average in a day per participant | |
| (1) | (2) | (3) | (4) | (5) | (6) | (7) | (8) | (9) | (10) |
| rural | |||||||||
| self maintenance etc | 100.0 | 1176 | 1176 | 100.0 | 1105 | 1105 | 100.0 | 1141 | 1141 |
| unpaid activities: SNA activities | 17.5 | 32 | 180 | 36.4 | 70 | 192 | 27.0 | 51 | 188 |
| unpaid activities:Non SNA activities | 43.3 | 40 | 91 | 83.6 | 243 | 291 | 63.5 | 142 | 223 |
| all unpaid activities | 51.2 | 71 | 139 | 85.0 | 313 | 368 | 68.1 | 192 | 282 |
| paid activities | 50.1 | 193 | 384 | 8.4 | 22 | 263 | 29.1 | 107 | 367 |
| all unapid/paid acivities | 74.1 | 264 | 356 | 85.7 | 335 | 391 | 79.9 | 299 | 375 |
| urban | |||||||||
| self maintenance etc | 100.0 | 1157 | 1157 | 100.0 | 1139 | 1139 | 100.0 | 1149 | 1149 |
| unpaid activities: SNA activities | 2.1 | 3 | 121 | 6.2 | 5 | 75 | 4.1 | 4 | 87 |
| unpaid activities:Non SNA activities | 49.0 | 46 | 94 | 83.3 | 256 | 307 | 65.8 | 149 | 226 |
| all unpaid activities | 49.6 | 49 | 98 | 83.4 | 261 | 313 | 66.2 | 153 | 230 |
| paid activities | 56.4 | 234 | 415 | 11.9 | 40 | 334 | 34.6 | 139 | 401 |
| all unapid/paid acivities | 75.9 | 283 | 372 | 84.4 | 301 | 356 | 80.1 | 291 | 364 |
| rural+urban | |||||||||
| self maintenance etc | 100.0 | 1171 | 1171 | 100.0 | 1114 | 1114 | 100.0 | 1143 | 1143 |
| unpaid activities: SNA activities | 13.4 | 24 | 178 | 28.6 | 53 | 185 | 21.0 | 38 | 183 |
| unpaid activities:Non SNA activities | 44.8 | 41 | 92 | 83.5 | 246 | 295 | 64.1 | 144 | 224 |
| all unpaid activities | 50.8 | 65 | 128 | 84.6 | 299 | 354 | 67.6 | 182 | 269 |
| paid activities | 51.7 | 204 | 393 | 9.3 | 27 | 286 | 30.6 | 115 | 377 |
| all unapid/paid acivities | 74.6 | 269 | 360 | 85.4 | 326 | 382 | 80.0 | 297 | 372 |
Note : The activities under ‘self development/ self care/ self maintenance, etc.’ are ‘residual other activities’
Statement 17.1: Percentage of persons and minutes spent in a day on an average per person/per participant of age 6 years and above in unpaid activities paid activities and other activities irrespective of whether the activity was a major activity or not (considering all the activities in a time slot)
| West Bengal | |||||||||
|---|---|---|---|---|---|---|---|---|---|
| Activity | male | female | person | ||||||
| percentage of persons | minutes spent on an average in a day per person | minutes spent on an average in a day per participant | percentage of persons | minutes spent on an average in a day per person | minutes spent on an average in a day per participant | percentage of persons | minutes spent on an average in a day per person | minutes spent on an average in a day per participant | |
| (1) | (2) | (3) | (4) | (5) | (6) | (7) | (8) | (9) | (10) |
| rura | |||||||||
| self maintenance etc | 100.0 | 1139 | 1139 | 100.0 | 1075 | 1075 | 100.0 | 1107 | 1107 |
| unpaid activities: SNA activities | 12.6 | 15 | 119 | 32.7 | 26 | 81 | 22.8 | 21 | 91 |
| unpaid activities:Non SNA activities | 40.3 | 40 | 100 | 82.9 | 295 | 356 | 61.8 | 169 | 273 |
| all unpaid activities | 45.3 | 55 | 122 | 83.2 | 322 | 386 | 64.5 | 190 | 294 |
| paid activities | 65.1 | 246 | 377 | 17.5 | 43 | 248 | 41.1 | 144 | 350 |
| all unapid/paid acivities | 76.7 | 301 | 393 | 83.8 | 365 | 436 | 80.3 | 333 | 415 |
| urban | |||||||||
| self maintenance etc | 100.0 | 1121 | 1121 | 100.0 | 1094 | 1094 | 100.0 | 1107 | 1107 |
| unpaid activities: SNA activities | 4.0 | 3 | 77 | 13.2 | 6 | 48 | 8.6 | 5 | 55 |
| unpaid activities:Non SNA activities | 41.7 | 42 | 101 | 81.3 | 276 | 339 | 61.6 | 159 | 259 |
| all unpaid activities | 43.0 | 45 | 105 | 81.5 | 282 | 346 | 62.4 | 164 | 263 |
| paid activities | 61.2 | 274 | 448 | 20.2 | 64 | 316 | 40.6 | 169 | 415 |
| all unapid/paid acivities | 75.1 | 319 | 425 | 83.8 | 346 | 413 | 79.5 | 333 | 419 |
| rural+urban | |||||||||
| self maintenance etc | 100.0 | 1133 | 1133 | 100.0 | 1081 | 1081 | 100.0 | 1107 | 1107 |
| unpaid activities: SNA activities | 10.0 | 11 | 114 | 26.8 | 20 | 76 | 18.5 | 16 | 86 |
| unpaid activities:Non SNA activities | 40.8 | 41 | 100 | 82.4 | 289 | 351 | 61.8 | 166 | 269 |
| all unpaid activities | 44.6 | 52 | 117 | 82.7 | 310 | 374 | 63.8 | 182 | 285 |
| paid activities | 63.9 | 254 | 398 | 18.3 | 50 | 271 | 40.9 | 151 | 369 |
| all unapid/paid acivities | 76.2 | 307 | 402 | 83.8 | 359 | 429 | 80.0 | 333 | 416 |
Note : The activities under ‘self development’ self care/ self maintenance, etc.’ are ‘residual other activities’
Statement 17.1: Percentage of persons and minutes spent in a day on an average per person/per participant of age 6 years and above in unpaid activities paid activities and other activities irrespective of whether the activity was a major activity or not (considering all the activities in a time slot)
| A \& N Islands | |||||||||
|---|---|---|---|---|---|---|---|---|---|
| Activity | male | female | person | ||||||
| percentage of persons | minutes spent on an average in a day per person | minutes spent on an average in a day per participant | percentage of persons | minutes spent on an average in a day per person | minutes spent on an average in a day per participant | percentage of persons | minutes spent on an average in a day per person | minutes spent on an average in a day per participant | |
| (1) | (2) | (3) | (4) | (5) | (6) | (7) | (8) | (9) | (10) |
| rural | |||||||||
| self maintenance etc | 100.0 | 1114 | 1114 | 100.0 | 1071 | 1071 | 100.0 | 1094 | 1094 |
| unpaid activities: SNA activities | 31.1 | 46 | 150 | 35.9 | 45 | 126 | 33.3 | 46 | 138 |
| unpaid activities:Non SNA activities | 39.5 | 39 | 99 | 85.5 | 268 | 313 | 60.7 | 145 | 238 |
| all unpaid activities | 55.0 | 86 | 155 | 86.9 | 313 | 360 | 69.7 | 190 | 273 |
| paid activities | 56.0 | 240 | 430 | 14.0 | 56 | 399 | 36.6 | 155 | 424 |
| all unapid/paid acivities | 75.2 | 326 | 433 | 87.3 | 369 | 422 | 80.8 | 346 | 428 |
| urban | |||||||||
| self maintenance etc | 100.0 | 1158 | 1158 | 100.0 | 1133 | 1133 | 100.0 | 1146 | 1146 |
| unpaid activities: SNA activities | 2.3 | 3 | 125 | 15.3 | 4 | 27 | 8.5 | 3 | 41 |
| unpaid activities:Non SNA activities | 34.8 | 31 | 89 | 77.8 | 222 | 286 | 55.3 | 122 | 221 |
| all unpaid activities | 35.6 | 34 | 95 | 77.8 | 226 | 291 | 55.8 | 126 | 225 |
| paid activities | 50.9 | 248 | 488 | 19.0 | 81 | 425 | 35.7 | 168 | 472 |
| all unapid/paid acivities | 65.8 | 282 | 429 | 78.4 | 307 | 392 | 71.8 | 294 | 410 |
| rural+urban | |||||||||
| self maintenance etc | 100.0 | 1130 | 1130 | 100.0 | 1095 | 1095 | 100.0 | 1114 | 1114 |
| unpaid activities: SNA activities | 20.6 | 31 | 149 | 28.1 | 30 | 106 | 24.1 | 30 | 125 |
| unpaid activities:Non SNA activities | 37.8 | 36 | 96 | 82.6 | 250 | 303 | 58.7 | 136 | 232 |
| all unpaid activities | 48.0 | 67 | 139 | 83.4 | 280 | 336 | 64.5 | 166 | 258 |
| paid activities | 54.1 | 243 | 449 | 15.9 | 65 | 411 | 36.3 | 160 | 442 |
| all unapid/paid acivities | 71.8 | 310 | 432 | 83.9 | 345 | 412 | 77.5 | 326 | 422 |
Note : The activities under ‘self development/ self care/ self maintenance, etc.’ are ‘residual other activities’
Statement 17.1: Percentage of persons and minutes spent in a day on an average per person/per participant of age 6 years and above in unpaid activities paid activities and other activities irrespective of whether the activity was a major activity or not (considering all the activities in a time slot)
| Chandigarh | |||||||||
|---|---|---|---|---|---|---|---|---|---|
| Activity | male | female | person | ||||||
| percentage of persons | minutes spent on an average in a day per person | minutes spent on an average in a day per participant | percentage of persons | minutes spent on an average in a day per person | minutes spent on an average in a day per participant | percentage of persons | minutes spent on an average in a day per person | minutes spent on an average in a day per participant | |
| (1) | (2) | (3) | (4) | (5) | (6) | (7) | (8) | (9) | (10) |
| urban | |||||||||
| self maintenance etc | 100.0 | 1080 | 1080 | 100.0 | 1109 | 1109 | 100.0 | 1094 | 1094 |
| unpaid activities: SNA activities | 0.2 | 0 | 45 | 2.3 | 2 | 93 | 1.2 | 1 | 88 |
| unpaid activities:Non SNA activities | 43.3 | 49 | 112 | 80.1 | 247 | 308 | 60.7 | 142 | 234 |
| all unpaid activities | 43.6 | 49 | 112 | 80.5 | 249 | 309 | 61.0 | 143 | 235 |
| paid activities | 66.1 | 311 | 471 | 22.1 | 82 | 373 | 45.2 | 203 | 449 |
| all unapid/paid acivities | 77.1 | 360 | 467 | 81.7 | 331 | 405 | 79.3 | 346 | 437 |
| rural+urban | |||||||||
| self maintenance etc | 100.0 | 1080 | 1080 | 100.0 | 1109 | 1109 | 100.0 | 1094 | 1094 |
| unpaid activities: SNA activities | 0.2 | 0 | 45 | 2.3 | 2 | 93 | 1.2 | 1 | 88 |
| unpaid activities:Non SNA activities | 43.3 | 49 | 112 | 80.1 | 247 | 308 | 60.7 | 142 | 234 |
| all unpaid activities | 43.6 | 49 | 112 | 80.5 | 249 | 309 | 61.0 | 143 | 235 |
| paid activities | 66.1 | 311 | 471 | 22.1 | 82 | 373 | 45.2 | 203 | 449 |
| all unapid/paid acivities | 77.1 | 360 | 467 | 81.7 | 331 | 405 | 79.3 | 346 | 437 |
Note : The activities under ‘self development’ self care/ self maintenance, etc.’ are ‘residual other activities’
Statement 17.1: Percentage of persons and minutes spent in a day on an average per person/per participant of age 6 years and above in unpaid activities paid activities and other activities irrespective of whether the activity was a major activity or not (considering all the activities in a time slot)
| (1) | (2) | (3) | (4) | (5) | (6) | (7) | (8) | (9) | (10) |
|---|---|---|---|---|---|---|---|---|---|
| rural | |||||||||
| self maintenance etc | 100.0 | 1095 | 1095 | 100.0 | 1056 | 1056 | 100.0 | 1076 | 1076 |
| unpaid activities: SNA activities | 5.4 | 3 | 47 | 3.8 | 5 | 120 | 4.9 | 4 | 75 |
| unpaid activities:Non SNA activities | 47.8 | 47 | 99 | 83.1 | 237 | 286 | 62.6 | 127 | 203 |
| all unpaid activities | 49.0 | 50 | 102 | 83.3 | 242 | 290 | 63.4 | 131 | 206 |
| paid activities | 72.2 | 418 | 579 | 33.2 | 154 | 464 | 56.0 | 308 | 550 |
| all unapid/paid acivities | 78.7 | 468 | 595 | 83.5 | 396 | 474 | 80.7 | 438 | 543 |
| rural+urban | |||||||||
| self maintenance etc | 100.0 | 1013 | 1013 | 100.0 | 1049 | 1049 | 100.0 | 1029 | 1029 |
| unpaid activities: SNA activities | 6.7 | 6 | 87 | 13.2 | 15 | 114 | 9.7 | 10 | 105 |
| unpaid activities:Non SNA activities | 43.6 | 41 | 93 | 82.9 | 226 | 273 | 61.0 | 122 | 201 |
| all unpaid activities | 45.6 | 46 | 102 | 83.0 | 241 | 291 | 62.2 | 133 | 213 |
| paid activities | 67.4 | 380 | 565 | 34.1 | 150 | 439 | 52.7 | 279 | 528 |
| all unapid/paid acivities | 75.9 | 427 | 563 | 83.9 | 391 | 466 | 79.4 | 411 | 518 |
Note : The activities under ‘self development’ self care/ self maintenance, etc.’ are ‘residual other activities’
Statement 17.1: Percentage of persons and minutes spent in a day on an average per person/per participant of age 6 years and above in unpaid activities paid activities and other activities irrespective of whether the activity was a major activity or not (considering all the activities in a time slot)
| {Jammu \& Kashmir} | |||||||||
|---|---|---|---|---|---|---|---|---|---|
| Activity | male | female | person | ||||||
| percentage of persons | minutes spent on an average in a day per person | minutes spent on an average in a day per participant | percentage of persons | minutes spent on an average in a day per person | minutes spent on an average in a day per participant | percentage of persons | minutes spent on an average in a day per person | minutes spent on an average in a day per participant | |
| (1) | (2) | (3) | (4) | (5) | (6) | (7) | (8) | (9) | (10) |
| rural | |||||||||
| self maintenance etc | 100.0 | 1167 | 1167 | 100.0 | 1114 | 1114 | 100.0 | 1141 | 1141 |
| unpaid activities: SNA activities | 26.5 | 47 | 177 | 38.1 | 46 | 121 | 32.1 | 47 | 145 |
| unpaid activities:Non SNA activities | 32.4 | 29 | 90 | 79.0 | 268 | 339 | 55.0 | 145 | 264 |
| all unpaid activities | 51.7 | 76 | 147 | 80.2 | 314 | 392 | 65.5 | 192 | 292 |
| paid activities | 53.0 | 197 | 372 | 4.2 | 12 | 284 | 29.4 | 107 | 366 |
| all unapid/paid acivities | 73.6 | 273 | 371 | 80.7 | 326 | 405 | 77.0 | 299 | 388 |
| urban | |||||||||
| self maintenance etc | 100.0 | 1124 | 1124 | 100.0 | 1082 | 1082 | 100.0 | 1104 | 1104 |
| unpaid activities: SNA activities | 7.9 | 10 | 132 | 9.5 | 11 | 118 | 8.6 | 11 | 125 |
| unpaid activities:Non SNA activities | 28.1 | 21 | 75 | 80.9 | 293 | 363 | 53.6 | 153 | 285 |
| all unpaid activities | 32.9 | 31 | 95 | 81.1 | 304 | 375 | 56.2 | 163 | 291 |
| paid activities | 63.0 | 285 | 453 | 17.0 | 54 | 315 | 40.7 | 173 | 425 |
| all unapid/paid acivities | 73.6 | 316 | 430 | 81.9 | 358 | 437 | 77.6 | 336 | 434 |
| rural+urban | |||||||||
| self maintenance etc | 100.0 | 1156 | 1156 | 100.0 | 1106 | 1106 | 100.0 | 1131 | 1131 |
| unpaid activities: SNA activities | 21.7 | 38 | 173 | 30.8 | 37 | 121 | 26.1 | 37 | 143 |
| unpaid activities:Non SNA activities | 31.3 | 27 | 86 | 79.5 | 275 | 345 | 54.7 | 147 | 269 |
| all unpaid activities | 46.9 | 65 | 138 | 80.4 | 312 | 388 | 63.1 | 184 | 292 |
| paid activities | 55.6 | 220 | 396 | 7.5 | 23 | 302 | 32.3 | 124 | 385 |
| all unapid/paid acivities | 73.6 | 284 | 386 | 81.0 | 334 | 413 | 77.2 | 309 | 400 |
Note : The activities under ‘self development/ self care/ self maintenance, etc.’ are ‘residual other activities’
Statement 17.1: Percentage of persons and minutes spent in a day on an average per person/per participant of age 6 years and above in unpaid activities paid activities and other activities irrespective of whether the activity was a major activity or not (considering all the activities in a time slot)
| Ladakh | |||||||||
|---|---|---|---|---|---|---|---|---|---|
| Activity | male | female | person | ||||||
| percentage of persons | minutes spent on an average in a day per person | minutes spent on an average in a day per participant | percentage of persons | minutes spent on an average in a day per person | minutes spent on an average in a day per participant | percentage of persons | minutes spent on an average in a day per person | minutes spent on an average in a day per participant | |
| (1) | (2) | (3) | (4) | (5) | (6) | (7) | (8) | (9) | (10) |
| rura | |||||||||
| self maintenance etc | 100.0 | 1157 | 1157 | 100.0 | 1060 | 1060 | 100.0 | 1111 | 1111 |
| unpaid activities: SNA activities | 16.2 | 20 | 125 | 35.0 | 39 | 111 | 25.1 | 29 | 116 |
| unpaid activities:Non SNA activities | 47.8 | 38 | 81 | 84.7 | 325 | 384 | 65.3 | 175 | 268 |
| all unpaid activities | 59.1 | 59 | 99 | 85.4 | 364 | 427 | 71.6 | 204 | 285 |
| paid activities | 62.1 | 224 | 361 | 5.5 | 16 | 282 | 35.2 | 125 | 355 |
| all unapid/paid acivities | 78.7 | 283 | 360 | 85.9 | 380 | 442 | 82.1 | 329 | 401 |
| urban | |||||||||
| self maintenance etc | 100.0 | 1146 | 1146 | 100.0 | 1052 | 1052 | 100.0 | 1103 | 1103 |
| unpaid activities: SNA activities | 3.1 | 4 | 118 | 11.0 | 9 | 79 | 6.7 | 6 | 88 |
| unpaid activities:Non SNA activities | 43.7 | 43 | 98 | 88.8 | 341 | 385 | 64.4 | 180 | 279 |
| all unpaid activities | 44.6 | 46 | 104 | 88.8 | 350 | 394 | 64.9 | 186 | 286 |
| paid activities | 62.3 | 247 | 397 | 11.4 | 38 | 334 | 38.9 | 151 | 388 |
| all unapid/paid acivities | 74.7 | 294 | 393 | 89.1 | 388 | 436 | 81.3 | 337 | 415 |
| rural+urban | |||||||||
| self maintenance etc | 100.0 | 1156 | 1156 | 100.0 | 1059 | 1059 | 100.0 | 1110 | 1110 |
| unpaid activities: SNA activities | 14.7 | 18 | 125 | 32.4 | 36 | 110 | 23.1 | 27 | 115 |
| unpaid activities:Non SNA activities | 47.3 | 39 | 82 | 85.2 | 327 | 384 | 65.2 | 175 | 269 |
| all unpaid activities | 57.5 | 57 | 100 | 85.8 | 363 | 423 | 70.9 | 202 | 285 |
| paid activities | 62.1 | 227 | 365 | 6.1 | 18 | 293 | 35.6 | 128 | 359 |
| all unapid/paid acivities | 78.2 | 284 | 363 | 86.2 | 381 | 442 | 82.0 | 330 | 402 |
Note : The activities under ‘self development’ self care/ self maintenance, etc.’ are ‘residual other activities’
Statement 17.1: Percentage of persons and minutes spent in a day on an average per person/per participant of age 6 years and above in unpaid activities paid activities and other activities irrespective of whether the activity was a major activity or not (considering all the activities in a time slot)
| Lakshadweep | |||||||||
|---|---|---|---|---|---|---|---|---|---|
| Activity | male | female | person | ||||||
| percentage of persons | minutes spent on an average in a day per person | minutes spent on an average in a day per participant | percentage of persons | minutes spent on an average in a day per person | minutes spent on an average in a day per participant | percentage of persons | minutes spent on an average in a day per person | minutes spent on an average in a day per participant | |
| (1) | (2) | (3) | (4) | (5) | (6) | (7) | (8) | (9) | (10) |
| rural | |||||||||
| self maintenance etc | 100.0 | 1169 | 1169 | 100.0 | 1094 | 1094 | 100.0 | 1129 | 1129 |
| unpaid activities: SNA activities | 14.2 | 22 | 154 | 12.8 | 10 | 79 | 13.5 | 16 | 116 |
| unpaid activities:Non SNA activities | 44.4 | 40 | 89 | 87.1 | 298 | 342 | 67.0 | 176 | 263 |
| all unpaid activities | 49.9 | 61 | 123 | 87.1 | 308 | 354 | 69.6 | 192 | 276 |
| paid activities | 52.4 | 210 | 401 | 14.2 | 37 | 264 | 32.2 | 119 | 369 |
| all unapid/paid acivities | 78.2 | 271 | 347 | 88.3 | 346 | 391 | 83.6 | 311 | 372 |
| urban | |||||||||
| self maintenance etc | 100.0 | 1160 | 1160 | 100.0 | 1113 | 1113 | 100.0 | 1134 | 1134 |
| unpaid activities: SNA activities | 14.7 | 17 | 118 | 10.0 | 8 | 78 | 12.1 | 12 | 100 |
| unpaid activities:Non SNA activities | 52.2 | 52 | 101 | 85.1 | 279 | 328 | 70.4 | 178 | 253 |
| all unpaid activities | 58.6 | 70 | 119 | 85.4 | 287 | 336 | 73.4 | 190 | 259 |
| paid activities | 51.3 | 210 | 409 | 14.5 | 40 | 274 | 31.0 | 116 | 374 |
| all unapid/paid acivities | 79.9 | 280 | 350 | 85.4 | 327 | 383 | 82.9 | 306 | 369 |
| rural+urban | |||||||||
| self maintenance etc | 100.0 | 1162 | 1162 | 100.0 | 1109 | 1109 | 100.0 | 1133 | 1133 |
| unpaid activities: SNA activities | 14.6 | 18 | 126 | 10.6 | 8 | 78 | 12.4 | 13 | 104 |
| unpaid activities:Non SNA activities | 50.5 | 50 | 98 | 85.5 | 283 | 331 | 69.7 | 178 | 255 |
| all unpaid activities | 56.7 | 68 | 120 | 85.7 | 291 | 340 | 72.6 | 190 | 262 |
| paid activities | 51.6 | 210 | 407 | 14.4 | 39 | 272 | 31.2 | 116 | 373 |
| all unapid/paid acivities | 79.5 | 278 | 349 | 86.0 | 331 | 385 | 83.1 | 307 | 369 |
Note : The activities under ‘self development/ self care/ self maintenance, etc.’ are ‘residual other activities’
Statement 17.1: Percentage of persons and minutes spent in a day on an average per person/per participant of age 6 years and above in unpaid activities paid activities and other activities irrespective of whether the activity was a major activity or not (considering all the activities in a time slot)
| Puducherry | |||||||||
|---|---|---|---|---|---|---|---|---|---|
| Activity | male | female | person | ||||||
| percentage of persons | minutes spent on an average in a day per person | minutes spent on an average in a day per participant | percentage of persons | minutes spent on an average in a day per person | minutes spent on an average in a day per participant |
percentage of persons | minutes spent on an average in a day per person | minutes spent on an average in a day per participant | |
| $(1)$ | $(2)$ | $(3)$ | $(4)$ | $(5)$ | $(6)$ | $(7)$ | $(8)$ | $(9)$ | $(10)$ |
| rural | |||||||||
| self maintenance etc | 100.0 | 1067 | 1067 | 100.0 | 1015 | 1015 | 100.0 | 1040 | 1040 |
| unpaid activities: SNA activities | 12.5 | 7 | 57 | 23.6 | 12 | 52 | 18.3 | 10 | 53 |
| unpaid activities:Non SNA activities | 57.9 | 72 | 124 | 88.9 | 306 | 344 | 74.1 | 194 | 262 |
| all unpaid activities | 60.7 | 79 | 130 | 89.2 | 318 | 357 | 75.6 | 204 | 270 |
| paid activities | 60.4 | 294 | 488 | 26.1 | 107 | 409 | 42.5 | 196 | 462 |
| all unapid/paid acivities | 81.4 | 373 | 459 | 90.3 | 425 | 471 | 86.0 | 400 | 465 |
| urban | |||||||||
| self maintenance etc | 100.0 | 1129 | 1129 | 100.0 | 1074 | 1074 | 100.0 | 1099 | 1099 |
| unpaid activities: SNA activities | 9.2 | 5 | 54 | 16.3 | 9 | 54 | 13.1 | 7 | 54 |
| unpaid activities:Non SNA activities | 48.7 | 61 | 124 | 83.8 | 281 | 336 | 67.8 | 181 | 267 |
| all unpaid activities | 51.3 | 65 | 128 | 83.8 | 290 | 346 | 69.0 | 188 | 272 |
| paid activities | 51.0 | 246 | 482 | 19.6 | 76 | 388 | 33.9 | 153 | 452 |
| all unapid/paid acivities | 76.2 | 311 | 409 | 85.2 | 366 | 430 | 81.1 | 341 | 421 |
| rural+urban | |||||||||
| self maintenance etc | 100.0 | 1108 | 1108 | 100.0 | 1055 | 1055 | 100.0 | 1079 | 1079 |
| unpaid activities: SNA activities | 10.4 | 6 | 55 | 18.7 | 10 | 53 | 14.8 | 8 | 54 |
| unpaid activities:Non SNA activities | 51.8 | 64 | 124 | 85.4 | 289 | 339 | 69.9 | 185 | 265 |
| all unpaid activities | 54.5 | 70 | 129 | 85.5 | 299 | 350 | 71.2 | 193 | 271 |
| paid activities | 54.2 | 262 | 484 | 21.7 | 86 | 396 | 36.7 | 168 | 456 |
| all unapid/paid acivities | 78.0 | 332 | 426 | 86.8 | 385 | 443 | 82.7 | 361 | 436 |
Note : The activities under ‘self development/ self care/ self maintenance, etc.’ are ‘residual other activities’
Statement 17.1: Percentage of persons and minutes spent in a day on an average per person/per participant of age 6 years and above in unpaid activities paid activities and other activities irrespective of whether the activity was a major activity or not (considering all the activities in a time slot)
| All India | |||||||||
|---|---|---|---|---|---|---|---|---|---|
| Activity | male | female | person | ||||||
| percentage of persons | minutes spent on an average in a day per person | minutes spent on an average in a day per participant | percentage of persons | minutes spent on an average in a day per person | minutes spent on an average in a day per participant | percentage of persons | minutes spent on an average in a day per person | minutes spent on an average in a day per participant | |
| (1) | (2) | (3) | (4) | (5) | (6) | (7) | (8) | (9) | (10) |
| rural | |||||||||
| self maintenance etc | 100.0 | 1140 | 1140 | 100.0 | 1063 | 1063 | 100.0 | 1102 | 1102 |
| unpaid activities: SNA activities | 17.6 | 25 | 143 | 25.9 | 29 | 111 | 21.8 | 27 | 124 |
| unpaid activities:Non SNA activities | 39.0 | 38 | 97 | 83.7 | 286 | 341 | 61.4 | 162 | 264 |
| all unpaid activities | 47.4 | 63 | 133 | 84.4 | 314 | 373 | 65.9 | 189 | 287 |
| paid activities | 60.1 | 237 | 394 | 21.8 | 62 | 285 | 40.9 | 149 | 365 |
| all unapid/paid acivities | 74.3 | 300 | 403 | 85.1 | 377 | 443 | 79.7 | 338 | 424 |
| urban | |||||||||
| self maintenance etc | 100.0 | 1118 | 1118 | 100.0 | 1094 | 1094 | 100.0 | 1106 | 1106 |
| unpaid activities: SNA activities | 3.7 | 3 | 88 | 9.2 | 5 | 59 | 6.4 | 4 | 67 |
| unpaid activities:Non SNA activities | 41.0 | 39 | 94 | 82.7 | 278 | 336 | 61.2 | 155 | 253 |
| all unpaid activities | 42.4 | 42 | 99 | 82.8 | 283 | 342 | 62.1 | 159 | 256 |
| paid activities | 61.2 | 280 | 458 | 18.0 | 63 | 349 | 40.2 | 175 | 434 |
| all unapid/paid acivities | 74.6 | 322 | 432 | 84.3 | 346 | 410 | 79.3 | 334 | 421 |
| rural+urban | |||||||||
| self maintenance etc | 100.0 | 1133 | 1133 | 100.0 | 1073 | 1073 | 100.0 | 1103 | 1103 |
| unpaid activities: SNA activities | 13.2 | 18 | 138 | 20.8 | 22 | 104 | 17.0 | 20 | 117 |
| unpaid activities:Non SNA activities | 39.6 | 38 | 96 | 83.4 | 283 | 340 | 61.4 | 160 | 261 |
| all unpaid activities | 45.8 | 56 | 123 | 83.9 | 305 | 363 | 64.7 | 180 | 278 |
| paid activities | 60.5 | 251 | 414 | 20.6 | 62 | 302 | 40.7 | 157 | 386 |
| all unapid/paid acivities | 74.4 | 307 | 412 | 84.8 | 367 | 433 | 79.6 | 337 | 423 |
Note : The activities under ‘self development’ self care/ self maintenance, etc.’ are ‘residual other activities’
Appendix A: Detailed Tables
| Table | Description |
|---|---|
| No. | |
| 1 | Number of FSU (villages/ blocks/sub-units), households and persons surveyed for each State/ UT |
| 2 | Percentage distribution of household and population for each State/UT |
| 3 | Percentage distribution of persons of age 6 years and above by relationship of the informant with the household member for each day of week |
| 4 | Percentage of persons of age 6 years and above in different 3-digit/ 2-digit/ 1-digit activity code of TUS activity classification in a day as major activity (considering only the major activity of the time slots) |
| 5 | Minutes spent in a day on an average per participant of age 6 years and above in different 3digit/ 2-digit/ 1-digit activity code of TUS activity classification as a major activity (considering only the major activity of the time slots) |
| 6 | Percentage of persons of age 6 years and above in different 3-digit/ 2-digit/ 1-digit activity code of TUS activity classification in a day irrespective of whether it is a major activity or not (considering all the activities in a time slot) |
| 7 | Minutes spent in a day on an average per participant of age 6 years and above in different 3digit/ 2-digit/ 1-digit activity code of TUS activity classification irrespective of whether it is a major activity or not (considering all the activities in a time slot) |
| 8 | Minutes spent in a day on an average per person of age 6 years and above in different 3-digit/ 2-digit/ 1-digit activity code of TUS classification irrespective of whether it is a major activity or not (considering all the activities in a time slot) |
| 9 | Percentage of persons of age 6 years and above in unpaid activities, paid activities and other activities as a major activity (considering only the major activity of the time slots) |
| 10 | Minutes spent in a day on an average per participant of age 6 years and above in unpaid activities, paid activities and other activities as a major activity (considering only the major activity of the time slots) |
| 11 | Minutes spent in a day on an average per person of age 6 years and above in unpaid activities, paid activities and other activities as a major activity (considering only the major activity of the time slots) |
| 12 | Percentage of persons of age 6 years and above in unpaid activities, paid activities and other activities irrespective of whether it is a major activity or not (considering all the activities in a time slot) |
| 13 | Minutes spent in a day spent on an average per person of age 6 years and above in unpaid activities, paid activities and other activities irrespective of whether it is a major activity or not (considering all the activities in a time slot) |
| 14 | Minutes spent in a day on an average per participant of age 6 years and above in unpaid activities, paid activities and other activities irrespective of whether it is a major activity or not (considering all the activities in a time slot) |
Table
Description
No.
15 Percentage of persons of age 6 years and above in different 2-digit/1-digit activity code of TUS activity classification where the activity was a major activity (considering only the major activity of the time slots) for different usual principal activity status of the person
16 Minutes spent in a day on an average per participant of age 6 years and above in different 2-digit/1-digit activity code of TUS activity classification where the activity was a major activity (considering only the major activity of the time slots) for each usual principal activity status of the person
17 Percentage of persons of age 6 years and above in different 2-digit activity code of TUS activity classification in a day irrespective of whether it is a major activity or not (considering all the activities in a time slot) for each usual principal activity status of the person
18 Minutes spent in a day on an average per participant of age 6 years and above in different 2-digit/1-digit activity code of TUS activity classification irrespective of whether it is a major activity or not (considering all the activities in a time slot) for each usual principal activity status of the person
19 Percentage of persons of age 6 years and above in different 2-digit/ 1-digit activity code of TUS activity classification as major activity (considering only the major activity of the time slots) in a day for each marital status of the person
20 Minutes spent in a day on an average per participant of age 6 years and above in different 2-digit/ 1-digit activity code of TUS activity classification as major activity (considering only the major activity of the time slots) for each marital status of the person
21 Percentage of persons of age 6 years and above in different 2-digit/ 1-digit activity code of TUS activity classification in a day irrespective of whether it is a major activity or not (considering all the activities in a time slot) for each marital status of the person
22 Minutes spent in a day on an average per participant of age 6 years and above in different 2-digit/1-digit activity code of TUS activity classification irrespective of whether it is a major activity or not (considering all the activities in a time slot) for each marital status of the person
23 Percentage of persons of age 6 years and above in different 2-digit/ 1-digit activity code of TUS activity classification as major activity (considering only the major activity of the time slots) in a day for different UMPCE quintile classes
24 Minutes spent in a day on an average per participant of age 6 years and above in different 2-digit/1-digit activity code of TUS activity classification where the activity was done as a major activity (considering only the major activity of the time slots) for different UMPCE quintile classes
25 Percentage of persons in different 2-digit/ 1-digit activity code of TUS activity classification irrespective of whether it is a major activity or not (considering all the activities in a time slot) in a day for different UMPCE quintile classes
26 Minutes spent in a day on an average per participant of age 6 years and above in different 2-digit/1-digit activity code of TUS activity classification irrespective of whether it is a major activity or not (considering all the activities in a time slot) for different UMPCE quintile classes
27 Percentage of persons of age 6 years and above in different 2-digit/1-digit activity code of TUS activity classification where the activity was a major activity (considering only the major activity of the time slots) for different level of education
| Table | Description |
|---|---|
| No. | |
| 28 | Minutes spent in a day on an average per participant of age 6 years and above in different 2-digit/1-digit activity code of TUS activity classification where the activity was performed as a major activity (considering only the major activity of the time slots) for different level of education |
| 29 | Percentage of persons of age 6 years and above in different 2-digit/1-digit activity code of TUS activity classification irrespective of whether it is a major activity or not (considering all the activities in a time slot) for different level of education |
| 30 | Minutes spent in a day on an average per participant of age 6 years and above in different 2-digit/1-digit activity code of TUS activity classification irrespective of whether it is a major activity or not (considering all the activities in a time slot) for different level of education |
| 31 | Percentage of persons of age 6 years and above in different 2-digit/ 1-digit activity code of TUS activity classification as major activity (considering only the major activity of the time slots) in a day for different household social groups |
| 32 | Minutes spent in a day on an average per participant of age 6 years and above in different 2-digit/1-digit activity code of TUS activity classification where the activity was done as a major activity (considering only the major activity of the time slots) for different household social groups |
| 33 | Percentage of persons of age 6 years and above in different 2-digit/1-digit activity code of TUS activity classification irrespective of whether it is a major activity or not (considering all the activities in a time slot) in a day for different household social groups |
| 34 | Minutes spent in a day on an average per participant of age 6 years and above in different 2-digit/ 1-digit activity code of TUS activity classification irrespective of whether it is a major activity or not (considering all the activities in a time slot) for different household social groups |
| 35 | Percentage of persons and minutes in a day spent on an average per participant of age 6 years and above in SNA activities, Non-SNA activities and residual other activities where the activity was a major activity (considering only the major activity of the time slots) for each broad principal activity status |
| 36 | Percentage of persons and minutes spent in a day on an average per participant of age 6 years and above in SNA activities, Non-SNA activities and residual other activities irrespective of whether it was a major activity or not (considering all the activities in a time slot) for each broad principal activity status |
| 37 | Percentage of persons and minutes in a day spent on an average per participant of age 6 years and above in SNA activities, Non-SNA activities and residual other activities where the activity was a major activity (considering only the major activity of the time slots) by type of the day |
| 38 | Percentage of persons and minutes spent in a day on an average per participant of age 6 years and above in SNA activities, Non-SNA activities and residual other activities irrespective of whether the activity was a major activity or not (considering all the activities in a time slot) by type of the day |
| 39 | Percentage of persons of age 6 years and above in different unpaid and paid activities where the activity was a major activity (considering only the major activity of the time slots) by place of activity |
| 40 | Minutes spent in a day on an average per participant of age 6 years and above in different unpaid and paid activities where the activity was a major activity (considering only the major activity of the time slots) by place of activity |
| Table | Description |
|---|---|
| No. | |
| 41 | Percentage of persons and minutes spent in a day on an average per person/per participant of age 6 years and above in unpaid activities, paid activities and other activities where the activity was a major activity (considering only the major activity of the time slots) |
| 42 | Percentage of persons and minutes spent in a day on an average per person/per participant of age 6 years and above in unpaid activities, paid activities and other activities irrespective of whether the activity was a major activity or not (considering all the activities in a time slot) |
| 43 | Percentage of persons and minutes spent in a day on an average per person/per participant of age 6 years and above for each household social group in unpaid activities, paid activities and other activities where the activity was a major activity (considering only the major activity of the time slots) |
| 44 | Percentage of persons and minutes spent in a day on an average per person/per participant of age 6 years and above for each household social group in unpaid activities, paid activities and other activities irrespective of whether the activity was a major activity or not (considering all the activities in a time slot) |
| 45 | Percentage of time spent in a day per person in ‘Unpaid domestic services for household members’ and ‘Unpaid caregiving services for household members’ irrespective of whether it is a major activity or not (considering all the activities in a time slot) |
| 46 | Percentage distribution of persons of age 6 years and above by relationship of the informant with the household member and gender of the informant for each day of week |
Appendix B: RSE of the Estimates
| Table No. | Title |
|---|---|
| 1RSE_State | RSE (in percent) of participation rate in activities of major divisions of TUS activity classification in a day irrespective of whether it is a major activity or not (considering all the activities in a time slot) for each State/UT |
| 1RSE_India | RSE (in percent) of participation rate in activities of major divisions of TUS activity classification in a day irrespective of whether it is a major activity or not (considering all the activities in a time slot) at all-India level |
| 2RSE_State | RSE (in percent) of estimates of time (in minutes) spent in a day on an average per participant in the activities of major divisions of TUS activity classification irrespective of whether it is a major activity or not (considering all the activities in a time slot) for each State/UT |
| 2RSE_India | RSE (in percent) of estimates of time (in minutes) spent in a day on an average per participant in the activities of major divisions of TUS activity classification irrespective of whether it is a major activity or not (considering all the activities in a time slot) at all-India level |
| 3RSE_State | RSE (in percent) of estimates of time (in minutes) spent in a day on an average per person in the activities of major divisions of TUS activity classification irrespective of whether it is a major activity or not (considering all the activities in a time slot) for each State/UT |
| 3RSE_India | RSE (in percent) of estimates of time (in minutes) spent in a day on an average per person in the activities of major divisions of TUS activity classification irrespective of whether it is a major activity or not (considering all the activities in a time slot) at all-India level |
| 4RSE_State | RSE (in percent) of participation rate in a day in self development activities, unpaid activities and paid activities irrespective of whether it is a major activity or not (considering all the activities in a time slot) for each State/UT |
| 4RSE_India | RSE (in percent) of participation rate in a day in self development activities, unpaid activities and paid activities irrespective of whether it is a major activity or not (considering all the activities in a time slot) at all-India level |
| 5RSE_State | RSE (in percent) of estimates of time (in minutes) spent in a day on an average per person in self development activities, unpaid activities and paid activities irrespective of whether it is a major activity or not (considering all the activities in a time slot) for each State/UT |
| 5RSE_India | RSE (in percent) of estimates of time (in minutes) spent in a day on an average per person in self development activities, unpaid activities and paid activities irrespective of whether it is a major activity or not (considering all the activities in a time slot) at all-India level |
| 6RSE_State | RSE (in percent) of estimates of time (in minutes) spent in a day on an average per participant in self development activities, unpaid activities and paid activities |
Table No.
irrespective of whether it is a major activity or not (considering all the activities in a time slot) for each State/UT
| 6RSE_India | RSE (in percent) of estimates of time (in minutes) spent in a day on an average per participant in self development activities, unpaid activities and paid activities irrespective of whether it is a major activity or not (considering all the activities in a time slot) at all-India level |
|---|---|
| 7RSE_State | RSE (in percent) of participation rate and RSE (in percent) of estimates of time (in minutes) spent in a day on an average per participant in SNA activities, Non-SNA activities and residual other activities where the activity was a major activity (considering only the major activity of the time slots) for each broad principal activity status for each State/UT |
| 7RSE_India | RSE (in percent) of participation rate and RSE (in percent) of estimates of time (in minutes) spent in a day on an average per participant in SNA activities, Non-SNA activities and residual other activities where the activity was a major activity (considering only the major activity of the time slots) for each broad principal activity status at all-India level |
| 8RSE_State | RSE (in percent) of participation rate and RSE (in percent) of estimates of time (in minutes) spent in a day on an average per participant in SNA production/Non-SNA production/residual other activities irrespective of whether it is a major activity or not (considering all the activities in a time slot) for each State/UT |
| 8RSE_India | RSE (in percent) of participation rate and RSE (in percent) of estimates of time (in minutes) spent in a day on an average per participant in SNA production/Non-SNA production/residual other activities irrespective of whether it is a major activity or not (considering all the activities in a time slot) at all-India level |
Appendix C: Concepts and Definitions
The concepts and definitions of some important terms used in the survey and relevant to this report are explained in the following paragraphs. It may be noted that information in this survey was collected from the respondents by personal interview method.
C. 1 Household and household size: A group of persons who normally lived together and took food from a common kitchen constituted a household. The adverb “normally” means that temporary visitors and guests (whose total period of stay in the household was expected to be less than 6 months) were excluded but temporary stay-aways (whose total period of absence from the household was expected to be less than 6 months) were included. Thus a child residing in a hostel for studies was excluded from the household of his/her parents, but a resident domestic servant or paying guest (but not just a tenant in the house) was included in the employer’s/host’s household. “Living together” was given more importance than “sharing food from a common kitchen” in drawing the boundaries of a household in case the two criteria were in conflict. However, in the special case of a person taking food with his family but sleeping elsewhere (say, in a shop or a different house) due to shortage of space, the household formed by such a person’s family members was taken to include the person also. Each inmate of a hotel, mess, boarding-lodging house, hostel, etc., was considered to be a single-member household. The same principle was applicable for the residential staff of such establishments. However, if a group of persons among them pooled their income for spending, they were treated as forming a single household. A family living in a hotel was treated as a single household. The size of a household is the total number of persons in the household.
C. 2 Age (years): The age in completed years, as on the date of survey, of the household members were recorded.
C.3. Age of the person considered for collection of information on time use: Particulars relating to time use was collected for each member of age 6 years and above of the selected households.
C. 4 Highest level of education: It is the highest level of education considering all general/ technical/vocational educational level successfully completed by the members of the household. A person who can both read and write a simple message with understanding in at least one language was considered literate. Those who were not able to do so, were considered not literate. For the purpose of this survey, the primary level was defined as Class I-V for all the States/UTs uniformly. In this survey, information on highest level of educational successfully completed was collected on the following categories:
higher secondary
diploma /certificate course (upto secondary)
diploma /certificate course (higher secondary)
diploma /certificate course (graduation and above)
graduate
post graduate and above
C. 5 Household’s usual consumer expenditure (Rs.) in a month: Household’s usual monthly consumer expenditure is the sum total of monetary values of all goods and services consumed by the household on domestic account with a monthly regularity. Unusual expenditures, such as, expenditure on social ceremonies, capitation fee, hospitalization etc. were excluded for deriving usual monthly consumer expenditure of the household. However, expenditure on household durable goods was included and monthly expenditure on durable goods was derived by apportioning the total expenditure made by the household on durable goods during last 365 days. For deriving household’s usual monthly consumer expenditure, information on regular monthly expenditure of the household for household purposes out of purchase, home grown and wages in kind, free collection gift etc. is collected along with the information on expenditure of the household for purchase of durable goods during last 365 days. In Time Use Survey, the usual monthly consumer expenditure of the household was collected through these five items:
A: usual consumer expenditure in a month for household purposes out of purchase
B: imputed value of usual consumption in a month from home grown stock
C: imputed value of usual consumption in a month from wages in kind, free collection, gifts etc.
D: expenditure on purchase of items like clothing, footwear, etc. during last 365 days
E. expenditure on purchase of household durables during last 365 days
From the information collected in these five items, usual monthly consumer expenditure of the household was derived as $[A+B+C+(D / 12)$.
Since this information on Household Usual Monthly Consumer Expenditure was collected through a five question, it cannot be used to estimate the household consumer expenditure which is generally estimated based on detailed household consumer expenditure survey. Based on the information collected on Household Usual Monthly Consumer Expenditure, quintile classes of Usual Monthly Per Capita Consumer Expenditure (UMPCE) were formed (with each quintile class containing 20 per cent of the population) separately for each sector (rural/urban).
C. 6 Day of week: Day of the week was the day before the date of the interview for which the information on time use was recorded
C. 7 Type of the day: The day for which information on time use was collected was either a normal day or a day other than a normal day (termed as other day).
C. 8 Normal day and other day: The normal days were the days on which a household member pursued mostly his/her routine activities whereas the day on which the routine activities of a household member were altered due to any reason, was treated as ‘other day’. For a household member, a day other than a normal day might arise due to social obligations or some unforeseen reasons like, illness, ceremonies, hospitalization of a household member or duties thrust upon due to an accident, etc. besides, weekly off-days, holidays or days of leave. The decision on whether a day is a normal day or other day for a household member was taken in consultation with the informant and considering the routine activities of the household members.
C. 9 Paid and unpaid activities: In this report the activities of the members of the households were classified as paid activities and unpaid as follows:
Unpaid activities
care for children, sick, elderly, differently-abled persons in own households
production of other services for own consumption
production of goods for own consumption
voluntary work for production of goods in households
voluntary work for production of services in households
voluntary work for production of goods in market/non-market units
voluntary work for production of services in market/non-market units
unpaid trainee work for production of goods
unpaid trainee work for production of services
other unpaid work for production of goods
other unpaid work for production of services
Paid activities
self-employment for production of goods
self-employment for production of services
regular wage/ salary for production of goods
regular wage/ salary for production of services
casual labour for production of goods
casual labour: for production of services
C. 10 Classification of activities in System of National Accounts (SNA) Production, non-SNA and other remaining activities
SNA production:
Employment in corporations, government and non-profit institutions
Production of goods for own final use
Employment in household enterprises to produce goods
Employment in household enterprises to provide services
Ancillary activities and breaks related to employment
Training and studies in relation to employment
Employment-related travel
Unpaid trainee work and related activities
Unpaid direct volunteering for other households for production of goods or for production of goods/services for market/non-market units
Unpaid community- and organization-based volunteering for production of goods or for production of goods/services for market/non-market units
Other unpaid work activities (other than those which are already covered in SNA or covered in non-SNA production)
Non-SNA production:
Unpaid domestic services for household members
Unpaid caregiving services for household members
Unpaid direct volunteering for other households for production of services for the households
Unpaid community- and organization-based volunteering for production of services for the households
Other activities
Seeking employment
Setting up a business
Commuting
Learning
Socializing and communication, community participation and religious practice
Culture, leisure, mass-media and sports practices
Self-care and maintenance
C. 11 Time Use Classification to be used in the TUS: The International Classification of Activities for Time Use Statistics 2016 (3-digit code) (ICATUS 2016) was used in TUS to record 3-digit codes of the activities of the household members. The code structure and description of the 3-digit code of the TUS activity classification are given at the end of this Appendix.
C. 12 Reference period for recording activities: For each household member of age 6 years and above, information on activity particulars was collected with a reference period of 24 hours starting from 4:00 AM on the day before the date of interview to 4:00 AM on the day of the interview.
C. 13 Time slot: The reference period of 24 hours was split into 48 time slots, each of duration of 30 minutes. The time slots used was in 24-hour format, like 12:00 to 12:30, 12:30 to 13:00, etc.
C. 14 Number of activities to be recorded in each time slot: To record activities, the reference period of 24 hours was split into 30 minutes time slots and in each of these time slots, at most three activities were recorded. Each of the activities in a time slot which were performed for 10 minutes or more were only considered for recording and at most three of such activities were recorded chronologically following major time criteria.
C. 15 Whether performed multiple activity in the time slot: If in a time slot more than one activities were performed each of which was for a duration of 10 minutes or more, the time slot was identified as a time slot in which multiple activities were performed
C. 16 Whether performed simultaneous activity in a time slot: If in a time slot multiple activities were recorded, it was enquired whether some of these activities were performed simultaneously or not. Simultaneous activities are those that have an overlap of some duration of time in the same time slot of 30-minute duration, irrespective of their starting or ending time. If in a time slot where multiple activities were performed, some of the activities were simultaneous activities, the time slot was identified as a time slot in which simultaneous activities were performed.
C. 17 Whether a major activity or a minor activity: Among the activities recorded in a time slot, the major activity was the one which was considered most important activity by the informant performed during a time slot. If in a time slot only one activity was performed, that activity was always considered as a major activity. However, if more than one activity was performed in a time slot, one of the activities was treated as a major activity and all other activities in that time slot was considered as minor activity.
C. 18 Where the activity was performed: Information on the location where the activity was performed was recorded for each of the activities in a time slot as follows:
within premises of the dwelling unit of the selected household
outside premises of the dwelling unit of the selected household:
in fixed location
in non-fixed location
C. 19 Social group: For each household surveyed, the social group to which the head of the household belonged to was recorded. The social group of the head of the household was considered as the social group of all the members of the household irrespective of the actual social group to which the individual members belonged. In the survey, information was collected in respect of four social groups viz. scheduled tribe (ST), scheduled caste (SC), other backward class (OBC) and the rest referred to as others. The information recorded in this regard was based entirely on the response of the informant and not based on any state or central level list of the social group.
C. 20 Usual principal activity status of the persons of age 6 years and above: For the household members of age 6 years and above, information on their usual principal activity statuses was collected in TUS to study the time use by persons in different usual principal activity statuses. The relevant concepts and approach followed to determine the usual principal activity statuses is given below:
C.20.1 Economic activity: The term ‘economic activity’ included:
(i) all the market activities, i.e., the activities performed for pay or profit which result in production of goods and services for exchange,
(ii) of the non-market activities,
(a) all the activities relating to the primary sector (i.e., industry Divisions 01 to 09 of NIC-2008) which result in production (including free collection of uncultivated crops, forestry, firewood, hunting, fishing, mining, quarrying, etc.) of primary goods, including threshing and storing of grains for own consumption.
and
(b) the activities relating to the own-account production of fixed assets. Own account production of fixed assets includes construction of own houses, roads, wells, etc., and of machinery, tools, etc., for household enterprise and also construction of any private or community facilities free of charge. A person may be engaged in own account construction in the capacity of either a labourer or a supervisor.
The activities like prostitution, begging, etc., which may result in earning, were not considered as economic activities for the survey.
C.20.2 Activity status: It is the activity situation relating to participation in economic and / or noneconomic activities in which a person is found engaged during a reference period. According to this, a person is in one or a combination of the following three broad activity statuses during a reference period:
(i) Working or being engaged in economic activity (work),
(ii) Being not engaged in economic activity (work) and either making tangible efforts to seek ‘work’ or being available for ‘work’ if the ‘work’ is available and
(iii) Being not engaged in any economic activity (work) and also not available for ‘work’.
Activity statuses, as mentioned in (i) \& (ii) above, are associated with ‘being in labour force’ and the last with ‘not being in the labour force’. Within the labour force, activity status (i) above is associated with ’employment’ and activity status (ii) with ‘unemployment’. During a specified reference period by adopting the procedure to determine the broad activity statuses, each person is classified in one of the three broad activity statuses. Persons found with the broad activity statuses (i), (ii) and (iii), during the reference period, are employed (worker), unemployed and ‘not in labour force’, respectively.
The detailed activity statuses under each of the three broad activity statuses (viz. ’employed’, ‘unemployed’ and ‘not in labour force’) and the corresponding codes used in the survey are given below:
code description
working (or employed)
self-employed
11 worked in household enterprises (self-employed) as own-account worker
12 worked in household enterprises (self-employed) as an employer
21 worked in household enterprises (self-employed) as helper
regular wage/ salaried employee
31 worked as regular wage/salaried employee
casual labour
41 worked as casual labour in public works
51 worked as casual labour in other types of works
not working but seeking/available for work (or unemployed)
81 sought work or did not seek but was available for work
neither working nor available for work (or not in labour force)
91 attended educational institutions
92 attended to domestic duties only
93 attended to domestic duties and was also engaged in free collection of goods (vegetables, roots, firewood, cattle feed, etc.), sewing, tailoring, weaving, etc. for household use
94 rentiers, pensioners, remittance recipients, etc.
95 not able to work owing to disability
97 others (including beggars, prostitutes, etc.)
99 children of age $0-4$ years
C.20.3 Constituents of ’employed, ‘unemployed’, ‘labour force’, ‘out of labour force’
The various constituents of ’employed, ‘unemployed’, ‘labour force’, ‘out of labour force’ are as explained below:
(i) Workers (or employed): Persons who were engaged in any economic activity or who, despite their attachment to economic activity, abstained themselves from work for reason of illness, injury or other physical disability, bad weather, festivals, social or religious functions or other contingencies necessitating temporary absence from work, constituted workers. Unpaid household members who assisted in the operation of an economic activity in the household farm or non-farm activities were also considered as workers..
(ii) Seeking or available for work (or unemployed): Persons who, owing to lack of work, had not worked but either sought work through employment exchanges, intermediaries, friends or relatives or by making applications to prospective employers or expressed their willingness or availability for work under the prevailing conditions of work and remuneration, were considered as those ‘seeking or available for work’ (or unemployed).
(iii) Labour force: Persons who were either ‘working’ (or employed) or ‘seeking or available for work’ (or unemployed) constituted the labour force.
(iv) Not in labour force: Persons who were neither ‘working’ nor ‘seeking or available for work’ for various reasons during the reference period were considered as ‘not in labour force’. Persons under this category are students, those engaged in domestic duties, rentiers, pensioners, recipients of remittances, those living on alms, infirm or disabled persons, too young persons, prostitutes, etc. and casual labours not working due to sickness.
(v) Self-employed: Persons who operated their own farm or non-farm enterprises or were engaged independently in a profession or trade on own-account or with one or a few partners were deemed to be self-employed in household enterprises. The essential feature of the self-employed is that they have autonomy (decide how, where and when to produce) and economic independence (in respect of choice of market, scale of operation and finance) for carrying out their operation. The remuneration of the self-employed consists of a non-separable combination of two parts: a reward for their labour and profit of their enterprise.
Self-employed persons were categorised as follows:
(a) own-account workers: Self-employed persons who operated their enterprises on their own account or with one or a few partners and who, during the reference period, by and large, ran their enterprise without hiring any labour were considered as own-account workers. They could, however, have had unpaid helpers to assist them in the activity of the enterprise.
(b) employers: Self-employed persons who worked on their own account or with one or a few partners and, who, by and large, ran their enterprise by hiring labour were considered as employers.
(c) helpers in household enterprise: Self-employed persons who were engaged in their household enterprises, working full or part time and did not receive any regular salary or wages in return for the work performed were considered as helpers in household enterprise. They did not run the household enterprise on their own but assisted the concerned person living in the same household in running the household enterprise.
C.20.4 Regular wage/salaried employee: These were persons who worked in others’ farm or non-farm enterprises (both household and non-household) and, in return, received salary or wages on a regular basis (i.e. not on the basis of daily or periodic renewal of work contract). This category included not
only persons getting time wage but also persons receiving piece wage or salary and paid apprentices, both full time and part-time.
C.20.5 Casual labour: A person who was casually engaged in others’ farm or non-farm enterprises (both household and non-household) and, in return, received wages according to the terms of the daily or periodic work contract, was considered as a casual labour.
C.20.6 Approach followed to determine activity status: The persons were classified into various activity categories on the basis of activities (economic/non-economic) pursued by them in the usual principal status approach on the basis of the reference period of one year.
Usual activity status: The usual activity status relates to the activity status of a person during the reference period of 365 days preceding the date of survey. The activity status on which a person spent relatively long time (major time criterion) during the 365 days preceding the date of survey is considered the usual principal activity status of the person. To decide the usual principal activity of a person, he/ she is first categorised as belonging to the labour force or not, during the reference period on the basis of major time criterion. Persons, thus adjudged as not belonging to the labour force are assigned the broad activity status ‘neither working nor available for work’. For the persons belonging to the labour force, the broad activity status of either ‘working’ or ‘not working but seeking and/ or available for work’ is then ascertained again on the basis of the relatively long time spent in the labour force during the 365 days preceding the date of survey. Within the broad activity status so determined, the detailed activity status category of a person pursuing more than one such activity was determined again on the basis of the ‘relatively long time spent’ criterion.
C. 21 Determination of activity performed in a day and time spent in a day in that activity
C.21.1 Considering only the major activity in a time slot: While considering only the major activity in a time slot, the entire duration of the time in that time slot has been allotted to the major activity and the major activity was considered as the activity performed in that time slot.
C.21.2 Considering all the activities in a time slot: While considering all the activities performed in a time slot, the entire duration of time in a time slot has been assigned among the activities in a time slot in the following ways:
- If in a time slot only one activity was performed, the entire duration of that time slot was allotted against that activity.
- If in a time slot more than one activity was performed, the entire duration of that time slot was allotted equally among the activities performed in that time slot.
TUS activity classification as per
International Classification of Activities for Time Use Statistics 2016
(ICATUS 2016)
| Major divisio n |
Division | Gro up | Activity title |
|---|---|---|---|
| 1 | Employment and related activities | ||
| 11 | Employment in corporations, government and non-profit institutions | ||
| 110 | Employment in corporations, government and nonprofit institutions | ||
| 12 | Employment in household enterprises to produce goods | ||
| 121 | Growing of crops for the market in household enterprises | ||
| 122 | Raising animals for the market in household enterprises | ||
| 123 | Forestry and logging for the market in household enterprises | ||
| 124 | Fishing for the market in household enterprises | ||
| 125 | Aquaculture for the market in household enterprises | ||
| 126 | Mining and quarrying for the market in household enterprises | ||
| 127 | Making and processing goods for the market in household enterprises | ||
| 128 | Construction activities for the market in household enterprises | ||
| 129 | Other activities related to employment in household enterprises to produce goods | ||
| 13 | Employment in household enterprises to provide services | ||
| 131 | Vending and trading of goods in household enterprises | ||
| 132 | Providing paid repair, installation, maintenance and disposal in household enterprises | ||
| 133 | Providing paid business and professional services in household enterprises | ||
| 134 | Transporting goods and passengers for pay or profit in household enterprises | ||
| 135 | Providing paid personal care services in household enterprises | ||
| 136 | Providing paid domestic services | ||
| 139 | Other activities related to employment in household enterprises providing services | ||
| 14 | Ancillary activities and breaks related to employment | ||
| 141 | Activities ancillary to employment | ||
| 142 | Breaks during working time within employment | ||
| 15 | Training and studies in relation to employment | ||
| 150 | Training and studies in relation to employment | ||
| 16 | Seeking employment |
| Major divisio n |
Division | Gro up | Activity title |
|---|---|---|---|
| 17 | 160 | Seeking employment | |
| Setting up a business | |||
| 170 | Setting up a business | ||
| 18 | Travelling and commuting for employment | ||
| 181 | Employment-related travel | ||
| 182 | Commuting | ||
| 2 | Production of goods for own final use | ||
| 21 | Agriculture, forestry, fishing and mining for own final use | ||
| 211 | Growing crops and kitchen gardening, for own final use | ||
| 212 | Farming of animals and production of animal products for own final use | ||
| 213 | Hunting, trapping and production of animal skins for own final use | ||
| 214 | Forestry and logging for own final use | ||
| 215 | Gathering wild products for own final use | ||
| 216 | Fishing for own final use | ||
| 217 | Aquaculture for own final use | ||
| 218 | Mining and quarrying for own final use | ||
| 22 | Making and processing goods for own final use | ||
| 221 | Making, processing food products, beverages and tobacco for own final use | ||
| 222 | Making, processing textiles, wearing apparel, leather and related products for own final use | ||
| 223 | Making, processing of wood and bark products for own final use | ||
| 224 | Making, processing bricks, concrete slabs, hollow blocks, tiles for own final use | ||
| 225 | Making, processing herbal and medicinal preparations for own final use | ||
| 226 | Making, processing metals and metal products for own final use | ||
| 227 | Making, processing of products using other materials for own final use | ||
| 229 | Acquiring supplies and disposing of products and other activities related to making and processing goods for own final use | ||
| 23 | Construction activities for own final use | ||
| 230 | Construction activities for own final use | ||
| 24 | Supplying water and fuel for own final use | ||
| 241 | Gathering firewood and other natural products used as fuel for own final use | ||
| 242 | Fetching water from natural and other sources for own final use | ||
| 25 | Travelling, moving, transporting or accompanying goods or |
| Major divisio n |
Division | Gro up | Activity title |
|---|---|---|---|
| persons related to own-use production of goods | |||
| 250 | Travelling, moving, transporting or accompanying goods or persons related to own-use production of goods | ||
| 3 | Unpaid domestic services for household members | ||
| 31 | Food and meals management and preparation | ||
| 311 | Preparing meals/snacks | ||
| 312 | Serving meals/snacks | ||
| 313 | Cleaning up after food preparation/meals/snacks | ||
| 314 | Storing, arranging, preserving food stocks | ||
| 319 | Other activities related to food and meals management and preparation | ||
| 32 | Cleaning and maintaining of own dwelling and surroundings | ||
| 321 | Indoor cleaning | ||
| 322 | Outdoor cleaning | ||
| 323 | Recycling and disposal of garbage | ||
| 324 | Upkeep of indoor/outdoor plants, hedges, garden, grounds, landscape, etc. | ||
| 325 | Tending furnace, boiler, fireplace for heating and water supply | ||
| 329 | Other activities related to cleaning and upkeep of dwelling and surroundings | ||
| 33 | Do-it-yourself decoration, maintenance and repair | ||
| 331 | Do-it-yourself improvement, maintenance and repair of own dwelling | ||
| 332 | Installation, servicing and repair of personal and household goods including ICT equipment | ||
| 333 | Vehicle maintenance and repairs | ||
| 339 | Other activities related to do-it-yourself decoration, maintenance and repair | ||
| 34 | Care and maintenance of textiles and footwear | ||
| 341 | Hand/machine-washing | ||
| 342 | Drying textiles and clothing | ||
| 343 | Ironing/pressing/folding | ||
| 344 | Mending/repairing and care of clothes and shoes; cleaning and polishing shoes | ||
| 349 | Other activities related to care of textiles and footwear | ||
| 35 | Household management for own final use | ||
| 351 | Paying household bills | ||
| 352 | Budgeting, planning, organizing duties and activities in the household | ||
| 359 | Other activities related to household management | ||
| 36 | Pet care | ||
| 361 | Daily pet care |
| Major divisio n |
Division | Gro up | Activity title |
|---|---|---|---|
| 37 | 362 | Using veterinary care or other pet care services (grooming, stabling, holiday or day care) | |
| 369 | Other activities related to pet care | ||
| Shopping for own household members | |||
| 371 | Shopping for/purchasing of goods and related activities | ||
| 372 | Shopping for/availing of services and related activity | ||
| 38 | Travelling, moving, transporting or accompanying goods or persons related to unpaid domestic services for household members | ||
| 380 | Travelling, moving, transporting or accompanying goods or persons related to unpaid domestic services for household members | ||
| 39 | Other unpaid domestic services for household members | ||
| 390 | Other unpaid domestic services for household members | ||
| 4 | Unpaid caregiving services for household members | ||
| 41 | Childcare and instruction | ||
| 411 | Caring for children including feeding, cleaning, physical care | ||
| 412 | Providing medical care to children | ||
| 413 | Instructing, teaching, training, helping children | ||
| 414 | Talking with and reading to children | ||
| 415 | Playing and sports with children | ||
| 416 | Minding children (passive care) | ||
| 417 | Meetings and arrangements with schools and child care service providers | ||
| 419 | Other activities related to childcare and instruction | ||
| 42 | Care for dependent adults | ||
| 421 | Assisting dependent adults with tasks of daily living | ||
| 422 | Assisting dependent adults with medical care | ||
| 423 | Assisting dependent adults with forms, administration, accounts | ||
| 424 | Affective/emotional support for dependent adults | ||
| 425 | Passive care of dependent adult | ||
| 426 | Meetings and arrangements with adult care service providers | ||
| 429 | Other activities related to care for dependent adults | ||
| 43 | Help to non-dependent adult household members | ||
| 431 | Feeding, cleaning, physical care for non-dependent adult household members including for temporary illness | ||
| 432 | Affective/emotional support for non-dependent adult household members |
| Major divisio n | Division | Gro up | Activity title |
|---|---|---|---|
| 44 | 439 | Other activities related to care for non-dependent adult household members | |
| Travelling and accompanying goods or persons related to unpaid | |||
| caregiving services for household members | |||
| 441 | Travelling related to care-giving services for household members | ||
| 442 | Accompanying own children | ||
| 443 | Accompanying dependent adults | ||
| 444 | Accompanying non-dependent adult household members | ||
| 49 | Other activities related to unpaid caregiving services for household members | ||
| 490 | Other activities related to unpaid caregiving services for household members | ||
| 5 | Unpaid volunteer, trainee and other unpaid work | ||
| 51 | Unpaid direct volunteering for other households | ||
| 511 | Unpaid volunteer household maintenance, management, construction, renovation and repair | ||
| 512 | Unpaid volunteer shopping/purchasing goods and services | ||
| 513 | Unpaid volunteer childcare and instruction | ||
| 514 | Unpaid volunteer care for adults | ||
| 515 | Unpaid volunteer activities in enterprises owned by other households | ||
| 519 | Other activities related to direct unpaid volunteering for other households | ||
| 52 | Unpaid community- and organization-based volunteering | ||
| 521 | Unpaid volunteer work on road/building repair, clearing and preparing land, cleaning (streets, markets, etc.), and construction | ||
| 522 | Unpaid volunteer preparing/serving meals, cleaning up | ||
| 523 | Unpaid volunteer cultural activities, recreation and sports activities | ||
| 524 | Unpaid volunteer office/administrative work | ||
| 529 | Other activities related to community- and organization-based unpaid volunteering | ||
| 53 | Unpaid trainee work and related activities | ||
| 530 | Unpaid trainee work and related activities | ||
| 54 | Travelling time related to unpaid volunteer, trainee and other unpaid work | ||
| 540 | Travelling time related to unpaid volunteer, trainee and other unpaid work | ||
| 59 | Other unpaid work activities |
| Major divisio n |
Division | Gro up | Activity title |
|---|---|---|---|
| 6 | Learning | 590 | Other unpaid work activities |
| 61 | Formal education | ||
| 611 | School/university attendance | ||
| 612 | Extra-curricular activities | ||
| 613 | Breaks at place of formal education | ||
| 614 | Self-study for distance education course work (video, audio, online) | ||
| 62 | 619 | Other activities related to formal education | |
| Homework, being tutored, course review, research and activities related to formal education | |||
| 63 | Additional study, non-formal education and courses | ||
| 630 | Additional study, non-formal education and courses | ||
| 64 | Travelling time related to learning | ||
| 640 | Travelling time related to learning | ||
| 69 | Other activities related to learning | ||
| 690 | Other activities related to learning | ||
| 7 | Socializing and communication, community participation and religious practice | ||
| 71 | Socializing and communication | ||
| 711 | Talking, conversing, chatting | ||
| 712 | Socializing/getting together/gathering activities | ||
| 713 | Reading and writing mail (including email) | ||
| 719 | Other activities related to socializing and communication | ||
| 72 | Participating in community cultural/social events | ||
| 721 | Participating in community celebrations of cultural/historic events | ||
| 722 | Participating in community rites/events (non-religious) of weddings, funerals, births and similar rites-ofpassage | ||
| 723 | Participating in community social functions (music, dance, etc.) | ||
| 729 | Other activities related to community participation | ||
| 73 | Involvement in civic and related responsibilities | ||
| 730 | Involvement in civic and related responsibilities | ||
| 74 | Religious practices | ||
| 741 | Private prayer, meditation and other spiritual activities | ||
| 742 | Participating in collective religious practice | ||
| 749 | Other activities related to religious practice | ||
| 75 | Travelling time related to socializing and communication, community participation and religious practice |
| Major divisio n |
Division | Gro up | Activity title |
|---|---|---|---|
| 79 | 750 | Travelling time related to socializing and communication, community participation and religious practice | |
| Other activities related to socializing and communication, community participation and religious practice | |||
| 790 | Other activities related to socializing and communication, community participation and religious practice | ||
| 8 | Culture, leisure, mass-media and sports practices | ||
| 81 | Attending/visiting cultural, entertainment and sports events/venues | ||
| 811 | Attendance at organized/mass cultural events and shows | ||
| 812 | Attendance at parks/gardens | ||
| 813 | Attendance at sports events | ||
| 819 | Other activities related to attendance at cultural, entertainment and sports events | ||
| 82 | Cultural participation, hobbies, games and other pastime activities | ||
| 821 | Visual, literary and performing arts (as hobby) | ||
| 822 | Hobbies | ||
| 823 | Playing games and other pastime activities | ||
| 829 | Other activities related to cultural participation, hobbies, games | ||
| 83 | Sports participation and exercise and related activities | ||
| 831 | Participating in sports | ||
| 832 | Exercising | ||
| 84 | Mass media use | ||
| 841 | Reading for leisure | ||
| 842 | Watching/listening to television and video | ||
| 843 | Listening to radio and audio devices | ||
| 849 | Other activities related to mass media use | ||
| 85 | Activities associated with reflecting, resting, relaxing | ||
| 850 | Activities associated with reflecting, resting, relaxing | ||
| 86 | Travelling time related to culture, leisure, mass-media and sports practices | ||
| 860 | Travelling time related to culture, leisure, mass-media and sports practices | ||
| 89 | Other activities related to culture, leisure, mass-media and sports practices | ||
| 890 | Other activities related to culture, leisure, mass-media and sports practices | ||
| 9 | Self-care and maintenance | ||
| 91 | Sleep and related activities |
| Major divisio n |
Division | Gro up | Activity title |
|---|---|---|---|
| 92 | 911 | Night sleep/essential sleep | |
| 912 | Incidental sleep/naps | ||
| 913 | Sleeplessness | ||
| 919 | Other sleep and related activities | ||
| Eating and drinking | |||
| 921 | Eating meals/snack | ||
| 922 | Drinking other than with meal or snack | ||
| Personal hygiene and care | |||
| 931 | Personal hygiene and care | ||
| 932 | Health/medical care to oneself | ||
| 939 | Other activities related to personal hygiene and care | ||
| 94 | Receiving personal and health/medical care from others | ||
| 941 | Receiving personal care from others | ||
| 942 | Receiving health/medical care from others | ||
| 949 | Other activities related to receiving personal and health/medical care | ||
| 95 | Travelling time related to self-care and maintenance activities | ||
| 950 | Travelling time related to self-care and maintenance activities | ||
| Other self-care and maintenance activities | |||
| 990 | Other self-care and maintenance activities |
Appendix D: Sampling Design and Estimation Procedure
D. 0 Introduction
The National Sample Surveys (NSS) are conducted by the Government of India since 1950 to collect data on various socio-economic indicators employing scientific sampling methods. Time use survey 2024 was started from January 2024 and it will continue till December 2024.
D. 1 Subject Coverage:
Time Use Survey 2024:The primary objective of Time Use Survey (TUS) is to measure participation of persons in paid and unpaid activities. The survey will be an important source of information on the time spent in unpaid caregiving activities, unpaid volunteer work, unpaid domestic service producing activities of the household members. This will also provide information on time spent on learning, socializing, leisure activities, self-care activities, etc. by the household members.
D. 2 Outline of the Survey programme
D.2.1 Geographical coverage: The survey is covering the whole of the Indian union except the villages in Andaman and Nicobar Islands which are difficult to access.
D.2.2 Survey Period: The survey was started from January 2024 and continue till December 2024.
D.2.3 Sub-rounds: The survey period is divided into four sub-rounds of three months duration each as follows:
| sub-round 1: | January 2024 – March 2024 |
|---|---|
| sub-round 2: | April 2024 – June 2024 |
| sub-round 3: | July 2024 – September 2024 |
| sub-round 4: | October 2024 – December 2024 |
In each of these four sub-rounds equal number of sample First Stage Units (FSUs) is allotted for survey with a view to ensure uniform spread of sample FSUs over the entire survey period. Attempt should also be made to survey each of the FSUs during the sub-round to which it is allotted. Because of the arduous field conditions, this restriction need not be strictly enforced in Andaman and Nicobar Islands, Lakshadweep, Leh and Kargil districts of Ladakh and rural areas of Arunachal Pradesh and Nagaland.
D.2.4 Schedule of enquiry: During this round, the following Schedules of enquiry will be canvassed:
| Schedule 0.0T: | List of Households |
|---|---|
| Schedule 10.6: | Time Use |
D. 3 Sample Design
D.3.1 Formation of sub-units (SUs):
D.3.1.1 Rural areas: A rural village is notionally divided into a number of sub-units (SU) of more or less equal population during the preparation of frame. Census 2011 population of villages are projected by
applying suitable growth rates and the number of SUs to be formed in a village will be determined apriori.
D.3.1.2 The above procedure of SU formation will be implemented in the villages with population more than or equal to 1000 as per Census 201D. In the remaining villages, no SU is formed.
D.3.1.3 The number of SUs to be formed in the villages (with Census 2011 population 1000 or more) of the frame will be decided before selection of the samples following the criteria given below:
| projected population of the village | no. of SUs to be formed |
|---|---|
| less than 1200 | 1 |
| 1200 to 2399 | 2 |
| 2400 to 3599 | 3 |
| 3600 to 4799 | 4 |
| 4800 to 5999 | 5 |
| …….and so on | …. |
D.3.1.4 Special case:
For rural areas of (i) Himachal Pradesh, (ii) Sikkim, (iii) Andaman \& Nicobar Islands, (iv) Uttarakhand (except four districts Dehradun, Nainital, Hardwar and Udham Singh Nagar), (v) Poonch, Rajouri, Udhampur, Reasi, Doda, Kishtwar, Ramban of Jammu and Kashmir (vi) Leh and Kargil districts of Ladakh region and (vii) Idukki district of Kerala, numbers of SUs to be formed in a village are determined in such a way that each SU contains 600 or less projected population. Further, SUs are not formed in the villages in the above-mentioned districts/States with population less than 500 as per Census 201D. In the remaining villages the number of SUs to be formed for these States/districts are as follows:
| projected population of the village | no. of SUs to be formed |
|---|---|
| less than 600 | 1 |
| 600 to 1199 | 2 |
| 1200 to 1799 | 3 |
| 1800 to 2399 | 4 |
| 2400 to 2999 | 5 |
| $\ldots \ldots .$. and so on | $\ldots$. |
For rural parts of Kerala, similar procedure as mentioned in para D.3.D.3 above is to be adopted with the modification that the SUs are to be formed within Panchayat Wards instead of villages.
D.3.1.5 Urban areas: SUs are formed in urban sector also. The procedure is similar to that adopted in rural areas except that SUs are to be formed on the basis of number of households in the UFS frame instead of population, since UFS frame does not have population. Each UFS block with number of households more than or equal to 250 is divided into a number of SUs. In the remaining UFS blocks, no SU are formed.
D.3.1.6 The number of SUs to be formed in the UFS blocks of the frame are decided before selection of the samples following the criteria given below:
| number of households of the UFS block | no. of SUs to be formed |
|---|---|
| less than 250 | 1 |
| 250 to 499 | 2 |
| 500 to 749 | 3 |
| 750 to 999 | 4 |
| 1000 to 1249 | 5 |
| ……and so on | $\ldots$ |
D.3.2 Outline of sample design: A stratified two-stage design is adopted for the TUS 2024 survey. The first stage units (FSU) are villages/UFS blocks/sub-units (SUs) as per the situation. The ultimate stage units (USU) are households in both the sectors.
D.3.3 Sampling Frame for First Stage Units (FSUs):
D.3.3.1 There is no SU formation in uninhabited villages and villages (Panchayat wards for Kerala) with population less than 1000 as per Census 2011 (less than 500 as per Census 2011 for the areas mentioned in para D.4.D.4.1) and entire village is considered as one FSU. All such villages (Panchayat wards for Kerala) areconsidered as First Stage Units (FSUs).
D.3.3.2 In the remaining villages, notional sub-units (SUs) following the procedure as described in para D.4.1.1 are formed. Such SUs are considered as First Stage Units (FSUs).
D.3.3.3 For the UFS blocks with less than 250 households, the entire UFS block are considered as one FSU. In the remaining UFS blocks, the SUs a
re considered as First Stage Units (FSUs).
D.3.3.4 List of FSUs as described above are the sampling frame for respective cases.
D.3.4 Stratification of FSUs:
Rural Sector:
(a) In the rural areas a special stratum is formed at all-India level before the strata are formed in each State/UT. This stratum comprised all the uninhabited villages as per Census 2011 belonging to all States.
(b) All inhabited villages within each NSS State region are constituted a rural stratum.
Urban Sector:In urban areas strata are formed within each NSS State region on the basis of size class of towns as per Census 2011. The tentative stratum numbers and their composition (within each NSS State region) are as follows:
stratum 1: all towns with population less than 50,000
stratum 2: all towns with population 50,000 or more but less than 3 lakhs
stratum 3: all towns with population 3 lakhs or more but less than 15 lakhs
stratum 4, 5, 6, …
each city with population 15 lakhs or more
D.3.5 Sub-stratification of FSUs:
D.3.5.1 Rural sector: Three groups of villages are formed within each stratum (except special rural stratum at all-India level)
Group 1: all villages (Panchayat wards for Kerala) with Census 2011 population less than 250
Group 2: all villages (Panchayat wards for Kerala) with Census 2011 population more than or equal to 250 but less than 500
Group 3: remaining villages
The sample size for a rural stratum will be allocated among 3 groups in proportion to population. Let $r_{1}$, $r_{2}$ and $r_{3}$ be the allocations to Group 1, Group 2 and Group 3 respectively. The villages within each group are arranged in ascending order of number of population. For all the three groups within each strata, ‘ $r_{1} / 4$ ‘ $>1$, ‘ $r_{2} / 4$ ‘ $>1$ and ‘ $r_{3} / 4$ ‘ $>1$, are implied formation of 2 or more sub-strata in each group. Substrata are demarcated in Group 1, Group 2 and Group 3 respectively in such a way that each substratum is comprised a group of villages (all SUs of a village considered together) of the arranged frame and have more or less equal population.
If number of FSUs in a particular Group is very small, no sub-stratum may be formed in that Group.
D.3.5.2 Urban sector: Let ‘u’ be the sample size allocated for an urban stratum. For all strata, if ‘u/4’ $>1$, implying formation of 2 or more sub-strata, all the UFS blocks within the stratum are first arranged in ascending order of total number of households in the UFS blocks as per urban frame. Then substrata are demarcated in such a way that each sub-stratum is comprised a group of UFS blocks (all SUs of a block considered together) having more or less equal number of households. If number of blocks in a particular stratum is very small, no sub-stratum is to be formed in the stratum.
D.3.6 Total sample size (FSUs):10024 FSUs will be surveyed at all-India level.
D.3.7 Allocation of total sample to State/UTs: The total number of sample FSUs are allocated to the States and UTs in proportion to population as per Census 2011 subject to a minimum sample allocation of 16 FSUs to each State/UT.
D.3.9 Allocation of State/UT level sample to rural and urban sector:State/UT level sample size is allocated between two sectors in proportion to population as per Census 2011 with 1.5 weightage to urban sector. A minimum of 4 FSUs, each for rural and urban sector separately, are allocated to each State/UT
D.3.9.1 Within each sector of a State/ UT, the respective sample size at stratum level is allocated to the different strata in proportion to the population as per Census 2011. Stratum level allocation is adjusted to multiples of 4 with a minimum sample size of 4
D.3.9.2. Generally, allocation is 4 for each sub-stratum in the rural/urban sector. However, allocation is adjusted in case of constraints of first stage units. Thus, allocations may be more than 4 in some cases.
4 FSUs are allocated to rural special stratum at all India level.
D.3.10 Selection of FSUs within a stratum/sub-stratum:
D.3.10.1 From all the sub-strata in both rural and urban sector within each stratum, required number of FSUs are selected by Simple Random Sampling without Replacement (SRSWOR) scheme.
D.3.11Formation of sub-units and listing of households
D.3.1.1 Procedure of formation ofSUs: After identification of the boundaries of the village/ UFS block which contains the sample FSU, the village/ UFS block is to be divided into a number of SUs (say, D) as given in the sample list by more or less equalising the present population of the village/UFS block in which the sample FSUs are located. It is to be ensured that SUs formed are clearly identifiable in terms of physical landmarks. For villages/blocks where the number of SUs to be formed is 1 as per the sample list, no SU formation is required.
D.3.1.2 Listing of households: All the households of the sample FSU will be listed. Temporarily locked households are also be listed after ascertaining the temporariness of locking of the households through local enquiry.
D.3.1.3 Formation of Sub-divisions in the selected SU: It has been observed in the previous rounds that there happen to be some extreme cases where the population/number of households of the selected SU is very high and listing becomes very difficult. To take care of such extreme situations, such SU may be sub-divided into a number of smaller units (i.e., Sub-divisions) and one of them may be randomly selected. Listing and selection of households may be done in the selected Sub-division unit only. The procedure for formation of Sub-divisions is same as that of formation of SUs within village/blocks. The listing of hamlets will not be required but Sub-divisions will be formed such that each Sub-division has more or less equal population and is a compact area.
The criteria for determining the number of Sub-divisions $\left(D_{1}\right)$ to be formed in the selected rural/urban SUs is as follows:
| Approx. population of the selected SU | no. of Sub-divisions $\left(D_{1}\right)$ to be formed |
|---|---|
| less than 1500 | 1 |
| 1500 to 2399 | 2 |
| 2400 to 3599 | 3 |
| 3600 to 4799 | 4 |
| 4800 to 5999 | 5 |
| $\ldots \ldots .$. and so on | $\ldots$. |
D.3.12.1 Special case:
D.3.12.1.1 For rural areas of (i) Himachal Pradesh, (ii) Sikkim, (iii) Andaman \& Nicobar Islands, (iv) Uttarakhand (except four districts, i.e.,Dehradun, Nainital, Hardwar and Udham Singh Nagar), (v) Punch, Rajouri, Udhampur, Reasi, Doda, Kishtwar, Ramban of Jammu (vi) Leh and Kargil districts of Ladakh region and (vii) Idukki district of Kerala, the criterion for determining the number of subdivisions $\left(D_{1}\right)$ to be formed in rural SUs is as follows:
| Approx. population of theselected SU | no. of Sub-divisions to be formed |
|---|---|
| less than 750 | 1 |
| 750 to 1199 | 2 |
| 1200 to 1799 | 3 |
| 1800 to 2399 | 4 |
| 2400 to 2999 | 5 |
| …….and so on | …. |
D.3.13 Listing of households: All the households of the sample FSU are listed. Temporarily locked households are also listed after ascertaining the temporariness of locking of households through local enquiry.
D.3.14Selection of households: A total number of 14 households are selected from each FSU and canvassed during 7 days. 2 households are canvassed on each day of the week. The sample households are selected by SRSWOR.
2. Estimation Procedure
2.1 Notations:
s = subscript for s-th stratum
$\mathrm{t}=$ subscript for t -th sub-stratum
$\mathrm{i}=$ subscript for i-th FSU [SU/ village / panchayat ward/ block]
$\mathrm{k}=$ subscript for k -th sample household within an FSU
$\mathrm{D}{1}=$ total number of sub-divisions formed in the sample FSU. $\mathrm{D}{1}=1$, if no Sub-division is formed in the SU
$\mathrm{N}=$ total number of FSUs in any rural/urban sub-stratum
$\mathrm{n}=$ number of sample FSUs surveyed including ‘uninhabited’ and ‘zero cases’ but excluding casualty for a particular sub-stratum
$\mathrm{H}=$ total number of households listed in a selected FSU
$\mathrm{h}=$ number of households surveyed in a selected FSU
$x, y=$ observed value of characteristics $x, y$ under estimation
$\hat{X}, \hat{Y}=$ estimate of population total $X, Y$ for the characteristics $x, y$
Under the above symbols,
$y_{\text {sox }}=$ observed value of the characteristic y for the k-th household of the i-th FSU for the t-th substratum of s-th stratum.
However, for ease of understanding, a few symbols have been suppressed in following paragraphs where they are obvious.
2.2 Formulae for Estimation of Aggregates for a stratum $\times$ sub-stratum:
422.1 Schedule 0.0 T (Rural/Urban):
(i) For estimating the number of households in a stratum $\times$ sub-stratum possessing a characteristic:
$$
\hat{Y}=\frac{N}{n} \sum_{i=1}^{n} D_{i} \times y_{i}
$$
where $y_{i}$ is the total number of households possessing the characteristic $y$ in i-th FSU respectively.
2.2.2 Schedule 10.6:
2.2.2.1For any indicator stratum $\times$ sub-stratum level aggregates:
$$
\hat{Y}{S t}=\frac{N}{n{s t}} \sum_{i=1}^{n s t}\left[D 1 * \frac{H_{i}}{h_{i}} \sum_{k=1}^{h_{i}} y_{i k}\right]
$$
Where $n_{s t}$ is the number of sample FSUs surveyed including zero cases and uninhabited in a particular stratum $\times$ sub stratum.
2.3 Overall Estimate for Aggregates for a stratum:
Overall estimate for a stratum $\left(\hat{Y}{s}\right)$ will be obtained as
$\hat{Y}{S}=\sum_{t} \hat{Y}_{S t}$
2.4 Overall Estimate of Aggregates at State/UT/all-India level:
The overall estimate $\hat{Y}$ at theState/ UT/ all-India level is obtained by summing the stratum estimates $\hat{Y}_{s}$ over all strata belonging to the State/ UT/ all-India.
2.5 Estimates of Ratios:
Let $\hat{Y}$ and $\hat{X}$ be the overall estimates of the aggregates $Y$ and $X$ for two characteristics $y$ and $x$ respectively at the State/UT/ all-India level.
Then the combined ratio estimate $(\hat{\boldsymbol{R}})$ of the ratio $\left(\boldsymbol{R}=\frac{\boldsymbol{Y}}{\boldsymbol{X}}\right)$ will be obtained as $\hat{\boldsymbol{R}}=\frac{\hat{\boldsymbol{Y}}}{\hat{\boldsymbol{X}}}$.
2.6 Estimation of Errors:
2.6.1 Formula for estimated variance (for Rural/Urban):
2.6.1.1 Here FSU is selected by SRSWOR method and USU (households) also selected SRSWOR method. If $\mathrm{I}^{\text {th }}$ FSU has been selected then hunt is selected from this particular FSU by SRSWOR method.
(a) Formula for aggregate $\hat{Y}{\text {(for Rural/Urban) }}$ :
$\hat{Y}{i}=H_{i} * \bar{y}{i} * D{1 s i} \quad$ and $\quad \bar{y}{i}=\quad \sum{1}^{h_{i j}} y_{i k} / h_{i}$
$V \ddot{a} r(\hat{Y})=\sum_{s} V \ddot{a} r(\hat{Y} s)=\sum_{s} \sum_{t} V \ddot{a} r(\hat{Y} s t)$
$v \bar{a} r\left(\vec{Y}{s t}\right)=N{s t}^{2}\left(\frac{1}{n_{s t}}-\frac{1}{N_{s t}}\right)\left(1 /\left(n_{s t}-\right.\right.$ 1)) $\sum_{1}^{n_{s t}}\left(H_{s t i} * D_{1 s t i} * \bar{y}{s t i}-\frac{1}{n{s t}} \sum_{1}^{n_{s t}} H_{s t i} * D_{1 s t i} \bar{y}{s t i}\right)^{2}+$ $\frac{N{s t}}{n_{s t}} \sum_{1}^{n_{s t}} H_{s t i}^{2} * D_{1 s t i}^{2}\left(\frac{1}{h_{s t i}}-\frac{1}{H_{s t i}+D_{1 s}}\right) s^{2} w_{w i}$
where $s^{2}{ }{w i}=\frac{1}{\left(h{s t i}-1\right)} \sum_{k=1}^{h_{s t i}}\left(y_{s t i k} \cdot \bar{y}{s t t i}^{2}\right)^{2}$
(b) Formula for ratio $\hat{R}{\text {(for Rural/Urban) }}$
Note that $\operatorname{MSE}(\bar{R})$ is unbiasedly estimated by $V(\hat{Y}-R \hat{X}) * \frac{1}{\hat{X}^{2}}$
$V(\hat{Y}-R \hat{X})=v(\hat{u})$ where $u_{x}=\left(y_{x}-R x_{x}\right)$,
$U_{t}=(\mathrm{Yi}-\mathrm{RXi})$ and $U=(\mathrm{Y}-\mathrm{RX})=0$ at domain level (State/All India).
$\vec{X}^{2} \overrightarrow{M S E}(\hat{R})=\vec{V}(\hat{D})$ at $R=\hat{R}$
$\vec{Y}{s t t}=\frac{1}{N{s t}} * \sum_{k} y_{s t i k} * n_{s t} *$ multiplier
$\vec{X}_{s t t}=\frac{1}{N_{s t}} * \sum_{k} x_{s t i k} * n_{s t} *$ multiplier
$M \hat{S} E(\hat{R})=\frac{1}{\hat{X}^{2}} \sum_{s} \sum_{t} M \hat{S} E s t(\hat{R})$
Finally;
$\overrightarrow{M S E}{s t}(\hat{R})=N{s t}^{2}\left(\frac{1}{n_{s t}}-\frac{1}{N_{s t}}\right) \frac{1}{\left(n_{s t}-1\right)} \sum_{1}^{n_{s t}}\left(H_{i} D_{1 s i} \bar{u}{i}-\frac{1}{n{s t}} \sum_{1}^{n_{s t}} H_{i} D_{1 s i} \bar{u}{i}\right)^{2}$
$* \frac{N{s t}}{n_{s t}} \sum_{1}^{n_{s t}} H^{2}{ }{i} * D{1 s i}^{2}\left(\frac{1}{h_{i}}-\frac{1}{H_{i} * D_{1 s i}}\right) s_{u i}{ }^{2}$
Where $s_{u i}{ }^{2}=\frac{1}{\left(h_{i}-1\right)} \sum_{k=1}^{h_{i}}\left(u_{i k}-\overline{u_{i}}\right)^{2}$
$\bar{u}{i}=\bar{y}{i}-\hat{R} \bar{x}_{i}$
Multiplier formulae are as given in Section3.
2.6.2 Estimates of Relative Standard Error (RSE):
$$
\begin{aligned}
& R \hat{S} E(\hat{Y})=\frac{\sqrt{V \hat{a} r(\hat{Y})}}{\hat{Y}} \times 100 \
& R \hat{S} E(\hat{R})=\frac{\sqrt{M \hat{S} E(\hat{R})}}{\hat{R}} \times 100
\end{aligned}
$$
3. Multipliers:
3.1 The formulae for multipliers at stratum/sub-stratum stratum level for a schedule type are given below.
| schedule | sector | formula for multipliers |
|---|---|---|
| 0.0 T | Rural/urban | $\frac{N}{n_{s t}}$ |
| 10.6 | Rural/urban | $\frac{N_{s t}}{n_{s t}} D_{1} \times \frac{n_{s t i}}{n_{s t i}}$ |
Note:
(i) For estimating any characteristic for any domain not specifically considered in sample design, indicator variable may be used.
(ii) Multipliers have to be computed on the basis of information available in the listing Schedule 0.0 T irrespective of any misclassification observed between the listing Schedule and detailed enquiry Schedule.
4. Treatment for zero cases, casualty cases etc.:
4.1 While counting the number of FSUs surveyed ( $\mathrm{n}_{\mathrm{in}}$ ) in a stratum/sub-stratum, all the FSUs with survey codes 1 to 6 in Schedule: 0.0 T will be considered. In addition, if no household is available in the frame then also that FSU will be treated as surveyed. However, household are available in the frame of the FSU but none of these could be surveyed then that FSU has to be treated as casualty and it will not be treated as surveyed.
4.2 Casualty cases: FSUs with survey code 7 as per Schedule: 0.0 T are treated as casualties. In addition to this, an FSU, although surveyed, may have to be treated as casualty for a particular cases
4.2.1 FSUs with survey codes 1 or 4 as per Schedule: 0.0Thaving number of households in the frame greater than 0 (i.e. $\mathrm{H}>0$ ) but number of households surveyed according to data file as nil ( $\mathrm{h}=0$ ), will be considered as casualties for this particular FSU.
All the FSUs with survey codes 1 to 6 as per Schedule 0.0T minus the number of casualties as identified above will be taken as the number of surveyed FSUs $\left(n_{v i}\right)$ for that (stratum/sub-stratum)).
5. Treatment in cases of void sub-strata /strata at FSU level
5.1 A stratum/sub-stratum may be void because of the casualty of all the FSUs belonging to the stratum/sub-stratum.
5.2 When a stratum/sub-stratum is void, the following procedure is recommended:
Stratum/Sub-stratum void cases at FSU levels (i.e. all FSUs having survey code 7):
(i) If a rural/urban sub-stratum is void then it may be merged with the other sub-stratum of the same Group of the stratum. If for a particular group only one sub-stratum is there and only one FSU is allocated and the FSU become casualty then this sub-stratum can be merged with next group substratum with proper size adjustment. Merged (in which void sub-stratum is merging) sub-stratum size may be calculated as :
Merged stratum size + Merging stratum size * (per FSU size of merging sub-stratum/per FSU size of merged sub-stratum).
Here merging sub-stratum means void sub-stratum and merged sub-stratum means in which void substratum is merging. Here per FSU size of a sub-stratum means average number of households per subunit in urban area and average population per sub-unit in rural area.
(ii) If a rural/urban stratum (NSS Region/NSS Region * Town class) is void due to all FSUs being casualty, it may be excluded from the coverage of the survey. The state level estimates will be based on the estimates of NSS Region for which estimates are available and remarks to that effect may be added in appropriate places.
| RURAL | |
|---|---|
| URBAN |
GOVERNMENT OF INDIA
NATIONAL STATISTICAL OFFICE
SOCIO-ECONOMIC SURVEY
TIME USE SURVEY: JANUARY, 2024 – DECEMBER, 2024
SCHEDULE 10.6: TIME USE
[0] descriptive identification of sample household
| 1. state/u.t.: | 5. investigator unit number /block number: |
|---|---|
| 2. district: | 6. name of head of household: |
| 3. sub-district/tehsil/town*: | 7. name of informant: |
| 4. village name: |
[1] identification of sample household
| item no. |
item | code | item no. |
item | code | |||
|---|---|---|---|---|---|---|---|---|
| 1. | srl. no. of sample FSU | 8. | response code | |||||
| 2. | schedule number | 1 | 0 | 6 | 9. | survey code | ||
| 3. | survey year | 2 | 0 | 2 | 4 | 10 | reason for substitution of original household (code) | |
| 4. | sample sub-unit (SU) number | 11. | telephone number | |||||
| 5. | sample Sub-Division number | 11.1 | mobile number | |||||
| 6. | sample household number | 11.2 | alternative mobile number | |||||
| 7. | serial number of informant * (as in column 1 of block 3) |
11.3 | land line (with STD code) [add the STD code in bracket without zero] |
CODES FOR BLOCK 1
item 8: response code: informant: co-operative and capable -1 , co-operative but not capable -2 , busy -3 , reluctant -4 , others -9 .
item 9: survey code: original -1, substitute -2, casualty -3.
item 10: reason for substitution of original household: informant busy -1 , members away from home -2, informant non-cooperative -3 , others -9.
- tick mark ( $v$ ) may be put in the appropriate place.
${ }^{\text {e }}$ if the informant is not a household member, code 990 will be recorded.
[3] demographic particulars of all the household members and usual principal activity particulars of household members of age 6 years and above
| srl. no. |
name | relationship to head (code) | gender (male-1, female-2, transgender3) |
age (years) |
marital status (code) | highest level of education (code) | usual principal activity particulars of household members of age 6 years and above | |
|---|---|---|---|---|---|---|---|---|
| status code | for codes 11 to 51 in col. 8 | |||||||
| description of the industry of work | industry of work (2-digit code of NIC-2008) | ||||||||
| (1) | (2) | (3) | (4) | (5) | (6) | (7) | (8) | (9) | (10) |
| | | ||||||||
| | | ||||||||
| | | ||||||||
| | | ||||||||
| | |
CODES FOR BLOCK 3
col. (3): relation to head: self -1 , spouse of head -2 , married child -3, spouse of married child -4, unmarried child -5, grandchild -6, father/mother/father-in-law/mother-in-law -7, brother/sister/brother-in-law/sister-in-law/other relatives -8, servants/ employees/ other nonrelatives -9
col. (6): marital status: never married -1 , currently married -2 , widowed -3 , divorced/separated -4
col. (7) : highest level of education: not literate: -01 , literate: below primary-02, primary -03, upper primary/middle -04, secondary -05, higher secondary -06, diploma /certificate course (up to secondary)-07, diploma/certificate course (higher secondary)-08, diploma/certificate course(graduation \& above) -10, graduate -11, post graduate and above -12 .
col. (8): status code:
worked in household enterprise (self-employed): own account worker -11, employer-12, worked as helper in household enterprise (unpaid family worker) -21; worked as regular salaried/ wage employee -31, worked as casual wage labour: in public works -41, in other types of work -51; did not work but was seeking and/or available for work -81, attended educational institution -91, attended domestic duties only -92, attended domestic duties and was also engaged in free collection of goods (vegetables, roots, firewood, cattle feed, etc.), sewing, tailoring, weaving, etc. for household use -93, rentiers, pensioners, remittance recipients, etc. -94, not able to work due to disability -95, others (including begging, prostitution, etc.) -97 .
col. (10): industry: 2-digit code (excluding 98) as per NIC -2008.
CODES FOR BLOCK 4
item 2: religion: Hinduism-1, Islam-2, Christianity -3, Sikhism-4, Jainism-5, Buddhism-6, Zoroastrianism-7, others-9 item 3: social group: scheduled tribe-1, scheduled caste-2, other backward class-3, others-9 item 4: land possessed:
| area in acre | code | area in acre | code |
|---|---|---|---|
| less than 0.01 …………… | 01 | $5.0-7.5$ | 07 |
| $0.01-0.05$ | 02 | $7.5-10.0$ | 08 |
| $0.05-0.5$ | 03 | $10.0-15.0$ | 10 |
| $0.5-1.0$ | 04 | $15.0-20.0$ | 11 |
| $1.0-2.5$ | 05 | greater than or equal to 20…… | 12 |
| $2.5-5.0$ | 06 |
Note: 1 acre $=0.4047$ hectare.
[if the sample household does not possess any land, code ’99’ will be recorded in item 4]
| household characteristics | ||
|---|---|---|
| 1. | household size | |
| 2. | religion (code) | |
| 3. | social group (code) | |
| 4. | land possessed as on date of survey (code) | |
| household’s usual monthly consumer expenditure (Rs.): items 5 to 10 | ||
| 5. | What is the usual consumer expenditure in a month for household purposes out of purchase of goods and services excluding items like clothing, footwear, durable goods (A): make entry in whole number of rupees [Include: – all regular monthly expenditure incurred by the household for purchase of goods and services for household purposes. – Recurring expenses on telephone bill, electricity bills, etc. which are to be paid once in two months/ quarterly, etc. will be apportioned and reported for a month Exclude: – Any expenditure made by the household for purchase of durable goods. – Unusual expenditures, such as, expenditure on social ceremonies, capitation fee, hospitalization, etc. – Any expenses made on items like clothing, footwear, etc.] |
|
| 6 . | What is the imputed value of usual consumption in a month from home grown stock like, rice, cereals, pulses, vegetables, milk, firewood, chips, cow dung, etc. (B): make entry in whole number of rupees [If home grown stocks are used on regular basis, the imputed value of such usual consumption in a month at ex-farm/ex-factory price will be recorded] | |
| 7. | What is the imputed value of usual consumption in a month from wages in kind, free collection, gifts, etc. (C): make entry in whole number of rupees [For wage/salaried employees these include free electricity, free telephone services, free medical services, etc. For agricultural labourers these include food-grains, vegetables, meals, etc. It will also include consumption through free collection, or consumption of mid-day meal. Imputation will be made at local retail prices.] | |
| 8. | What is the expenditure on purchase of items like clothing, footwear, etc. during last 365 days (D): make entry in whole number of rupees | |
| 9 . | What is the expenditure on purchase of household durables like bedstead, furniture, vehicles, TV, fridge, fans, cooler, AC, mobile, computer, kitchen equipment, etc. during last 365 days (E): make entry in whole number of rupees | |
| 10. | usual monthly household consumer expenditure: $[\mathrm{A}+\mathrm{B}+\mathrm{C}+(\mathrm{D}+\mathrm{E}) / 12]$ | |
| 11. | primary source of energy for cooking during last 30 days preceding the date of survey [codes: firewood and chips-01, LPG-02, other natural gas -03, dung cake-04, kerosene-05, coke orcoal-06, gobar gas-07, other biogas -08, charcoal-10, electricity(incl. generated by solar or wind power generators) -11, no cooking arrangement-12, others-19] | |
| 12. | primary source of energy for lighting during last 30 days preceding the date of survey [codes: electricity incl. generated by solar or wind power generators -1, kerosene-2, other oil -3, gas-4, candle-5, no lighting arrangement-6, others-9] | |
| 13. | type of washing of clothes considering major source during last 30 days preceding the date of survey [codes: mechanical by household members -1, manual by household members-2, by outsourcing-3] | |
| 14. | type of sweeping of floor considering major source during last 30 days preceding the date of survey [mechanical by household members-1, manual by household members-2, by outsourcing-3] | |
| 15 | dwelling unit (owned-1, hired-2, no dwelling unit-3, others-9) | |
| 16. | if 1, 2 or, 9 in item 15, type of structure of the dwelling unit (kutcha-1, semi pucca-2, pucca-3) | |
| 17. | is there any member in the household aged 5 years and above who needs special care? (yes-1, no-2) | |
| 18. | if 1 in item 17, is there any care giver available among the household members for caring the person(s)? (yes-1, no-2) | |
| Note: 1. For recording information in items 5, 6 and 7, usual monthly consumption will mean expenditure is incurred/consumption took place with a monthly regularity. 2. Ensure that the figures reported in item 5 are not reported again in any of the items 6 to 9. |
[5] some particulars relating to time use for each household member of age 6 years and above from 4:00 AM on the day before the date of interview to 4:00 AM on the day of the interview
| Item | item description | |
|---|---|---|
| 1. | srl. no. of member (as in col. 1, block 3) | |
| 2. | age ( years ) (as in col. 5, block 3) | |
| 3. | serial number of the informant (record codes as follows) if informant is a member of the household: srl. no. as in col. 1 of Block 3 if informant is not a member of the household but closely associated with the household… 990 if information cannot be collected… 999 |
|
| 4. | if entry is 990 in item 3, gender of the informant (male- 1, female- 2, transgender- 3) | |
| 5. | day of week (code: Monday – 1, Tuesday – 2, Wednesday – 3, Thursday – 4, Friday – 5, Saturday 6, Sunday – 7) |
|
| 6. | type of the day (code : normal day – 1, other day-2) |
|
| 7. | response code (code: cooperative – 1, non-cooperative – 2) |
[6] particulars of activities for each household member of age 6 years and above from 4:00 AM on the day before the date of interview to 4:00 AM on the day of the interview
| $\begin{aligned} & \text { srl. } \ & \text { no. } \ & \text { (as in } \ & \text { item. } \ & 1, \text { bl. } \ & 5) \end{aligned}$ | age ( years ) (as in item 2, bl. 5) |
srl. no. of activities |
record in 24- hour clock format | whether performed multiple activity in the time slot (yes-1 no-2) | if 1 in col. 6, whether simul-taneous activity (yes- 1 , no- 2) | description of the activity (at most 3 activities for each 30 minutes time slot) | whether a major activity or minor activity (major- 1/ minor – 2) |
3-digit activity code of TUS classification of activities | where the activity was performed? (code) | unpaid/ paid status of the activity (code) | if any of 07 to 18 in col. 12, enterprise type (code) | |
|---|---|---|---|---|---|---|---|---|---|---|---|---|
| (1) | (2) | (3) | (4) | (5) | (6) | (7) | (8) | (9) | (10) | (11) | (12) | (13) |
| 1 | 4:00 | |||||||||||
| 2 | ||||||||||||
| 3 | ||||||||||||
| 4 | ||||||||||||
| 5 | ||||||||||||
| 6 | ||||||||||||
| 7 | ||||||||||||
| 8 | ||||||||||||
| 9 | ||||||||||||
| 10 | ||||||||||||
| 11 | ||||||||||||
| 12 | ||||||||||||
| 13 |
[6] particulars of activities for each household member of age 6 years and above from 4:00 AM on the day before the date of interview to 4:00 AM on the day of the interview
| $\begin{aligned} & \text { srl. } \ & \text { no. } \ & \text { (as in } \ & \text { item. } \ & 1, \text { bl. } \ & 5 \text { ) } \end{aligned}$ | age ( years ) (as in item 2, bl. 5) |
srl. no. of activities |
record in 24- hour clock format | whether performed multiple activity in the time slot (yes-1 no-2) | if 1 in col. 6, whether simultaneous activity (yes- 1, no- 2) | description of the activity (at most 3 activities for each 30 minutes time slot) | whether a major activity or minor activity (major- 1/ minor – 2) |
3-digit activity code of TUS classification of activities | where the activity was performed? (code) | unpaid/ paid status of the activity (code) | if any of 07 to 18 in col. 12, enterprise type (code) | |
|---|---|---|---|---|---|---|---|---|---|---|---|---|
| (1) | (2) | (3) | (4) | (5) | (6) | (7) | (8) | (9) | (10) | (11) | (12) | (13) |
Codes for Block 6:
col. 11: where the activity was performed: within premises of the dwelling unit of the selected household -1,
outside premises of the dwelling unit of the selected household:
in fixed location -2, in non-fixed location-3
col. 12: unpaid/paid status of the activity:
not for payment:
self development/ self care/ self maintenance, etc. – 01, care for children, sick, elderly, differently-abled persons in own households – 02, production of other services (except care activities as covered in code 02) for own consumption -03, production of goods for own consumption-04, voluntary work for production of goods in households-05, voluntary work for production of services in households-06, voluntary work for production of goods in market/non-market units-07, voluntary work for production of services in market/non-market units-08, unpaid trainee work for production of goods-09, unpaid trainee work for production of services-10, other unpaid work for production of goods-11, other unpaid work for production of services-12
for payment:
self-employment: for production of goods-13, for production of services-14;
regular wage/ salary: for production of goods-15, for production of services-16;
casual labour: for production of goods-17, for production of services-18.
col. 13: enterprise type: proprietary – 1, partnership -2, Government/local body-3, Autonomous Bodies- 4, Public/Private limited company5, Co-operative societies-6, trust/other non-profit institutions -7, employer’s households (i.e., private households employing maid servant, watchman, cook, etc.) -8 , others -9 .
| [2] particulars of field operations | ||||||||
|---|---|---|---|---|---|---|---|---|
| sr1. no. |
item | field investigator (FI)/ Junior Statistical Officer (JSO) |
Field Officer (FO)/ Senior Statistical Officer (SSO) |
|||||
| (1) | (2) | (3) | (4) | |||||
| 1(a). | (i) name (block letters) | |||||||
| (ii) code | ||||||||
| (iii) signature | ||||||||
| 1(b). | (i) name (block letters) | |||||||
| (ii) code | ||||||||
| (iii) signature | ||||||||
| 2. | date(s) of: | DD | MM | YY | DD | MM | YY | |
| (i) survey/ inspection | ||||||||
| (ii) receipt | ||||||||
| (iii) scrutiny | ||||||||
| 3. | total time taken to canvass the schedule by the team of investigators (FI/JSO) (in minutes) [no decimal point] |
|||||||
| 4. | number of investigators (FI/JSO) in the team who canvassed the schedule |
[7] remarks by investigator (FI/ JSO)
[8] comments by supervisory officer(s)
[9] details of remarks in the Schedule
whether
schedule contains remarks:
| (i) in Block 7 by the Field Investigator (FI) / Junior Statistical Officer (JSO) | |
|---|---|
| (yes-1, no-2) | |
| (ii) in Block 8 by the supervisory officer(s) (yes-1, no-2) | |
| (iii) anywhere in the Schedule by the Field Investigator (FI) / Junior Statistical | |
| Officer (JSO) (yes-1, no-2) | |
| (iv) anywhere in the Schedule by the supervisory officer(s) (yes-1, no-2) |
Dissemination of NSS results:
The report is available on the website of Ministry of Statistics and Programme Implementation (www.mospi.gov.in)
-
not literate
literate:
below primary
primary
upper primary/middle
secondary ↩