The service sector plays a pivotal role in India’s economic growth, contributing significantly to the nation’s GDP and creating numerous employment opportunities. As a step towards creating a comprehensive database for corporate service sector enterprises, National Statistics Office has conducted a pilot study using Goods and Services Tax Network (GSTN) as a sampling frame. This pilot program aims to validate the GSTN database, refine operational methods, and improve data collection to enhance the understanding of the corporate service sector. Key findings include the predominant share of private limited companies and the concentration of assets, capital, and value addition among larger enterprises. A big hurdle identified, relates to data collection challenges particularly in cases with multiple establishments or centralized accounts. Despite these challenges, the study offers valuable insights for a more comprehensive annual survey, enhancing the national statistical framework.
SOURCE PDF LINK :
Click to access TECHNICAL%20REPORT_ASSSE.pdf
Click to view full document content
वकनीकी प्रतिवेदन
TECHNICAL REPORT
सेवा क्षेत्र के स्वामी के वासिक सर्वेक्षण (सखडा हडा हडा है) पर पायलट अध्ययन
PILOT STUDY ON ANNUAL SURVEY OF SERVICES SECTOR ENTERPRISES (ASSSE)
2025
आटर लटकाए
Government of India
सांख्यिकी और कार्यक्रम
कार्यज्वयन नंज़ल्य
Ministry of Statistics and
Programme Implementation
राष्ट्रीय सांख्यिकी कार्यलय
National Statistics Office

संवा क्षेत्र के उद्यर्मो के वार्षिक सवेष्टण (ए.एस.एस.एस.ई)
पर पायलट अध्ययन
PILOT STUDY ON
ANNUAL SURVEY OF SERVICES SECTOR ENTERPRISES (ASSSE)
तकनीकी प्रतिवेदन
Technical Report

भारत सरकार
Government of India
सांखियकी और कार्यक्रम कार्यान्वयन मंत्रालय
Ministry of Statistics and Programme Implementation
राष्ट्रीय सांखियकी कार्यालय
National Statistics Office
प्रस्तावना

सेवा क्षेत्र भारतीय अर्थव्यवस्था के आधार के रूप में उभरा है, तथा इसका सबसे गतिशील और प्रमुख घटक है। यह क्षेत्र न केवल भारत के सकल घरेलू उल्पाद में सबसे बड़ा योगदान करता है, बल्कि विशेष रूप से उदारीकरण के बाद, देश के आर्थिक परिवर्तन में एक सशक्त उत्प्रेरक की मुनिका लिमा रहा है। जहाँ एक ओर अनिमानित सेवा क्षेत्र को “अनिमानित क्षेत्र उद्घर्मा के वार्षिक सर्वेक्षण” में सस्मिनित किया गया है, वही दूसरी ओर लिमानित सेवा क्षेत्र के सूक्ष्म स्तर पर-जैसे आर्थिक व परिचालन विशेषताओं, रोज़रार और अन्य संबंधित पहलुओंपर मुसंगत आंकड़ों की स्पष्ट कमी महसूस की गई है। इस जानकारी के अंतर को भरने हेतु “सेवा क्षेत्र उद्घर्मा का वार्षिक सर्वेक्षण” की अवधारणा विकसित की गई है। राष्ट्रीय सांख्यिकी कार्यालय के सर्वेक्षण पारिस्थितिकी तंत्र में पहली बार केम के रूप में औ.एस.टी.एन. आंकड़ों का उपयोग करते हुए यह सर्वेक्षण संचालित किये जाने की योजना है ।
एक व्यापक पूर्ण कालिक वार्षिक सर्वेक्षण के शुभारंभ से पहले, यह मार्गदर्शी अध्ययन मुख्य रूप से चयनित केम की सूचना को मान्य और अद्यतन करने और प्रमुख परिचालन पहियाओं का परीक्षण करने के लिए संचालित किया गया था। इनमें जैसे उद्घम प्रतिक्रिया, सर्वेक्षण निर्देशों की पर्याप्तता और स्पष्टता का आकलन करना, और सत्यापित उद्घम पते पर वितीय विवरण और रोज़रार रजिस्टर जैसे आधिकारिक अभिलेख से आवश्यक आंकड़े एकत्र करने की व्यवहार्यता का आकलन करना शानिल था। इस मार्गदर्शी अध्ययन के निष्कर्ष पूर्ण सर्वेक्षण में प्रतिचयन अभिकल्प, प्रश्नावली, अनुदेश पुस्तिका और आंकड़ा संयहण को सुरड़ करने में मूल्यवान जानकारी घटान करेंगे।
मार्गदर्शी अध्ययन से प्राप्त अनुभवों को तकनीकी रिपोर्ट के रूप में सामने लाया गया है। यह रिपोर्ट औ.एस.टी.एन. हेटाबेस का उपयोग करके सर्वेक्षण करने के विस्मिन परिचालन पहलुओं से संबंधित है। इसके अतिरिक्त, इस रिपोर्ट में कुछ महत्वपूर्ण हेटा निष्कर्ष प्रस्तुत किए गए हैं, जो विशुद्ध रूप से व्यापक गतिविधि बेणी स्तरों, निर्माण, व्यापार और अन्य सेवाओं पर प्रतिदर्श अवलोकनों से प्राप्त हुए हैं। हितधारक पर्याप्त सावधानी बरतने और रिपोर्ट में चर्चा की गई सीमाओं को ध्यान में रखने के बाद इन आंकड़ों का उपयोग और व्याख्या कर सकते हैं।
मैं, तकनीकी सलाहकार समूह, राष्ट्रीय प्रतिदर्श सर्वेक्षण की परिचालन समिति और राष्ट्रीय सांख्यिकी आयोग के अध्यक्ष, और सदस्यों का हार्दिक धन्यवाद करती हूँ कि उन्होंने इस मार्गदर्शी अध्ययन के बारे में बहुमूल्य जानकारी और मार्गदर्शन घटान किया। मैं इस मार्गदर्शी अध्ययन के लिए औ.एस.टी.एन. हेटाबेस साझा करने के लिए केंद्रीय अप्रत्यक्ष कर और सीमा शुल्क बोर्ड की भो बहुत आभारी हूं। मैं उन सभो उद्घर्मा की आभारी हूं, जिन्होंने क्षेत्र अधिकारियों के साथ सहयोग किया और इस मार्गदर्शी अध्ययन के लिए आंकड़े घटान किए।
उद्घम सर्वेक्षण प्रभाग ने सर्वेक्षण पद्धति और उपकरणों, सभंक विधायन और सारणीकरण, और ए.एस.एस.एस.ई. पर मार्गदर्शी अध्ययन की तकनीकी रिपोर्ट तैयार करने का कार्य किया। सर्वेक्षण का क्षेत्र कार्य, क्षेत्र संकार्य प्रभाग दूसरा किया गया था और समल्वय और गुणवत्ता नियंत्रण प्रभाग ने सभी प्राणों में विस्मिन्त्र सर्वेक्षण गतिविधियों का समल्वय किया था। मैं इस मार्गदर्शी अध्ययन को सफलतापूर्वक करने और इस तकनीकी रिपोर्ट को प्रकाशित करने के लिए पूरी टीम के प्रयास की सराहना करती हूं।
मुझे उज्जीद है कि यह तकनीकी रिपोर्ट प्रतिचयन अभिकल्प को अंतिम रूप देने, सर्वेक्षण उपकरणों को परिष्कृत करने और पूर्ण पेंसाने पर सर्वेक्षण के लिए आंकड़ा संयहण पद्धति को ठीक करने में बहुमूल्य इनपुट घटान करेगी । मैं यह भी उज्जीद करती हूं कि इसमें शामिल सभो उपयोगकर्ताओं और हितधारकों के लिए यह एक उपयोगी संदर्भ के रूप में काम करेगा।

The service sector has emerged as the backbone of the Indian economy, forming its most dynamic and dominant component. In terms of economic significance, the service sector contributes the most to India’s GDP and has been a major catalyst for the country’s economic transformation especially in the post-liberalization period. While unincorporated services sector is covered in Annual Survey of Unincorporated Sector Enterprises (ASUSE), there is a lack of consistent data on the economic and operational characteristics, employment, and other related aspects of the incorporated sector, especially at a granular level. The Annual Survey of Services Sector Enterprises (ASSSE) has been conceptualized to address this data gap. The survey is planned to be conducted using GSTN data as sampling frame for the first time in the survey eco-system of National Statistics Office (NSO).
Prior to the launch of a comprehensive full-fledged annual survey, this pilot study was undertaken primarily to validate and update selected frame information as available from GSTN data and to test key operational processes such as enterprise responsiveness, adequacy and clarity of survey instructions, and feasibility of collecting required data from official records such as financial statements and employment registers at the verified enterprise addresses. The findings of this pilot study will provide valuable insights in firming up the sampling design, questionnaire, instruction manual and data collection in the full-fledged survey.
The experiences of the pilot study have been brought out in the form of a Technical Report. This report deals with various operational aspects of conducting the survey using the GSTN database. Additionally, the report presents some key data findings derived purely from sample observations at Broad Activity Category levels; Construction, Trade and Other Services. The stakeholders may use and interpret these data after exercising adequate caution and taking into account the limitations discussed in the report.
I am thankful to Chairman, and the esteemed members of the National Statistical Commission (NSC), Steering Committee for the National Sample Surveys (NSS), Technical Advisory Group for Enterprise Surveys for providing their valuable insights and guidance on this pilot study. I am immensely thankful to the Central Board of Indirect Taxes and Customs for sharing the GSTN database for this pilot study. I also extend my appreciation for all the enterprises that cooperated with the field officers and provided data for this pilot study.
The Enterprise Survey Division (EnSD) undertook the development of survey methodology and instruments, data processing and tabulation, and preparation of the Technical Report of the Pilot Study on ASSSE. Field work of the survey was carried out by the Field Operations Division (FOD) and Coordination and Quality Control Division (C\&QCD) coordinated various survey activities at all stages. I appreciate the effort of the entire team for conducting this pilot study and bringing out this Technical Report.
I hope this Technical Report provides valuable input in finalizing the sampling design, refining the survey instruments, and fine-tuning the data collection methodology for the fullscale survey. I also expect it to serve as a useful reference for all users and stakeholders involved.
विषय-वस्तु
उपयोगकर्ताओं के लिए टिप्पणी
खंड
उपयोगकर्ताओं के लिए टिप्पणी
माfदर्शी अध्ययन का स्नैपशॉट
खंड
मार्गदर्शी अध्ययन का स्नैपशॉट
पृष्ठ स.
II
अध्याय एक: परिचय
खंड
पृष्ठ स.
1.1. पृष्ठभूमि
1
1.2. सर्वेक्षण की विषयपरकता
1.3. ए.एस.एस.एस.ई. पर मार्गदर्शी अध्ययन
1.4. व्याप्ति
1.5. प्रतिचयन फ्रेम तथा प्रतिचयन अभिकल्प
1.6. मार्गदर्शी अध्ययन की समयसौमा
1.7. मार्गदर्शी अध्ययन के सुचारु संचालन तथा गैर-प्रतिचयन
वृटियों को नियंत्रित करने के लिए उठाए गए कदम
1.8. तकनीकी रिपोर्ट की रूपरेखा
1.9. रिपोर्ट की विषय-वस्तु
अध्याय दो: संकल्पना एवं परिभाषाएँ
खंड
पृष्ठ स.
संकल्पनाएँ एवं परिभाषाएँ
खंड
3.1. परिचय ….. 12
3.2. चरण-I का मुख्य अवलोकन ….. 12
3.3. चरण-I के दौरान क्षेत्र अनुप्रम्र ….. 15
3.4. चरण -II का मुख्य अवलोकन ….. 18
3.5. चरण- II के दौरान क्षेत्र अनुप्रम्र ….. 19
3.6. मार्गदर्शी सर्वेक्षण के आंकड़ा निष्कर्ष ….. 25
परिशिष्ट ए: विस्तृत सारणी
सारणी नं.
1 चरण-II स्तर के अनुसार उद्यमों का वितरण (वितीय वर्ष 2022-23) प्रत्येक राज्य/संघ राज्य क्षेत्र के लिए चरण-II (वितीय वर्ष 2022-23) में आवटित और विद्युयमान पाए गए उद्यमों की संख्या
प्रत्येक एनआईसी प्रभाग के लिए चरण-II (वितीय वर्ष 2022-23) में व्यवसाय
के अतिरिक्त स्थानों के प्रतिशत वितरण के साथ-साथ मौजूदा उद्यमों की संख्या
प्रत्येक व्यापक कार्यकलाप श्रेणी (बीएसी) (वितीय वर्ष 2022-23) के लिए
संमठन के प्रकार के अनुसार उद्यमों की संख्या का प्रतिशत वितरण प्रत्येक व्यापक कार्यकलाप श्रेणी (बीएसी) (वितीय वर्ष 2022-23) के
लिए पंजीकरण के प्रकार (सीजीएसटी अधिनियम के अलावा) के अनुसार
उद्यमों की संख्या का प्रतिशत वितरण
प्रत्येक व्यापक कार्यकलाप श्रेणी (बीएसी) (वितीय वर्ष 2022-23) के लिए
उत्पादन के विभिन्न आकार वर्गों द्वारा मुभि और अचल संपत्तियों पर
सूचकांकों का प्रतिशत हिस्सा
प्रत्येक व्यापक कार्यकलाप श्रेणी (बीएसी) (वितीय वर्ष 2022-23) के लिए
7 उत्पादन के विस्मिन्न आकार वर्गों द्वारा कार्यशील पूंजी और ऋण पर
सूचकांकों का प्रतिशत हिस्सा
प्रत्येक व्यापक कार्यकलाप श्रेणी (बीएसी) (वितीय वर्ष 2022-23) के लिए
8 आउटपुट के विस्मिन्न आकार वर्गों द्वारा रोज़गार पर संकेतकों का प्रतिशत हिस्सा
प्रत्येक व्यापक कार्यकलाप श्रेणी (बीएसी) के लिए उत्पादन के विस्मिन्न आकार
वर्गों द्वारा जोड़े गए मूल्य पर सूचकांकों का प्रतिशत हिस्सा (मुख्य रूप से सेवाओं के बाजार उत्पादन में लगे उद्यमों के लिए) (वितीय वर्ष 2022-2023)
पृष्ठ सं.
A – 1
$A-2$
$A-3$
$A-4$
$A-5$
$A-6$
$A-7$
$A-8$
$A-9$
परिशिष्ट B: अनुसूचियाँ (मार्गदर्शी अध्ययन के चरण-I एवं चरण-II)
खंड
चरण-I अनुसूची
B – 1
$B-3$
NOTE TO THE USERS
SECTION
Note to Users
PAGE NO.
I
SNAPSHOT OF THE PILOT STUDY
SECTION
Snapshot of the Pilot Study
PAGENO.
II
CHAPTER 1: INTRODUCTION
SECTION
1.1. Background
1.2. Objectives of the Survey
1.3. Pilot Study on ASSSE
1.4. Coverage
1.5. Sampling Frame and Sampling Design
1.6. Timeline of the Pilot Study
1.7. Measures undertaken for smooth conduct of the Pilot Study and controlling non-sampling errors
1.8. Outline of the Technical Report
1.9. Contents of the Report
CHAPTER 2: CONCEPTS AND DEFINITIONS
SECTION
Concepts and Definitions
PAGE NO.
7
SECTION
PAGE NO.
3.1. Introduction ….. 12
3.2. Key Observations of Phase-I ….. 12
3.3. Field Experiences during Phase-I ….. 15
3.4. Key Observations of Phase-II ….. 18
3.5. Field Experiences during Phase-II ….. 19
3.6. Data Findings of the Pilot Study ….. 25
APPENDIX A: DETAILED TABLES
TABLE NO.
TITLE
PAGE NO.
1 Distribution of Enterprises as per status in Phase-II (FY 2022-23) ….. A – 1
2 Number of Enterprises allotted and found existing in Phase-II (FY 2022-23) for each State/UT ….. A – 2
3 Number of existing enterprises along with percentage distribution ….. A – 3
of additional places of business in Phase-II (FY 2022-23) for each NIC Division
4 Percentage distribution of number of enterprises by type of ….. A – 4
organization for each Broad Activity Category (BAC) (FY 2022- 23)
5 Percentage distribution of number of enterprises by type of ….. A – 5 registration (other than CGST Act) for each Broad Activity Category (BAC) (FY 2022-23)
6 Percentage share of indicators on land and fixed assets by ….. A – 6 different size classes of output for each Broad Activity Category (BAC) (FY 2022-23)
7 Percentage share of indicators on working capital and loans by ….. A – 7 different size classes of output for each Broad Activity Category (BAC) (FY 2022-23)
8 Percentage share of indicators on employment by different size ….. A – 8 classes of output for each Broad Activity Category (BAC) (FY 2022-23)
9 Percentage share of indicators on value added by different size ….. A – 9
classes of output for each Broad Activity Category (BAC) (for enterprises engaged mainly in market production of services) (FY 2022-2023)
APPENDIX B: SCHEDULES (PHASE – I AND PHASE – II OF THE PILOT STUDY
SECTION
PAGE NO.
PHASE-I SCHEDULE
B – 1
PHASE-II SCHEDULE
3पयोगकर्ताओं के लिए नोट
राष्ट्रीय सांखियकी कार्यालय (रा.सां.का.) द्वारा पहली बार किसी भी सर्वेक्षण में प्रतिचयन फ्रेम के रूप में वस्तु एवं सेवा कर नेटवर्क (जीएसटीएन) डेटाबेस का उपयोग करके सेवा क्षेत्र उद्यमों के वार्षिक सर्वेक्षण (एएसएसएसई) पर मार्गदर्शी अध्ययन संचालित किया गया है। मार्गदर्शी अध्ययन का प्राथमिक उद्देश्य जीएसटीएन फ्रेम की उपयुक्तता की जांच करना, क्षेत्रीय कार्य करने के परिचालन तौर-तरीकों, अनुदेश की पर्याप्तता, उद्यमों द्वारा सहयोग का स्तर, उद्यमों के पास आधिकारिक अभिलेखों की उपलब्धता की जांच करना है, जिनका उपयोग अखिल भारतीय स्तर पर एएसएसएसई अनुसूची के विभिन्न खंडों को भरने के लिए किया जा सकता है।
यह रिपोर्ट एएसएसएसई पर मार्गदर्शी अध्ययन के दौरान एकत्रित अभारित प्रतिदर्श अवलोकनों पर आधारित प्रारंभिक निष्कर्षों का एक संयह प्रस्तुत करती है। इन निष्कर्षों का उद्देश्य सर्वेक्षण प्रक्रिया के लिए सूक्ष्म दृष्टि प्रदान करना और व्यापक कार्यकलाप श्रेणियों के भीतर गुणकों का उपयोग करते हुए प्रतिनिधि या सकल-स्तर आकलन निकालने का प्रयास किये बिना विभिन्न उत्पादन आकार-वर्गों में कुछ सांकेतिक पैटर्न को उजागर करना है ।
मार्गदर्शी अध्ययन के दूसरे चरण के प्रतिदर्श आकार में 5,020 उद्यम शामिल थे, जो जीएसटीएन डाटाबेस के 6.85 लाख निगमित सेवा क्षेत्र उद्यमों वाले अनुमानित विशाल समूह का केवल लगभग $0.73 \%$ है। इसके अलावे, चयनित इकाइयों की संख्या के या तो आस्तित्व में न होने, अज्ञात होने अथवा प्रत्युत्तर ने देने के कारण प्रभावी प्रतिदर्श आकार और भी कम हो गया। ये मामले प्रतिचयन भार के प्रयोग से अभिकल्प-आधारित आकलन की उत्पत्ति को बाधित करते हैं क्योंकि ऐसे आकलन उच्च प्रतिचयन अस्थिरता, अन्य डेटा स्रोतों के साथ अनुचित और अवांछनीय तुलना जैसे मसलों से यस्त होंगे।
इस तकनीकी रिपोर्ट में तालिकाओं और विवरणों के रूप में दर्शाए गए सभी परिणाम किसी भी गुणक का उपयोग किए बिना केवल प्रतिदर्श अवलोकनों से प्राप्त किए गए हैं। चरण-II में 5,020 इकाइयों के इतने कम प्रतिदर्श आकार के आधार पर मापदंडों का आकलन निकालने का कोई भी प्रयास नहीं किया गया है। इस रिपोर्ट में, विभिन्न सूचक्इकोन के प्रतिशतता वितरण निकालने के लिए उपयोग किये गए सकल आंकड़े प्रतिदर्श मानों के योग का उपयोग करके प्राप्त किए गए हैं। इस प्रकार, निर्माण, व्यापार और अन्य सेवाओं के व्यापक कार्यकलाप श्रेणी (बीएसी) स्तर के सूचकांक उस बीएसी में सभी सर्वेक्षित इकाइयों के संगत मापदंड मानों को जोड़कर तैयार किए गए हैं और इसलिए वे उस डोमेन में अपेक्षाकृत बड़ी इकाइयों से काफी हद तक प्रभावित होते हैं। इसके कारण, डोमेन स्तर के सूचकांकों के संबंध में पर्याप्त सावधानी बरती जानी चाहिए क्योंकि वे डोमेन के वास्तविक समुत्तचयों के सूचकांक या तुलनीय नही हो सकते हैं।
इस रिपोर्ट के उपयोगकर्ताओं को दृढ़ सलाह दी जाती है कि वे उपरोक्त तथ्यों को ध्यान में रखते हुए परिणामों का सावधानी के साथ विवेचन करें।
Note to Users
The Pilot Study on Annual Survey of Services Sector Enterprises (ASSSE) has been conducted using the Goods and Services Tax Network (GSTN) database as sampling frame for the first time in any survey conducted by National Statistics Office (NSO). The primary objective of the pilot study has been to examine the suitability of the GSTN frame, to test the operational modalities of carrying out the field work, sufficiency of the instruction, degree of co-operation of the enterprises, availability of the official records at the enterprises which can be used to fill the different blocks of the ASSSE schedule, etc. at pan-India level.
This report presents a set of preliminary findings based solely on unweighted sample observations collected during the Pilot Study on ASSSE. These findings are meant to offer insights into the survey process and highlight certain indicative patterns across different output size-classes within the broad activity categories, without attempting to generate representative or aggregate-level estimates by using multipliers.
The sample size of the Phase-II of the Pilot Study consisted of 5,020 enterprises, which corresponds to only about $0.73 \%$ of the estimated universe of 6.85 lakh incorporated service sector enterprises of GSTN database. Furthermore, the effective sample size was further reduced due to a number of selected units being either non-existent, non-traceable, or nonresponsive. These issues constrain generation of design-based estimates applying sampling weights since such estimates would have suffered from issues like high sampling fluctuations, unreasonable and undesirable comparison with other data sources.
All the results shown in the form of tables and statements in this technical report are obtained from sample observations only, without using any multipliers. No attempt has been made to estimate parameters based on such low sample size of 5,020 units in Phase-II. In this report, the aggregate figures used for deriving the percentage distribution of various indicators are obtained using the total of sample values. Thus, indicators at Broad Activity Category (BAC) level of Construction, Trade and Other Services have been generated by adding the corresponding parameter values of all the surveyed units in that BAC and hence they are largely influenced by the relatively bigger units in that domain. In view of this, the domain level indicators should be treated with adequate caution as they may not be indicative of or comparable to the actual aggregates of the domain.
Users of this report are strongly advised to interpret the results with caution taking into account the facts stated above.
सेवा क्षेत्र उद्यम्नों के वार्षिक सर्वेक्षण (ए.एस.एस.ई.) पर मार्गदर्शी अध्ययन ने व्यापक गतिविधि श्रेणियों में निर्माण, व्यापार और अन्य सेवाओं में अर्थव्यवस्था के गैर – निगमित सेवा क्षेत्र को सभिमनित किया है । मार्गदर्शी अध्ययन जी.एस.टी.एन. डेटाबेस का उपयोग एक फ्रेम के रूप में कराते हुए संचालित किया गया है।

A 10,005 उदयमों को सर्वेक्षित किया गया।
2
क्षेत्र कार्य की अवधि मई, 2024 से अगस्त, 2024 थी।
B
5,020 उदयमों को सांख्यिकी संयुक्त के अधिनियम के अंतर्गत सर्वेक्षित किया गया।
2
क्षेत्र कार्य का अवधि नवम्बर, 2024 से जनवरी, 2025 थी।
मार्गदर्शी अध्ययन
की संदर्भ अवधि
अभैल, 2022
मार्गदर्शी अध्ययन का क्षेत्र अनुभव
अधिकांश उद्यम परिचालन में पाए गए और फ्रेम में दिए गए पते पर स्थित थे।
प्रत्युत्तर देने वाली अधिकांश इकाईयां सूचना/आंकड़े प्रस्तुत करने में सहयोग करती पाई गई।
अन्य राज्यों में मुख्यालय वाली इकाइयों से आंकड़े एकत्र करने में अधिक प्रयास की आवश्यकता पड़ी।
उद्यम के समेकित तुलन-पत्र से आंकड़ों को द्रविभाजित करने में कठिनाई हुई।
आवश्यक आंकड़े एकत्र करने के लिए कई अनुवर्ती और अनुस्मारकों की आवश्यकता थी क्योंकि कुछ उद्यम्न वित्तीय विवरण, तुलन-पत्र, जी.एस.टी.एन. संबंधित आंकड़े प्रदान करने के लिए अनिच्छुक थे।
काफी संख्या में उद्यम या तो उनके दिए गए पते (चरण-। में) में स्थित नहीं थे या विभिन्न कारणों से सर्वेक्षण (चरण I और II में) का जवाब नहीं देते थे।
The pilot study on Annual Survey of Services Sector Enterprises (ASSSE) covered the incorporated service sector of the economy across the Broad Activity Categories Construction, Trade and Other Services. The Pilot Study has been conducted using the GSTN database as sampling frame.

10,005 enterprises have been surveyed
The fieldwork spanned from May, 2024 to August, 2024
PHASE-II
5,020 enterprises have been surveyed under the aegis of Collection of Statistics Act
The fieldwork spanned from November, 2024 to January, 2025

Reference Period of the Pilot Study
April, 2022
March, 2023
Field experiences of the Pilot Study
Majority of the enterprises were found to be operational and located at the address given in the frame
Majority of the responding units were found to be cooperative in furnishing information/data
Units with headquarters in other states required significant efforts in collecting data
Difficulty in apportioning data of the selected GSTIN from combined balance sheets of the enterprise
Required multiple follow ups and reminders to collect necessary data as some enterprises were reluctant to provide financial statements, balance sheets, GSTN related data
A good number of enterprises either could not be located in their given address (in Phase-I) or did not respond to the survey (in Phases I \& II) due to various reasons
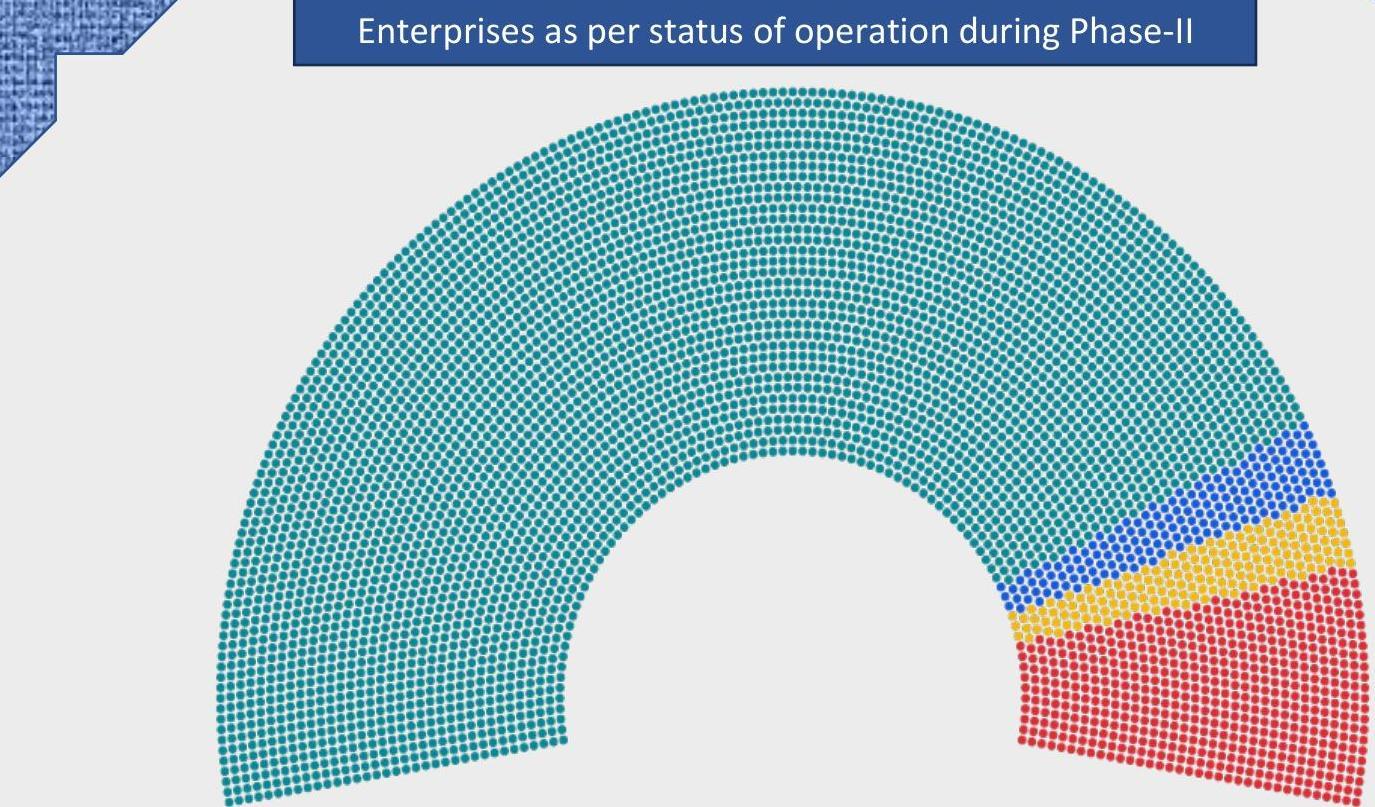
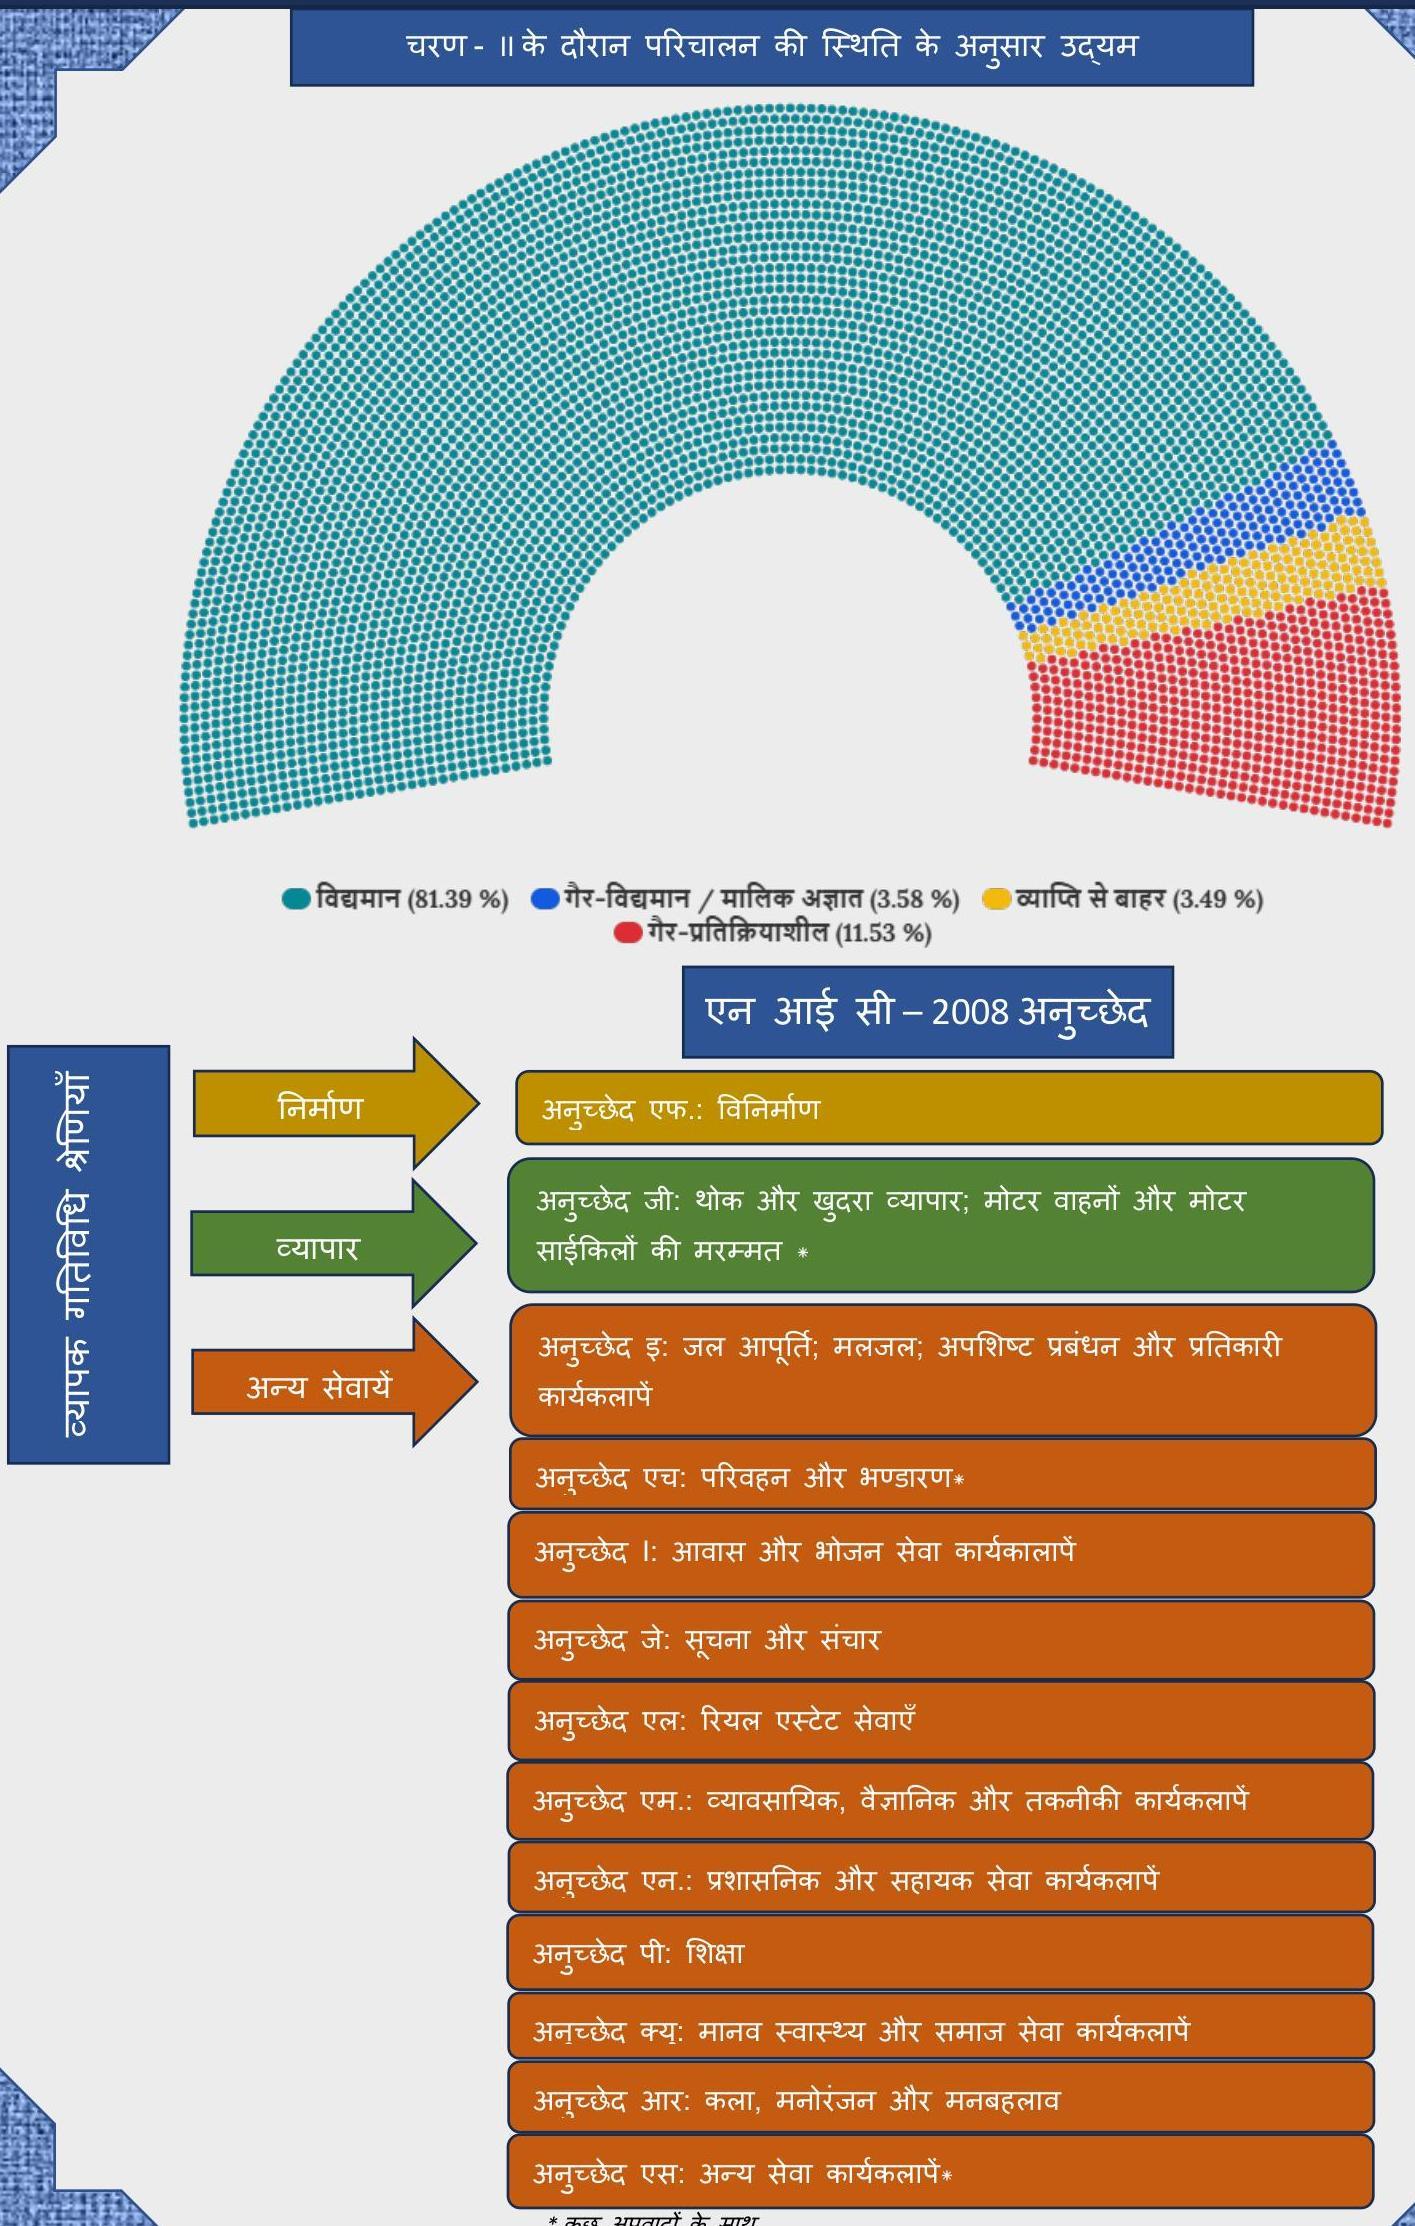
- Existing (81.39 \%) Non-Existing / Owner not traceable (3.58 \%)
- Out of Coverage (3.49 \%) Non-Response (11.53 \%)
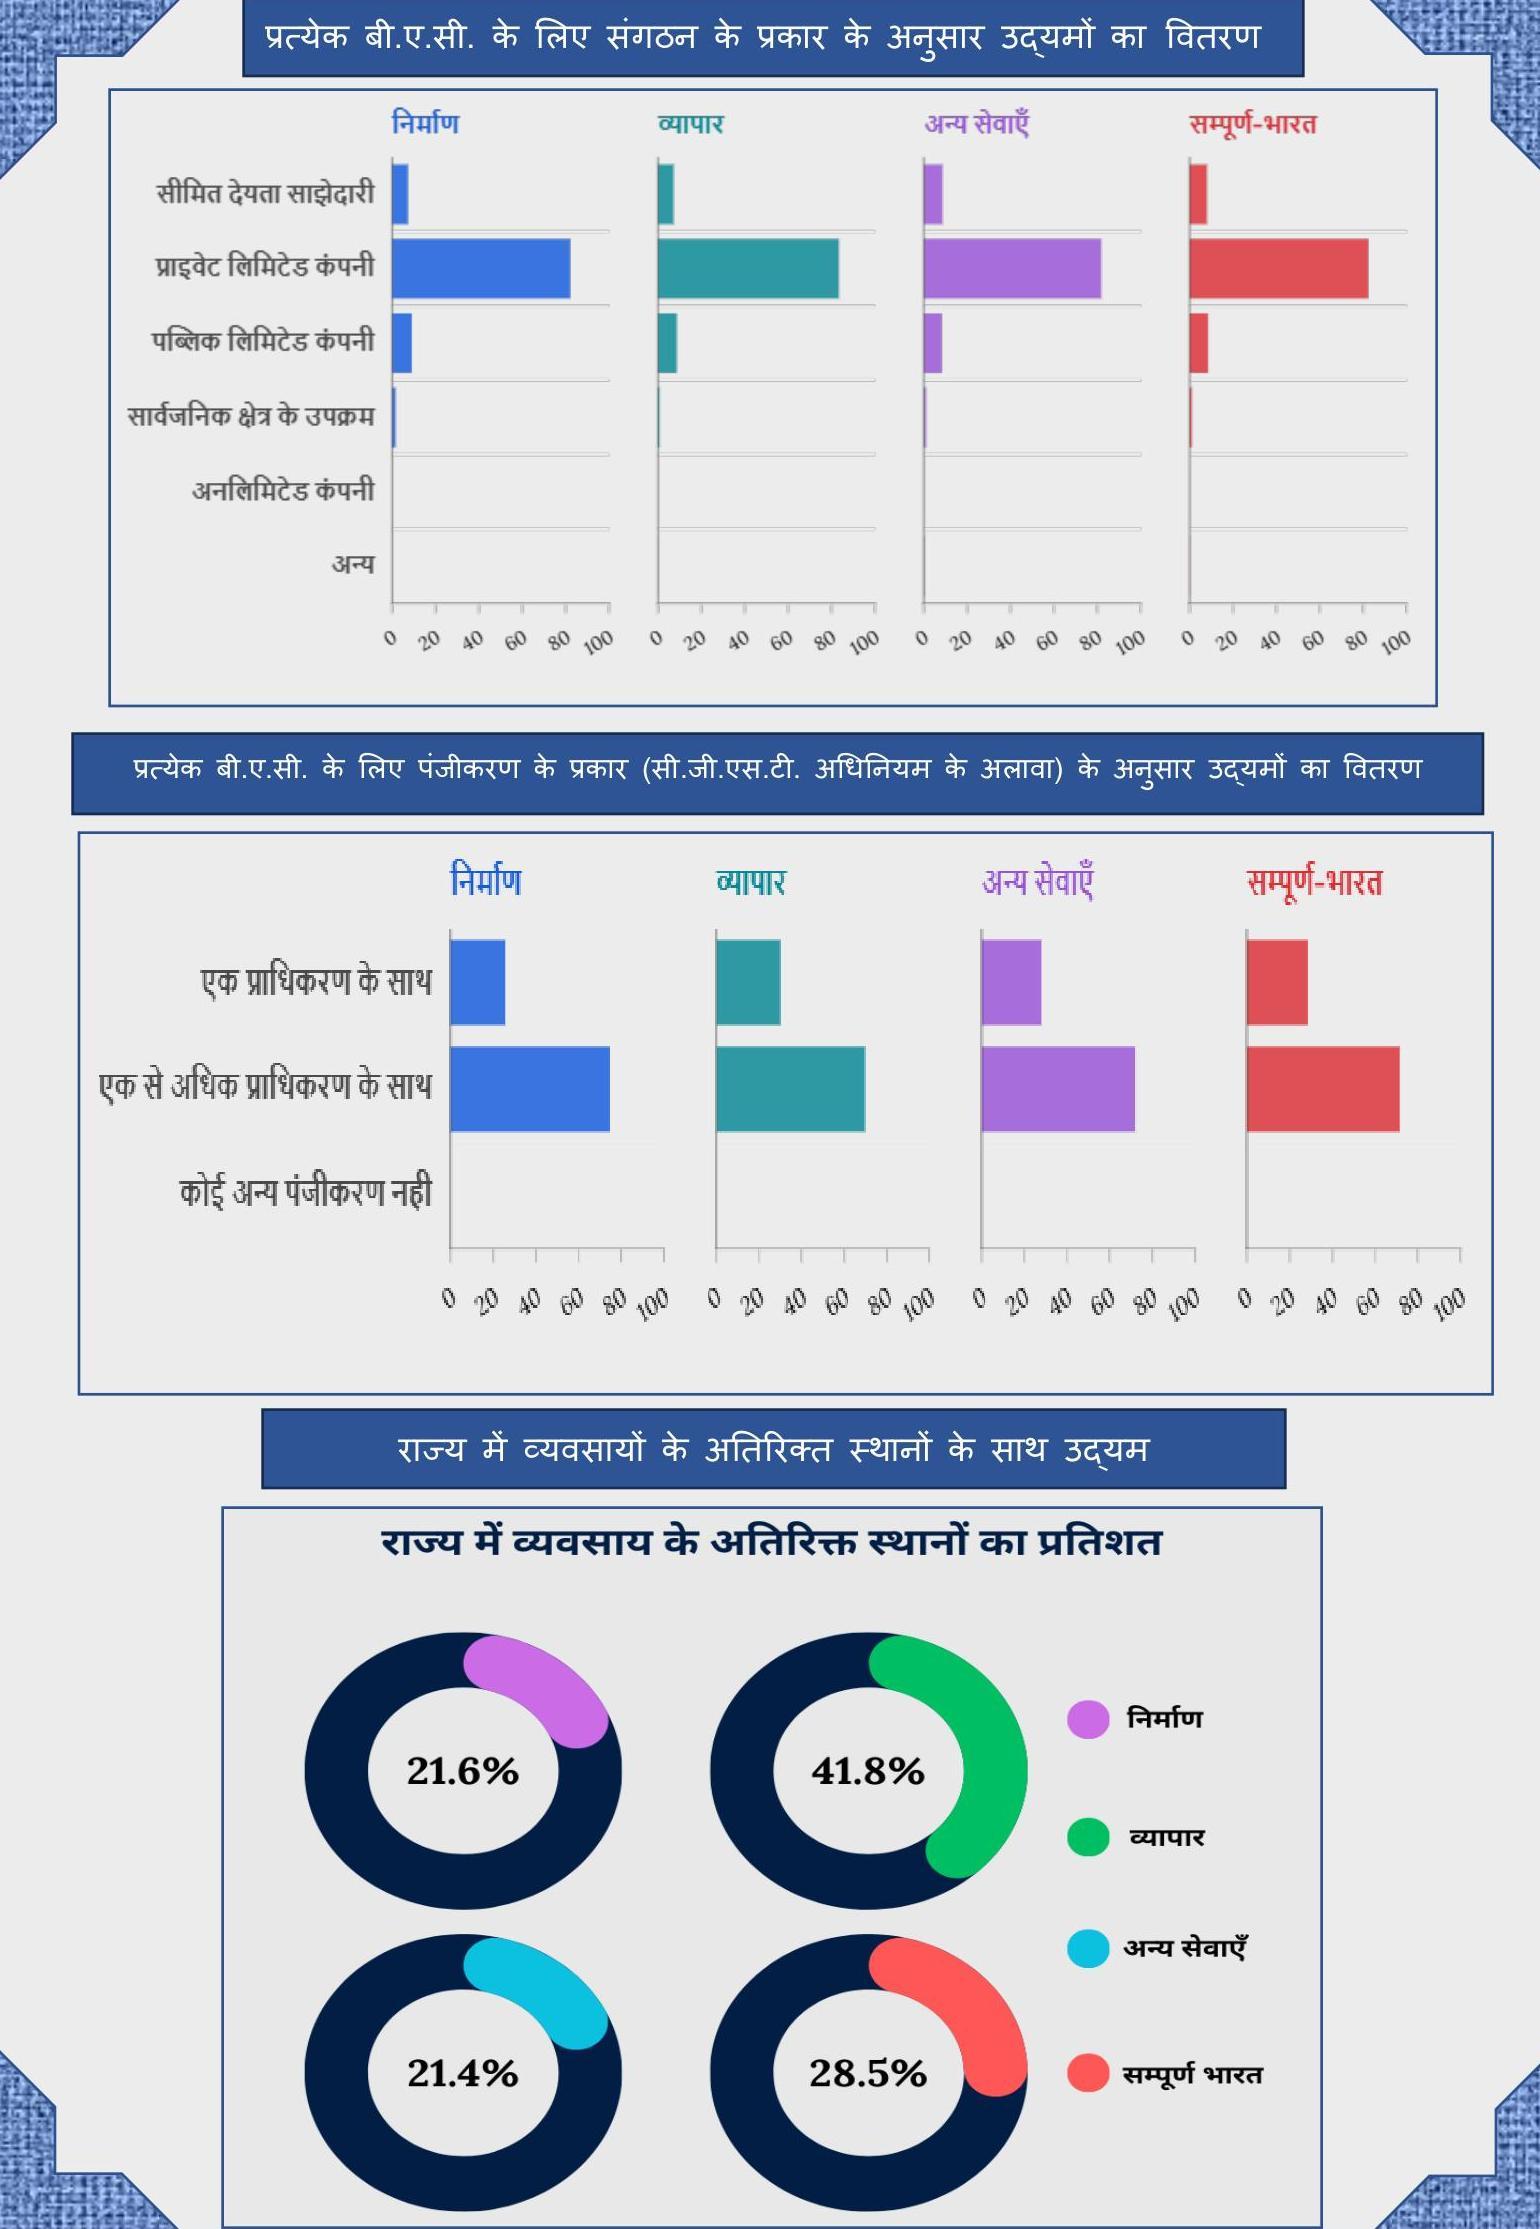
Distribution of enterprises by type of registration (other than CGST Act) for each BAC
Chapter One
INTRODUCTION
1.1. Background
1.1.1. The National Statistics Office (NSO), under the Ministry of Statistics and Programme Implementation (MoSPI) of the Government of India, conducts large-scale nationwide sample surveys employing scientific sampling methods to collect data on diverse socioeconomic aspects. NSS data helps in understanding key socio-economic issues and supports evidence-based policymaking and planning at both the national and state levels.
1.1.2. The service sector is a key driver of India’s economy, contributing a substantial portion to the country’s GDP and providing millions of jobs. Accurate and comprehensive data on this sector is crucial for informed policymaking, strategic planning, and investment decisions. While the unincorporated part of the service sector is covered in Annual Survey of Unincorporated Sector Enterprises (ASUSE), there is a lack of consistent data on the economic and operational characteristics, employment, and other related aspects, especially with industry-wise or State/UT-wise breakdowns in the incorporated sector. This gap in data is primarily due to the absence of a regular national-level survey covering the various subsectors of the incorporated non-agricultural and non-manufacturing sectors. To address this issue, there was a felt need to prepare a comprehensive database for corporate service sector enterprises, providing detailed and granular data for better understanding of this vital sector. Meanwhile, PMO also advised National Statistics Office (NSO) to conduct an annual enterprise survey using Goods and Services Tax Network (GSTN), established under the aegis of Central Goods and Services Tax (CGST) Act, 2017, as sampling frame. This prompted the conceptualization of the Annual Survey of Services Sector Enterprises (ASSSE) to fill the data gap and enhancing the understanding of the corporate service sector.
1.1.3. Prior to the launch of the comprehensive full-fledged annual survey, a pilot study, following an enterprise approach, has been envisaged primarily to examine the suitability of the GSTN data for the purpose of sampling frame for ASSSE. In addition to that, the pilot study on ASSSE has also been conducted to test the operational modalities of carrying out the field work, sufficiency of the instruction, degree of co-operation of the enterprises, availability of the official records at the enterprises which can be used to fill the different blocks of the ASSSE schedule, etc. at pan-India level. These records include books of accounts, profit and loss statements, labour registers, and other relevant documents. The findings of this pilot study will offer valuable insights to finalize the design and execution of the full-fledged survey. This report aims to present the key takeaways from the pilot.
1.2. Objectives of the survey
1.2.1. The principal objective of Annual Survey of Services Sector Enterprises (ASSSE) is essentially to develop a comprehensive database of the incorporated service sector of the country which is not available presently. Given the importance of the service sector, it is imperative that a survey may be designed to capture the key characteristics such as gross value added (GVA), fixed capital, capital formation, number of persons employed, emoluments paid and other important features pertaining to the units belonging to service sector not only at State level but also at different industry level. ASSSE has been designed exclusively for this purpose to cover the corporate part of service sector. ASSSE, combined
with Annual Survey of Unincorporated Sector Enterprises (ASUSE) and Annual Survey of Industries (ASI) is expected to provide a complete picture of the non-agricultural economy of the country.
1.2.2. A full-fledged ASSSE would bring out the economic and operational characteristics of the incorporated non-agricultural enterprises in Construction, Trade and Other Services Sector of the economy. This will help in compilation of National Accounts Statistics at national and state level. Data collected in this survey will also help in meeting the requirements of different ministries, organizations and users, in general.
1.3. Pilot Study on ASSSE
1.3.1. The Pilot Study of ASSSE has been conducted in two phases (Phase-I and Phase-II). Phase-I of the pilot study was carried out inter alia to verify and update relevant frame information and collect other information as required; whereas, Phase-II of the survey was conducted to canvass detailed schedule using books of accounts and other relevant records under the aegis of Collection of Statistics Act in respect of some selected units of Phase-I.
1.3.2. Objective of the Pilot Study: The objectives of the Pilot Study were:
- To verify and update selected information viz., name, address, activity(ies), number of establishments in the State/UT, etc., that were available in the frame
- To ascertain the current working status of the enterprise.
- To test the operational modalities such as, response of the enterprises, whether instruction is sufficient to collect the requisite data, etc.
- Whether data for estimating important parameters were collectable from the official records such as, Books of Accounts (including profit and loss statement), labour register, etc. maintained by the enterprises.
- To gather experience in ASSSE for all-India scenario.
The phase-wise objectives of the Pilot Study were as follows:
Phase-I
- To verify and update selected frame information such as, name, address, activity(ies), number of establishments in the State, etc.
- To collect quantitative information such as gross sale value, employment, etc. for the accounting period which would be used for Phase-II
- To ascertain the current status of the enterprise.
Phase-II
- To canvass the detailed schedule using Collection of Statistics Act and examine the level of compliance among the enterprises.
- To collect information on fixed capital, working capital, employment details, expenses, receipts, etc. using records maintained by the enterprises, which may be used for compiling different parameters.
1.4. Coverage
1.4.1. The coverage of ASSSE is essentially the corporate entities i.e. entities registered under Companies Act, 1956 or, Companies Act, 2013 or Limited Liability Partnership (LLP) Act, 2008 and belonging to service sector. Unincorporated entities are excluded from coverage of ASSSE.
1.4.2. Geographically, the survey covers the whole of the Indian Union. Hence, all the State/UTs have been covered in the pilot study.
1.4.3. As per business type, corporate entities like, Limited Liability Partnerships, Private Limited Company, Public Limited Company, Public Sector Undertakings, Unlimited Companies etc. have been included in the survey coverage.
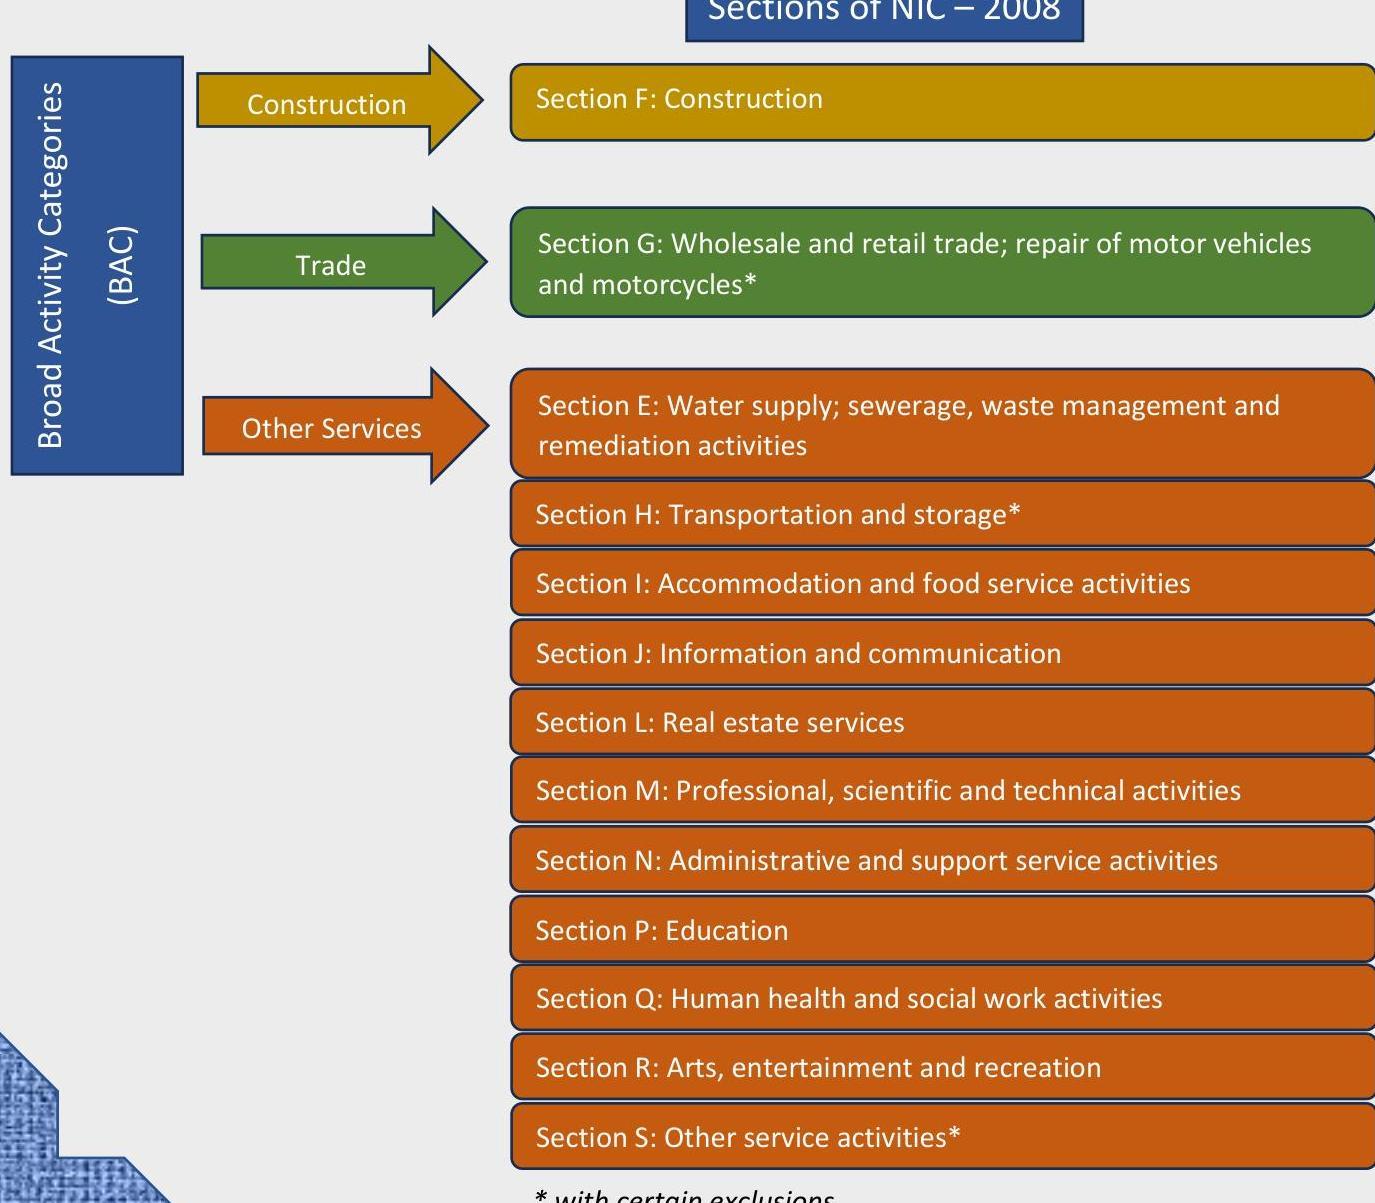
1.4.4. Activity-wise following sections of National Industrial Classification (NIC)-2008 were covered in the pilot:
| Sections of NIC 2008 | Description of activities |
|---|---|
| E | Water supply; sewerage, waste management and remediation activities |
| F | Construction |
| G | Wholesale and retail trade; repair of motor vehicles and motorcycles However, Maintenance and repair of motor vehicles (NIC code 45200) and maintenance and repair of motor cycles, mopeds, scooters and three Wheelers vehicles (NIC code 45403) are excluded. |
| H | Transportation and storage All activities except (a) Transport via railways (NIC Code 491), Urban or suburban tramways (NIC Code 49212), Urban or suburban underground or elevated railways (49213) and Transport via pipeline (NIC Code 493), and (b) Air transport (NIC Code 51). However, non-scheduled airlines (i.e., an air transport service other than scheduled air transport service and that may be on charter basis and/or non-scheduled basis; and, further, the operator is not permitted to publish time schedule and issue tickets to passengers) are to be considered. |
| I | Accommodation and Food service activities |
| J | Information and communication |
| L | Real estate activities |
| M | Professional, scientific and technical activities |
| N | Administrative and support service activities |
| P | Education |
| Q | Human health and social work activities |
| R | Arts, entertainment and recreation |
| S | Other service activities except ‘activities of trade unions’ (NIC Code 942) and ‘activities of political organisations’ (NIC Code 9492) |
1.4.5. There were certain activities in service sector which were not covered in ASSSE. The following sections of NIC – 2008 activities of service sector were excluded from the coverage for this Pilot Study.
| Section of NIC 2008 |
Description of activities |
|---|---|
| K | Financial and insurance activities (NIC 64, 65, 66) |
| O | Public administration and defence; compulsory social security (NIC 84) |
| T | Activities of households as employers; undifferentiated goods and services producing activities of households for own use (NIC 97, 98) |
| U | Activities of extraterritorial organizations and bodies (NIC 99) |
1.4.6. The various NIC-2008 Divisions that are under the coverage of ASSSE are classified into Construction (NIC 2008 Divisions 41, 42, 43), Trade (NIC 2008 Divisions 45, 46, 47), and Other Services Sector (NIC 2008 divisions 36-39, 49-53, 55-56, 58-63, 68-75, 77-82, 85-$88,90-96)$.
1.5. Sampling Frame and Sampling Design
1.5.1. The GSTN frame containing about 6.85 lakh corporate enterprises belonging to ‘Construction’, ‘Trade’ and ‘Other Services’ has been used as the sampling frame for the Pilot Study on ASSSE.
1.5.2. The Pilot Study on ASSSE has been conducted using a Two-Phase sampling design. Stratified Simple Random Sampling without Replacement has been followed in both the phases. A total of 10,005 enterprises have been surveyed in Phase-I, with respect to the reference period FY 2022-2023 (April 2022 – March 2023), mainly to verify and update the relevant frame information like name of the enterprise, address of the enterprise etc. From these enterprises, 5,020 units have been selected for Phase-II of the survey where the detailed schedule has been canvassed under the Collection of Statistics (COS) Act and data have been collected from books of accounts, balance sheets, profit and loss accounts and other records maintained by the enterprises for the same reference period.
1.6. Timeline of the Pilot Study
1.6.1. Phase-I of the Pilot Study was conducted during May 2024 to August 2024, during which 10,005 enterprises were surveyed across India. After filtering out non-existent enterprises, those with untraceable owners/occupiers, and those falling outside the study’s coverage, from among the remaining eligible units, a total of 5,020 enterprises were selected for Phase-II. Phase-II of the Pilot Study took place over three months, from November 2024 to January 2025. The notices under COS Act were issued in the month of October 2024.
1.7. Measures undertaken for smooth conduct of the Pilot Study and controlling nonsampling errors
1.7.1. A two-phase sampling design was implemented for the Pilot Study on the Annual Survey of Services Sector Enterprises (ASSSE) leveraging the GSTN database. To ensure smooth and successful execution of the survey, minimize non-sampling errors and enhance
data accuracy, several procedural and operational measures have been taken in both phases. This, inter alia, included embedding several scrutiny-checks at entry level of the Computer Assisted Personal Interviewing (CAPI) software used for the Pilot, providing detailed training to field officials, addressing field queries in real-time during the field work, carrying out multi-layer scrutiny and validation on the data received from field and coordinating with stake-holders.
1.7.2. During Phase-I, zonal level workshops of trainers were conducted across various locations. These workshops played a crucial role in training field officials and ensuring they were well-acquainted with the concepts and prepared for data collection. Demonstration of effective use of CAPI was also carried out during the training sessions. Additionally, a virtual training was organized before the commencement of fieldwork, serving as a refresher training session to reinforce procedural understanding among field functionaries just before going to field. Educative videos demonstrating the use of CAPI were also shared with field offices for ready-reference. Enterprise Survey Division (EnSD) was actively involved in addressing issues and resolving queries to facilitate smooth execution of the pilot. During Phase-I, all the queries were resolved, covering issues raised during zonal-level training sessions as well as field-related problems encountered during data collection. This proactive approach ensured that field functionaries were well-equipped to carry out their responsibilities efficiently.
1.7.3. During Phase-II, extensive training session was held over two days as part of the All India Workshop of Trainers (AIWOT). This session provided detailed guidance on both conceptual aspects and the use of CAPI. During this phase, more than 350 field queries were answered by EnSD, demonstrating NSO’s commitment to ensuring clarity and precision throughout the survey process. Simultaneous with the fieldwork, thorough and extensive scrutiny of data was carried out, with several schedules being sent back to the field for corrections and clarifications. In fact, all the quality measures that are taken in a full-fledged survey conducted by NSS have been undertaken for this Pilot as well.
1.8. Outline of the Technical Report
1.8.1. The results of the Pilot Study on Annual Survey of Services Sector Enterprises are released in the form of a Technical Report based on feedback and experience gained in the Pilot along with percentage distribution of a few parameters and indicators generated from the sample data across various output size-classes.
1.8.2. Considering the sample size of 5020 units from the population of 6.85 lakh enterprises (with a sampling fraction of only $0.73 \%$ ) and the fact that a number of selected units were found to be non-existing and/or non-responding for various reasons, no design-based estimate has been attempted based on this Pilot Study.
Any design-based estimate generated based on this small dataset is expected to suffer from the following drawbacks:
(i) The estimates may be subject to high sampling fluctuation because of very small sample size.
(ii) This may lead to undesirable and unreasonable comparisons with the results of the full-fledged annual survey when it will be rolled out in the following years.
1.8.3. Taking these limitations into account, the Technical Advisory Group for Enterprise Surveys and the Steering Committee for NSS surveys recommended to bring out some key findings in this report based only on sample observations without using the design-based multiplier. The figures presented in this report are thus not indicative of or comparable to the overall aggregates of the domains. Hence, the report does not include any aggregate estimates. Instead, it focuses on the percentage distribution of few important indicators across different output size-classes generated using unweighted sample observations.
1.8.4. The results in this report include the key operational and economic characteristics of the enterprises that were covered in this Pilot Study belonging to the incorporated service sector. Operational Characteristics would broadly cover distribution of enterprises by the type of organization and also, distribution of the enterprise as per their status of operation during the reference period (FY 2022-23) and additional places of business. Economic Characteristics would broadly cover distribution of enterprises by value of fixed assets, loans, value of input, value of output, Gross Value Added (GVA), employment, compensation, etc.
1.9. Contents of the Report
1.9.1. This report contains three chapters and two appendices. Following the present introductory chapter (Chapter One), ‘Chapter Two’ highlights the concepts and definitions of various terms used in this Pilot Study on ASSSE. ‘Chapter Three’ presents the summary of experience gathered and also the major findings of the Pilot Study. Detailed tables forming the basis of this report have been provided at Appendix A. Appendix B provides a copy of the Schedule of both Phase-I and Phase-II of Pilot Study on ASSSE.
Chapter Two
CONCEPTS \& DEFINITIONS
2. Concepts and Definitions
2.1. Enterprise: An institutional unit ${ }^{1}$ in its capacity as a producer of goods and services is known as an enterprise. An enterprise is an economic transactor with autonomy in respect of financial and investment decision-making, as well as authority and responsibility for allocating resources for the production of goods and services. It may be engaged in one or more economic activities at one or more locations. For this Pilot Study using GSTN frame, the term ‘enterprise’ referred to as a GSTN unit conducting operations in a particular state. As per GSTN nomenclature, the term enterprise is analogous to ‘principal place of business’ which may have one or more ‘additional place of business’ (commonly understood as establishments) in the state.
2.2. Establishment: An establishment is an enterprise, or part of an enterprise, that is situated in a single location and in which only a single productive activity is carried out or in which the principal productive activity accounts for most of the value added. The enterprise and the establishment are the same for single-establishment firms.
2.3. Manufacturing Enterprise: A manufacturing enterprise is an enterprise engaged in the physical or chemical transformation of materials, substances or components into new products. It covers enterprises working for other concerns on materials supplied by them. It also includes enterprises primarily engaged in maintenance and repair of industrial, commercial and similar machinery \& equipment, which are, in general, classified in the same class of manufacturing as those specializing in manufacturing the goods. Thus, all activities covered by NIC-2008 divisions 10 to 33 have been considered as manufacturing activity.
2.4. Trading Enterprise: A trading enterprise is an enterprise engaged in trade. Trade is defined to be an act of purchase of goods and their disposal by way of sale without any intermediate physical transformation of the goods. Thus, all the trading activities, both wholesale and retail listed under NIC-2008 divisions 45 to 47 have been treated as trade. The activities of intermediaries who do not actually purchase or sell goods but only arrange their purchase and sale and earn remuneration by way of brokerage and commission are also to be treated as trade. Thus, purchase and sale agents, brokers and auctioneers listed under NIC2008 division/group were under the survey coverage.
2.5. Service Enterprise: Services are the result of a production activity that changes the conditions of the consuming units, or facilitates the exchange of products or financial assets ${ }^{2}$. These types of service may be described as ‘change effecting services’ and ‘margin services’ respectively. Change-effecting services typically consist of changes in the conditions of the consuming units realized by the activities of producers at the demand of the consumers. Change-effecting services are not separate entities over which ownership rights can be established. They cannot be traded separately from their production. By the time their production is completed, they must have been provided to the consumers.
2.5.1. Some examples of changes that a producer of service brings about in the condition of consumers of service are:
a) Changes in the condition of consumer’s goods: the producer works directly on goods owned by the consumer by transporting, cleaning, repairing or otherwise transforming them;
b) Changes in the physical condition of persons: the producer transports the persons, provides them with accommodation, provides them with medical or surgical treatments, improves their appearance etc.;
c) Changes in the mental condition of persons: the producer provides education, information, advice, entertainment or similar services;
2.5.2. The changes may be temporary or permanent. For example, medical or education services may result in permanent changes in the condition of the consumers from which benefits may be derived over many years. On the other hand, attending a football match is a short-lived experience. In general, the changes may be presumed to be improvements, as services are produced at the demand of the consumers. The improvements usually become embodied in the persons of the consumers or the goods they own and are not separate entities that belong to the producer. Such improvements cannot be held in inventories by the producer or traded separately from their production.
2.5.3. A single process of production may provide services to a group of persons, or units, simultaneously. For example, group of persons or goods belonging to different institutional units may be transported together in the same plane, ship, train or other vehicle. People may be instructed or entertained in groups by attending the same class, lecture or performance. Certain services are provided collectively to the community as a whole, or large sections of the community, for example, the maintenance of law and order, and defence.
2.5.4. Margin services result when one institutional unit facilitates the change of ownership of goods, knowledge-capturing products ${ }^{3}$, some services or financial assets ${ }^{4}$ between two other institutional units. Margin services are provided by wholesalers and retailers ${ }^{5}$ and by many types of financial institutions. Margin services resemble change-effecting services in that they are not separate entities over which ownership rights can be established. They cannot be traded separately from their production. By the time their production is completed they must have been provided to the consumers.
2.6. Central Goods and Services Tax (CGST) Act, 2017: An Act, which has come into force by Government of India w.e.f. 1st July, 2017 to make a provision for levy and collection of tax on intra-State and inter-State supply of goods or services or both by the Central Government.
2.7. Goods and Services Tax Network (GSTN): GSTN is the authority which has been entrusted with the job of building and maintaining the IT infrastructure and platform for serving the need of different stakeholders in relation to GST.
2.8. Goods and Services Tax Identification Number (GSTIN): GSTIN is a 15-digit alphanumeric number which is allotted to each taxpayer on registration in the GST network.
2.9. Limited Liability Partnership: A Limited Liability Partnership (LLP) is a legal entity that gives the benefits of limited liability of a company and the flexibility of a partnership. As LLP is a separate legal entity, it is liable to the full extent of its assets but liability of the partners is limited to their agreed contribution in the LLP. Further, no partner is liable on account of the independent or un-authorized actions of other partners, thus individual partners
are shielded from joint liability created by another partner’s wrongful business decisions or misconduct and it also exonerates all the partners from attaching their personal assets in case of liquidation. Mutual rights and duties of the partners within a LLP are governed by an agreement between the partners or between the partners and the LLP as the case may be.
2.10. Limited Company: A limited company is a legal entity that is incorporated in Companies Act, 1956 or Companies Act, 2013 and that limits the amount of liability undertaken by the company’s shareholders to the tune of their stake in the company by way of investments. Because of this, owners’ (including shareholders) potential losses are limited to what they have invested while their personal assets and income are off-limits. The primary benefit of a limited company is the separation of assets and income from the corporation. This means that if a company goes bankrupt, shareholders can only lose as much as their original investment and no more; creditors or other stakeholders cannot claim owners’ personal assets or income. Because of limited liability, investors/shareholders are more eager to risk capital since their losses are limited in that sense. Further, being an entity of limited company, it is mandatory to file their annual accounts to the registered authority.
2.11. Private Limited Company: A private limited company is a limited company where number of shareholders is at least 2 and maximum number of shareholders is 200 . Further, the formation of private limited company prevents the general public from subscribing to them.
2.12. Public Limited Company: A Public Limited Company is a limited company where number of shareholders is at least 7 and there is no upper limit for number of shareholders.
2.13. Public Sector Undertakings (PSU): A Public Sector Undertaking (PSU) means an entity, in which not less than fifty-one per cent of the paid-up share capital is held by either the Central Government, or by any State Government(s) or partly by the Central Government and partly by one or more State Governments. Further, a PSU may be a company in which the Central Government or one or more State Government(s) either singly or together, exercise control over management or exercise power to appoint majority of directors.
2.14. Unlimited Company: In Unlimited Companies, the liabilities of the shareholders are unlimited, that is, if the company has to liquidate, then there is no protection for the shareholders, and there is essentially no limit on what they can lose in order to pay back creditors. However, the advantage of being an unlimited company is that, like limited company, it is not mandatory to file annual return with the concerned authority.
2.15. Accounting Period: The accounting period for the survey is the period for which the enterprise finalizes its books of account. By and large, the accounting year of all enterprises is from $1^{\text {st }}$ April of the preceding year to $31^{\text {st }}$ March of the current year. For example, accounting period FY 2022-23, in general, will mean the period which runs from $1^{\text {st }}$ April, 2022 to $31^{\text {st }}$ March, 2023.
2.16. Fixed Assets: Fixed assets are of a permanent nature having a productive life of more than one year, which is meant for producing service activities of the enterprise and not for the purpose of sale in ordinary course of business. Fixed assets include produced assets used for production of services, transportation, living or recreational facilities, hospital, school, etc. In addition to that, fixed assets also include major repairs, during the accounting period, which add significant value to the working life of the fixed assets (as distinct of minor repair). The
fixed assets also include R\&D and other intellectual property products. On the other hand, fixed assets exclude non-produced intangible assets, such as, goodwill, etc.
2.17. Depreciation: Depreciation is consumption of fixed capital (CFC) due to wear and tear and obsolescence during the accounting year. It is applicable to all the tangible assets such as land, building, plant \& machinery transport equipment, etc.
2.18. Amortization: Amortization is the systematic allocation of the depreciable amount of an intangible asset over its useful life. Thus, it is similar to depreciation which is used in the context of intangible assets.
2.19. Working Capital: Working capital represents the excess of total current assets over total current liabilities as on last day of the accounting period. Current assets are those receivable within a year. It includes materials, supplies, stores, semi-finished goods, cash-inhand \& at bank, revenue receivable, etc. On the other hand, Current liabilities are those payable within a year. Current liabilities include amount payable to the suppliers, cash credit, over draft, short term loan, etc.
2.20. Outstanding Loans: Outstanding loans represent all long-term liabilities of the enterprise. It includes all long-term loans, whether interest bearing or not, outstanding according to the books of accounts as on the closing day of accounting year. But, in context of ASSSE, this represents loans which have duration of more than one year (i.e. long-term) only.
2.21. Total Persons Engaged: This item includes total persons engaged by the enterprise for accomplishing its activities (excluding agricultural and manufacturing) during the accounting period. It includes persons directly associated with the production of services, supervisory and managerial staff, persons who are employed through contractors and are on payroll of the enterprise and others such as clerk, accountant, peon, receptionist, administrative staffs, etc. Personnel hired though contractor but not on the payroll of the enterprise are not counted here. Similarly, any person working voluntarily for the enterprise are not counted for this item.
2.22. Compensation to employees: This is defined as the wages/salaries paid to all employees plus imputed value of benefits in kind i.e. the net cost to the employers on those goods and services provided to employees free of charge or at markedly reduced cost which are clearly and primarily for the benefit to the employees as consumers. It includes profit sharing, festival and other bonuses and ex-gratia payments paid at less frequent intervals (i.e. other than bonus paid more or less regularly for each period). Benefits in kind include supplies or services rendered such as housing, medical, education and recreation facilities. Personal insurance, house rent allowance, conveyance etc. for payment by the enterprise are also included in the compensation.
2.23. Total Input: This comprises of expenses made for procurement of goods and/or services, value of other expenses such as electricity charges, fuel and lubricant, consumables, charges paid for availing different services, such as, legal, accounting, auditing, advertising, training, etc. delivered by other concern, materials etc. consumed for own account fixed capital construction, cost of materials consumed for minor repair and maintenance of enterprise’s fixed assets and rental paid for hiring of fixed assets during the accounting period. These expenses may be paid or payable.
2.24. Total Output: Total output includes gross receipts from production of services, trade margin, change in stock of semi-finished goods, value of own construction, rental received for produced assets such as building, plant \& machinery, etc., adjusted to taxes less subsidies on product/services pertaining to the accounting period. It excludes different kind of distributive expenses such as commission paid, outward carriage, outward transports cost.
2.25. Gross Value Added (GVA): Gross value added is calculated by deducting the value of total input from total output.
2.26. Net Value Added (NVA): This is obtained by deducting the depreciation from Gross Value Added.
2.27. Net Income: It is obtained by deducting the value of net rent and interest paid from the value of Net Value Added.
Chapter Three
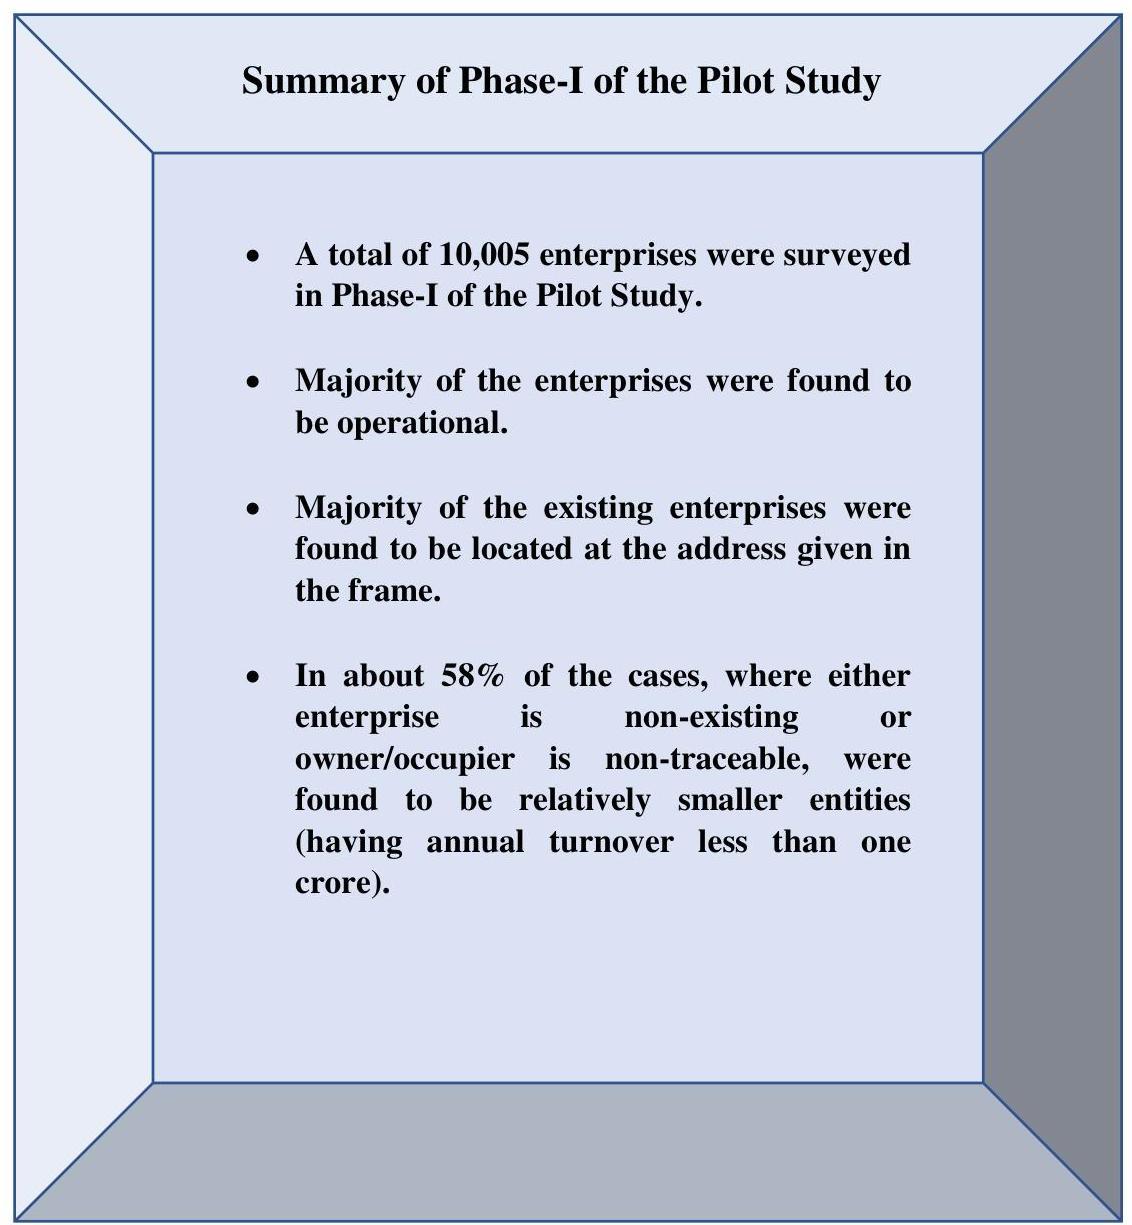
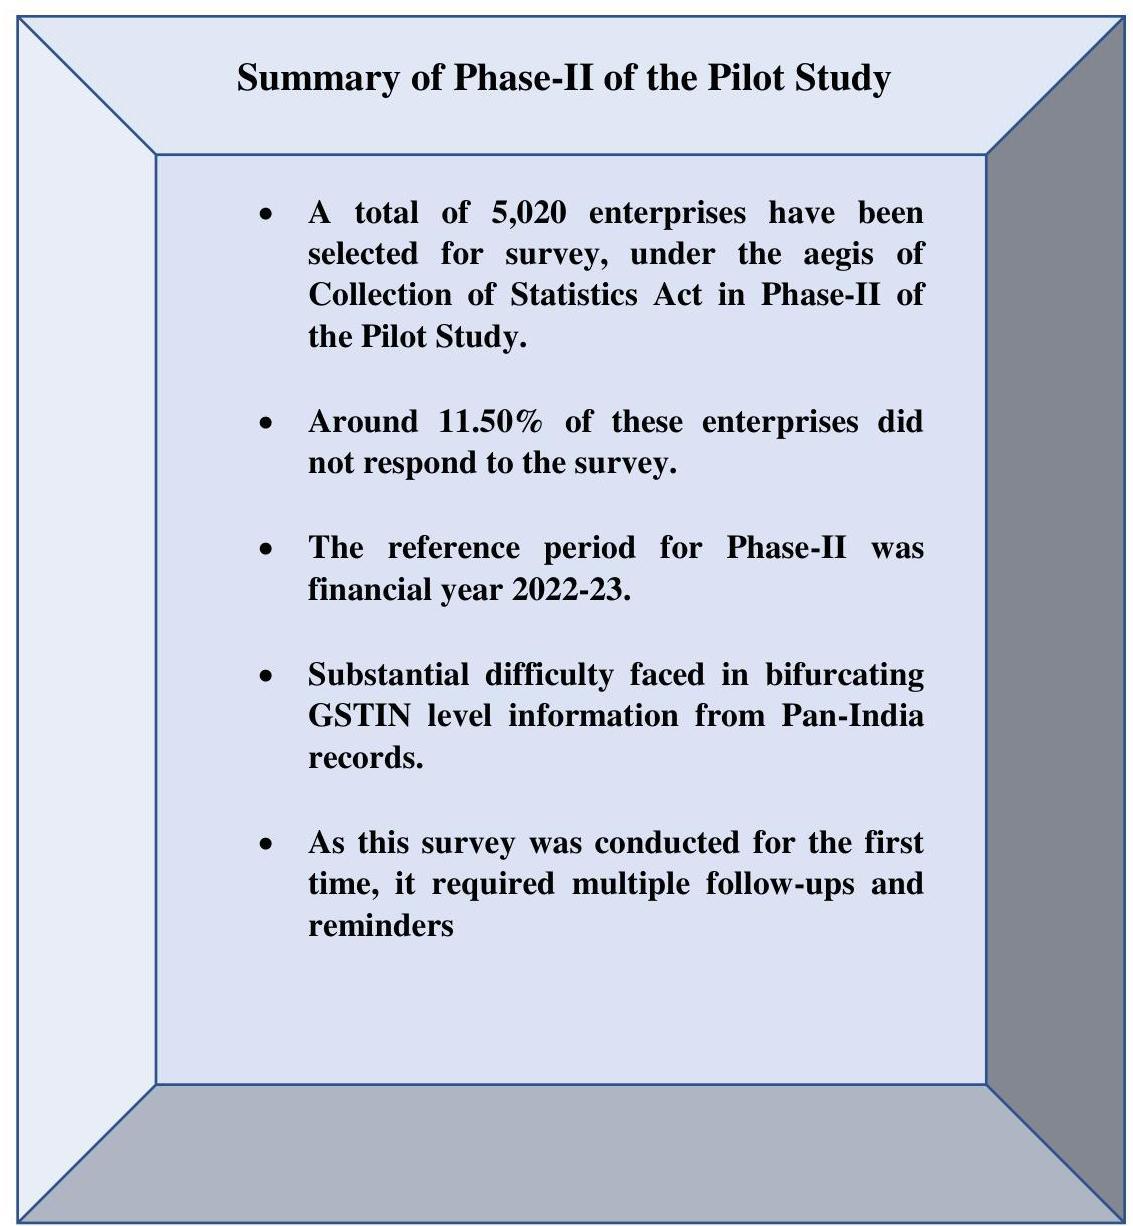
SUMMARY OF THE PILOT STUDY
3.1. Introduction
3.1.1. This chapter summarizes the key findings of the Pilot Study on the Annual Survey of Services Sector Enterprises (ASSSE), highlighting both the insights gained from the experience and the macro-level data findings. As mentioned in Chapter-1, the Pilot Study on ASSSE has been conducted using an ‘enterprise approach’ using the GSTN database which contained about 6.85 lakh corporate enterprises belonging to ‘Construction’, ‘Trade’ and ‘Other Services Sector’ for the Financial Year 2022-2023. The term ‘enterprise’ is referred to as a GSTN unit conducting operations in a particular state. As per GSTN nomenclature, the term enterprise is analogous to ‘principal place of business’ which may have one or more ‘additional place of business’ (commonly understood as establishments) in the state. Combined data of all the additional places of businesses have been collected from the principal place of business. In case of an enterprise having a single balance sheet covering multiple establishments across multiple states, suitable adjustment/apportionment has been done pertaining to the selected GSTIN of the state in consultation with the management of the unit.
3.1.2. All the results shown in the form of tables and statements in this chapter are obtained from sample observations only, without using of any multipliers. No attempt has been made to estimate parameters based on such low sample size of 5,020 units in Phase-II. In this report, the aggregate figures used for deriving the percentage distribution of various indicators are obtained using the total of sample values. Thus, number of enterprises, establishments, workers, etc. for a domain will be same as the sample total of enterprises, establishments, workers for the respective domains. Thus, indicators (say GVA or worker) at Broad Activity Category (BAC) level of Construction, Trade and Other Services have been generated by adding the corresponding parameter values (GVA or worker in this example) of all the surveyed units in that BAC without jacking them up using any weight and hence they are largely influenced by the relatively bigger units in that domain. Hence the domain level indicators should be treated with adequate caution as they may not be indicative of the actual aggregates of the domain.
3.1.3. Results of some of the key indicators of the service sector have been presented at Broad Activity Category (BAC) level of Construction, Trade and Other Services (operational as well as economic characteristics) and also as per different size-classes of output. The NIC2008 divisions covered are attached at Annexure I at the end of this chapter.
3.1.4. In the statements, ‘all’ is used to denote all the enterprises taken together. A “-” has been used in the statements and tables if no enterprise was surveyed in that particular level of disaggregation. On the other hand, the figure ” 0 ” appears in some levels of disaggregation when the figure is very low and has become ” 0 ” due to rounding off.
3.2. Key Observations of Phase-I
3.2.1. The Phase-I of the Pilot Study on ASSSE has been conducted on 10,005 enterprises at all-India level. The primary objective of this phase of the survey was to verify and update (if necessary) the selected frame information such as name of the enterprise, address of the enterprise, activities pursued by the enterprise, number of establishments in the state, status of
the enterprise, etc., so that Phase-II of the survey, which involved checking the feasibility of collection of detailed information using books of accounts, can be carried out under the aegis of the Collection of Statistics (CoS) Act.
3.2.2. In order to evaluate the prevailing status of the enterprise, a set of distinct status codes has been used to capture relevant data. The structure of the codes is as follows:
| Codes | Description |
|---|---|
| 1 | Open and Producing services |
| 2 | Existing with fixed assets and maintaining staff but not producing any services |
| 3 | Existing with fixed assets but neither maintaining staff nor producing any services |
| 4 | Enterprise is non-existing |
| 5 | Owner/occupier of the enterprise is not traceable |
| 6 | Out of coverage |
| 7 | Non-response due to production of services not yet started |
| 8 | Non-response due to other reasons |
3.2.3. Statement 1 gives the State/UT-wise number of enterprises surveyed in Phase-I and Phase-II of the Pilot Study on ASSSE.
Statement 1: State/UT-wise number of enterprises surveyed in the Pilot Study on ASSSE
| State/UT | Phase- I | Phase- II |
|---|---|---|
| No. of enterprises surveyed | No. of enterprises surveyed | |
| Andhra Pradesh | 204 | 123 |
| Arunachal Pradesh | 31 | 10 |
| Assam | 109 | 58 |
| Bihar | 206 | 103 |
| Chhattisgarh | 114 | 69 |
| Delhi | 978 | 405 |
| Goa | 88 | 45 |
| Gujarat | 622 | 306 |
| Haryana | 566 | 297 |
| Himachal Pradesh | 84 | 49 |
| Jharkhand | 143 | 68 |
| Karnataka | 840 | 446 |
| Kerala | 304 | 168 |
| Madhya Pradesh | 225 | 102 |
| Maharashtra | 1616 | 801 |
| Manipur | 37 | 17 |
| Meghalaya | 35 | 17 |
| Mizoram | 22 | 10 |
| Nagaland | 26 | 7 |
| Odisha | 176 | 80 |
| Punjab | 180 | 100 |
| Rajasthan | 324 | 184 |
| Sikkim | 32 | 15 |
| Tamil Nadu | 692 | 359 |
| Telangana | 555 | 291 |
| Tripura | 44 | 12 |
| Uttar Pradesh | 735 | 342 |
| State/UT | Phase- I | Phase- II |
|---|---|---|
| No. of enterprises surveyed | No. of enterprises surveyed | |
| Uttarakhand | 121 | 40 |
| West Bengal | 588 | 317 |
| A \& N Islands | 30 | 17 |
| Chandigarh | 87 | 53 |
| D \& N Haveli and Daman \& Diu | 40 | 20 |
| Jammu And Kashmir | 79 | 56 |
| Ladakh | 11 | 5 |
| Lakshadweep | 4 | 1 |
| Puducherry | 53 | 24 |
| All India* | $\mathbf{1 0 0 0 5}$ | $\mathbf{5 0 2 0}$ |
*Includes enterprises surveyed in ‘other territories’, i.e. they belong to Union of India but not to any particular State/UT
3.2.4. Majority of the enterprises in this phase were found to be operational, either open and producing services, or not producing service but existing with fixed assets and maintaining/not maintaining staff. However, some enterprises were also found to be either non-existing in the given address or the owner not traceable or out of coverage of ASSSE. The primary reason for out of coverage cases was the engagement in activities excluded from the coverage of ASSSE. Additionally, there were some cases involving change in State, change of GSTIN, or coverage under Annual Survey of Industries (ASI). Also, there were enterprises that did not respond to the survey during this phase.
3.2.5. Statement 2 provides a snapshot of enterprises that are either non-existing or the owner/occupier of the unit has not been found during the conduct of Phase-I of the survey. From GSTN, various turnover slabs of the enterprises were obtained (as mentioned in the statement below) and the distribution of such enterprises among these slabs have been tabulated. In about $58 \%$ of the cases, where either enterprise is non-existing or owner/occupier is non-traceable, were found to be relatively smaller entities (having annual turnover less than one crore). Lowest incidence of such cases was observed in the highest turnover slab of 500 crores and above.
Statement 2: Distribution of sample enterprises which were either non-existing or owner/occupier non-traceable over various GSTN turnover slabs (from Phase-I)
| Annual Turnover Slab | Percentage of enterprises |
|---|---|
| Below 20Lakh | 31.07 |
| 20 Lakh to 50 Lakh | 15.97 |
| 50 Lakh to 1 Crores | 10.60 |
| 1 Crore to 5 Crores | 20.97 |
| 5 Crores to 10 Crores | 6.86 |
| 10 Crores to 25 Crores | 5.95 |
| 25 Crores to 50 Crores | 2.74 |
| 50 Crores to 100 Crores | 1.94 |
| 100 Crores to 500 Crores | 3.20 |
| Above 500 Crores | 0.69 |
| Total | $\mathbf{1 0 0 . 0 0}$ |
3.2.6. Out of the enterprises that were found to be existing, the addresses of majority of them were found to be situated at the location given in the frame. It may be noted that during
Phase-I of the Pilot Study on ASSSE, the statutory provisions of Collection of Statistics (CoS) Act were not imposed.
3.3. Field Experiences during Phase-I
3.3.1. During Phase-I of the Pilot Study, conducted over a three-month period, the Field Operations Division (FOD) provided valuable feedbacks based on the experiences gathered throughout the data collection process. The insights from FOD will play a crucial role in refining the questionnaire and methodology for the full-fledged ASSSE. Some major feedbacks provided are outlined below:
i. On many occasions, the addresses for correspondence available in the GSTN database could not be located.
ii. Given addresses, in some of the cases, were the home addresses of the owner, relatives, or friends, accounts personnel, etc. making it difficult to locate the concerned units or owners.
iii. Some enterprises were reluctant to provide information or participate in the study. In many cases, the management was unwilling to provide gross sale value and employee details.
iv. Significant efforts were required in collecting data from enterprises having headquarters in other states.
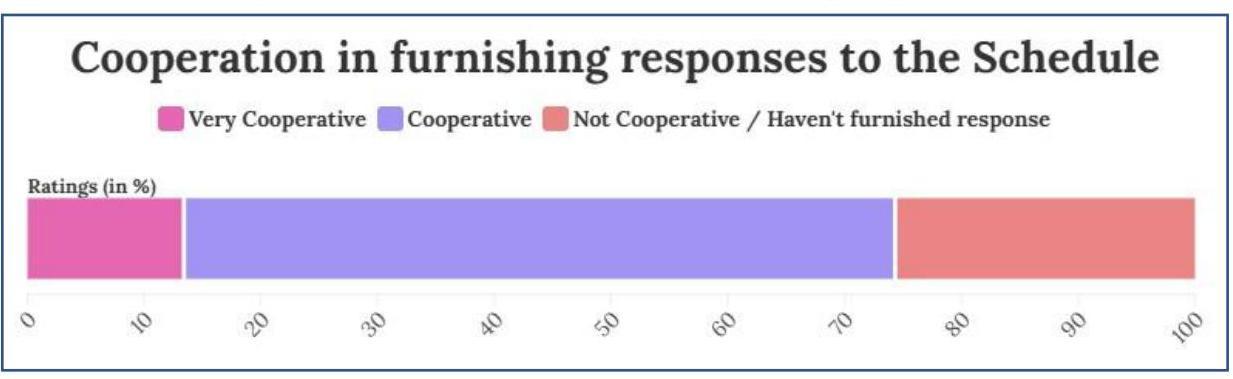
3.3.2. Figure 1 below provides an overview of the field responses (in percentages) regarding the cooperation of enterprises in providing responses to the Phase-I schedule. Approximately $74 \%$ of the enterprises demonstrated varying levels of cooperation and provided the required responses.
Fig. 1: Level of cooperation of the Enterprises in furnishing responses to the Schedule
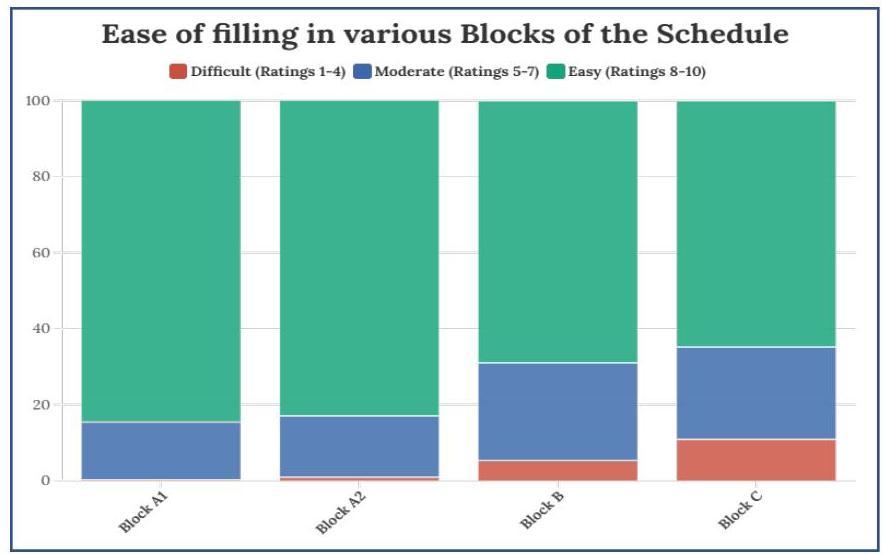
3.3.3. The Phase-I schedule of the Pilot Study was structured into five blocks. Blocks A1 and A2 were designed for verifying the identification details of the frame and collecting additional information about the enterprise, such as its current status, name, and contact details, respectively. Block B focused on verifying the enterprise’s activity details, while Block C gathered quantitative data about the enterprise. Block D was intended for recording any additional remarks or special comments of the enumerator.
3.3.4. Figure 2 illustrates the ease of filling in various blocks (A1, A2, B and C) of the schedule, rated on a scale of 1 to 10 , where 1 represents the most difficult and 10 the simplest. Figure 3, on the other hand, reflects the ease of understanding the Instruction Manual (Volume-I) of Phase-I of the study, as provided by EnSD, on the same scale. It is evident that Block A1 was the easiest to fill, with majority of enumerators rating it 8 or above
on a scale of 10 . This was followed by Blocks $\mathrm{A} 2, \mathrm{~B}$, and C respectively in that order. Block C, however, was the most challenging, indicating greater difficulty in gathering the required information such as total gross sale value at state/UT level, total persons engaged at state/UT level, etc.
Fig. 2: Simplicity in filling in various blocks of the schedule
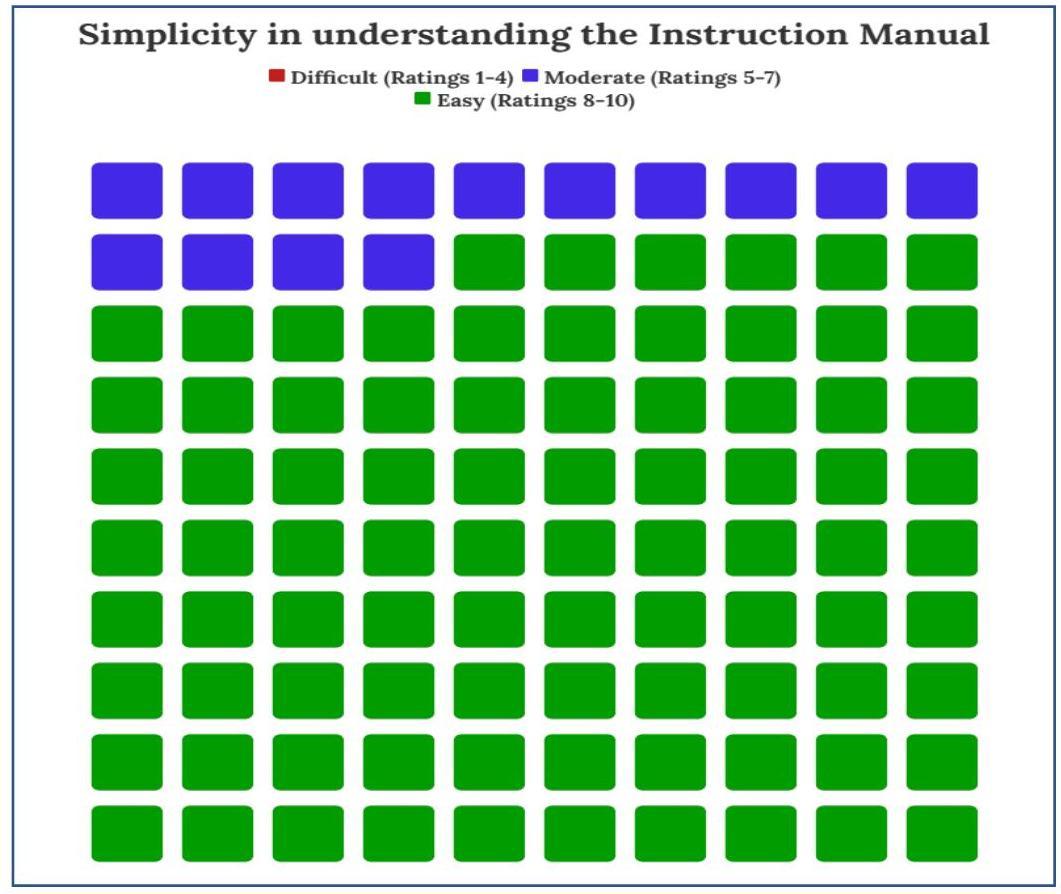
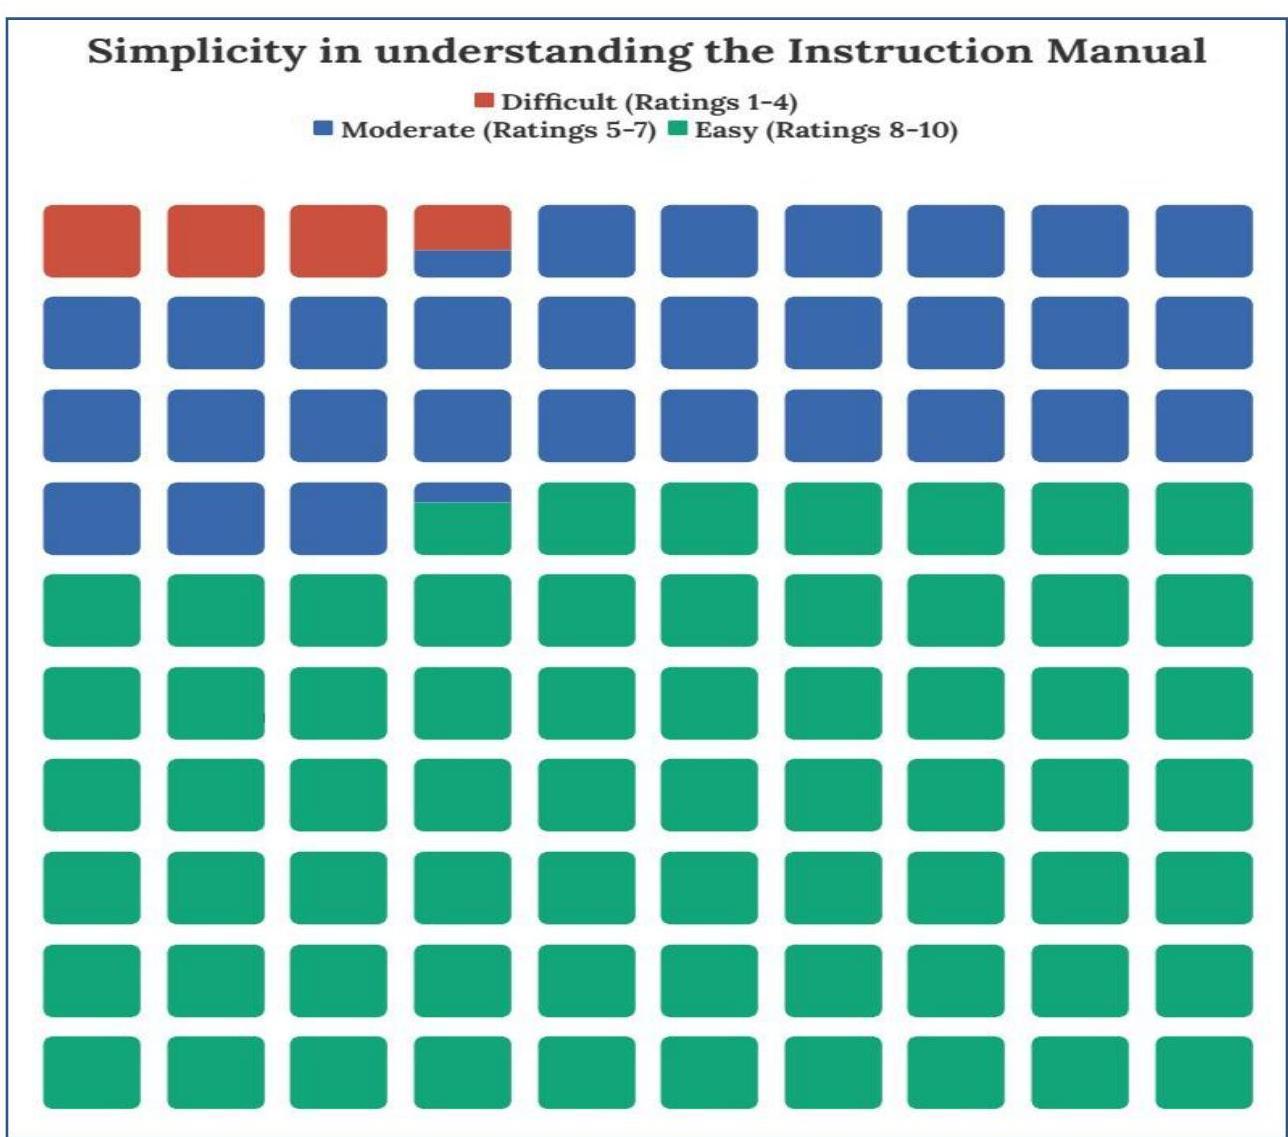
3.3.5. Figure 3 indicates that the majority of enumerators found instruction of the Phase-I Pilot Study easy to understand, with around $86 \%$ enumerators rating it between 8 and 10 on the simplicity scale. This suggests that the instruction manual for Phase-I of the study was generally clear for most users.
Fig. 3: Simplicity in understanding the Instruction Manual
3.4. Key Observations of Phase-II
3.4.1. Following the completion of Phase-I, the Phase-II of the Pilot Study has been conducted with 5,020 enterprises (selected from the 10,005 enterprises surveyed in Phase-I) where the detailed schedule has been canvassed under the Collection of Statistics Act and data have been collected from Books of Accounts, Profit and Loss Accounts and other records maintained by the enterprises for the reference period FY 2022-2023. The Phase-II has been designed to capture the key characteristics such as gross value added (GVA), fixed capital, capital formation, number of persons employed, emoluments paid and other important features pertaining to the units belonging to service sector.
3.4.2. Data were collected in CAPI using tablet from the selected enterprises. A notice was first sent to all selected enterprises under the Collection of Statistics Act for this purpose. A schedule devised specifically to collect information in this phase contained blocks to capture data on identification particulars, operational particulars, land and fixed assets, working capital and loan, employment and labour cost, expenses, receipts taxes, subsidies and distributive expenses, use of Information and Communication Technology, etc. of the enterprise apart from particular of field operations and remarks by field personnel.
3.4.3. To assess the status of the enterprise during the reference period (FY 2022-2023), the structure of the codes has been kept by and large similar to Phase-I with one minor modification. Status Codes 7 (non-response due to production of services not yet started) and 8 (non-response due to other reasons) of Phase-I have been merged into a single code 7 (nonresponse due to production of services not yet started or accounting year not closed during the accounting period or any other reasons) in Phase-II.
3.4.4. Statement 3 offers an overview of the distribution of enterprises surveyed during Phase-II based on their operational status during the reference period of FY 2022-2023.
Statement 3: Distribution of enterprises as per status of operation in Phase-II (FY 202223)
| Status | No. of enterprises | Percentage of enterprises |
|---|---|---|
| Open and producing services | 3979 | 79.26 |
| Existing with fixed assets and maintaining staff but not producing any services |
28 | 0.56 |
| Existing with fixed assets but neither maintaining staff nor producing any services |
79 | 1.57 |
| Enterprise is non-existing | 89 | 1.77 |
| Owner/occupier of the enterprise is not traceable |
91 | 1.81 |
| Out of coverage | 175 | 3.49 |
| Non-response | 579 | 11.53 |
| Total | $\mathbf{5 0 2 0}$ | $\mathbf{1 0 0}$ |
Generated based on sample observations
Ref: Table 1 of Appendix A
3.4.5. Out of the total 5,020 enterprises selected for Phase-II of the Pilot Study, approximately $3.6 \%$ of these enterprises were found to be either non-existing or owners/occupiers not traceable. Additionally, about $3.5 \%$ of the enterprises were deemed out of coverage. Another $11.5 \%$ of the enterprises were found to be non-responding despite the
fact that data in Phase-II was collected under the statutory provisions of Collection of Statistics Act.
3.5. Field Experiences during Phase-II
3.5.1. During Phase-II of the Pilot Study, field work which spanned over three months (November, 2024 – January, 2025) the Field Operations Division (FOD) was actively engaged in the data collection process, encountering various challenges and learning opportunities that provided meaningful insights into the operational aspects of the pilot study. Based on their first-hand experiences, FOD offered valuable feedback of the study. This feedback will serve as a foundation for firming up the questionnaire, instruction manual and also data collection strategies and addressing operational challenges during a full-fledged survey in future.
3.5.2. Some major feedbacks provided are outlined below:
- A number of cases have been observed where the enterprise operates at pan India level and accounts are maintained in a centralised manner. Some units were having their headquarters/accounts department in other cities. Therefore, it was often challenging to communicate and get data in such cases. Further, bifurcation of the records to fill schedule for the selected enterprise against GSTIN no. was also challenging. For units having branches pan India, it was not possible to get regionspecific data for many items. Data provided by such units even after multiple visits were insufficient to fill the schedule in some cases.
- In many units, GST \& other tax data in respect of various input and output items were not readily available in the official records i.e. balance sheet and PL accounts. Units took much time in producing relevant documents.
- With regard to Block 5 (employment details), data were not readily available in the required format (gender wise and level-wise) with the units in some cases.
- Cases have been encountered where there were multiple units running on the same address. The unit which was selected is either sister concern or minor unit and the information like, expenses were prepared under main unit’s books of accounts. So, books of accounts of the sister unit often did not readily have essential break-up of information required in the survey schedule.
- As this survey was conducted for the first time, it required multiple follow-ups and reminders to obtain data as enterprises were reluctant to provide financial statements, balance sheets, and GST-related data.
- In case of enterprises pursuing mixed activities (consisting of both manufacturing and service activities), difficulties were faced in bifurcation of specific activities pertaining to the survey with respect to fixed assets, expenses, receipts etc.
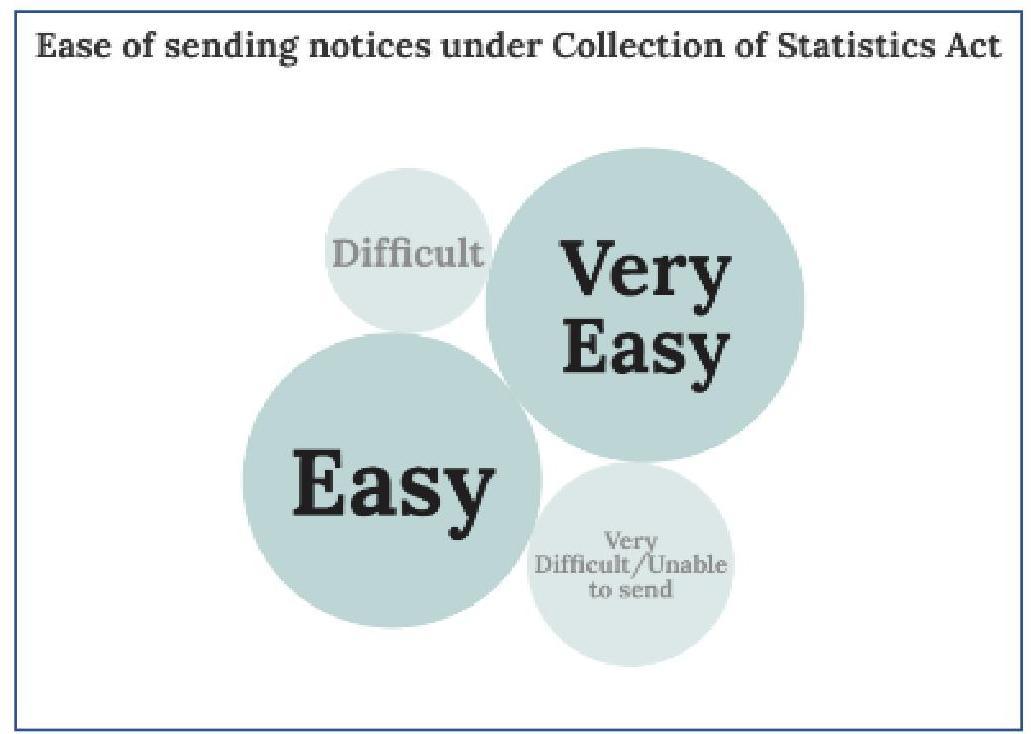
3.5.3. Figure 4 demonstrates the responses given by FOD (in percentages) on the ease of sending notices under Collection of Statistics (CoS) Act during Phase-II of the Pilot Study to the addresses recorded during Phase-I. In majority of the cases, notices could be sent without any difficulty.
Fig. 4: Ease of sending notices to the Enterprises under Collection of Statistics Act
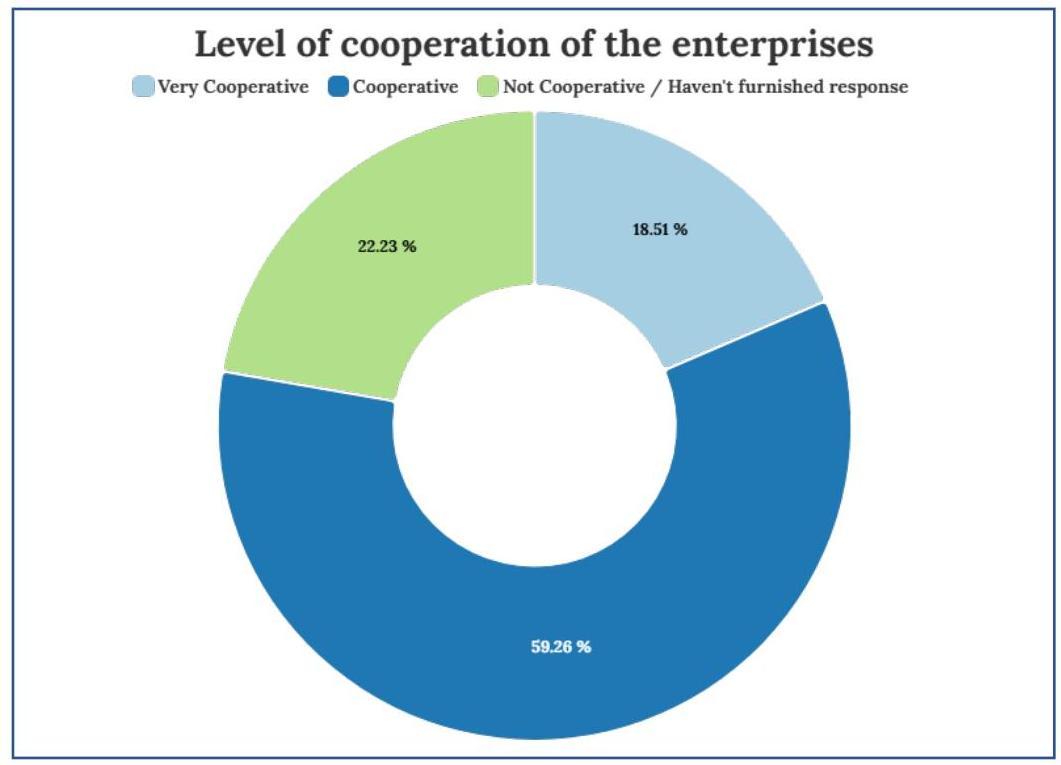
3.5.4. Figure 5 shows the responses received from field personnel (in percentages) on the level of cooperation demonstrated by the enterprises in furnishing responses to the Phase-II schedule of the Pilot Study under the Collection of Statistics Act. Majority of the enterprises (around 78\%) were found to be cooperative in providing data.
Fig. 5: Level of cooperation of the Enterprises in furnishing data
3.5.5. The schedule of Phase-II of the Pilot Study on ASSSE has been designed in the form of various Blocks that aimed to collect the required data. The details of the blocks are given at Annexure II.
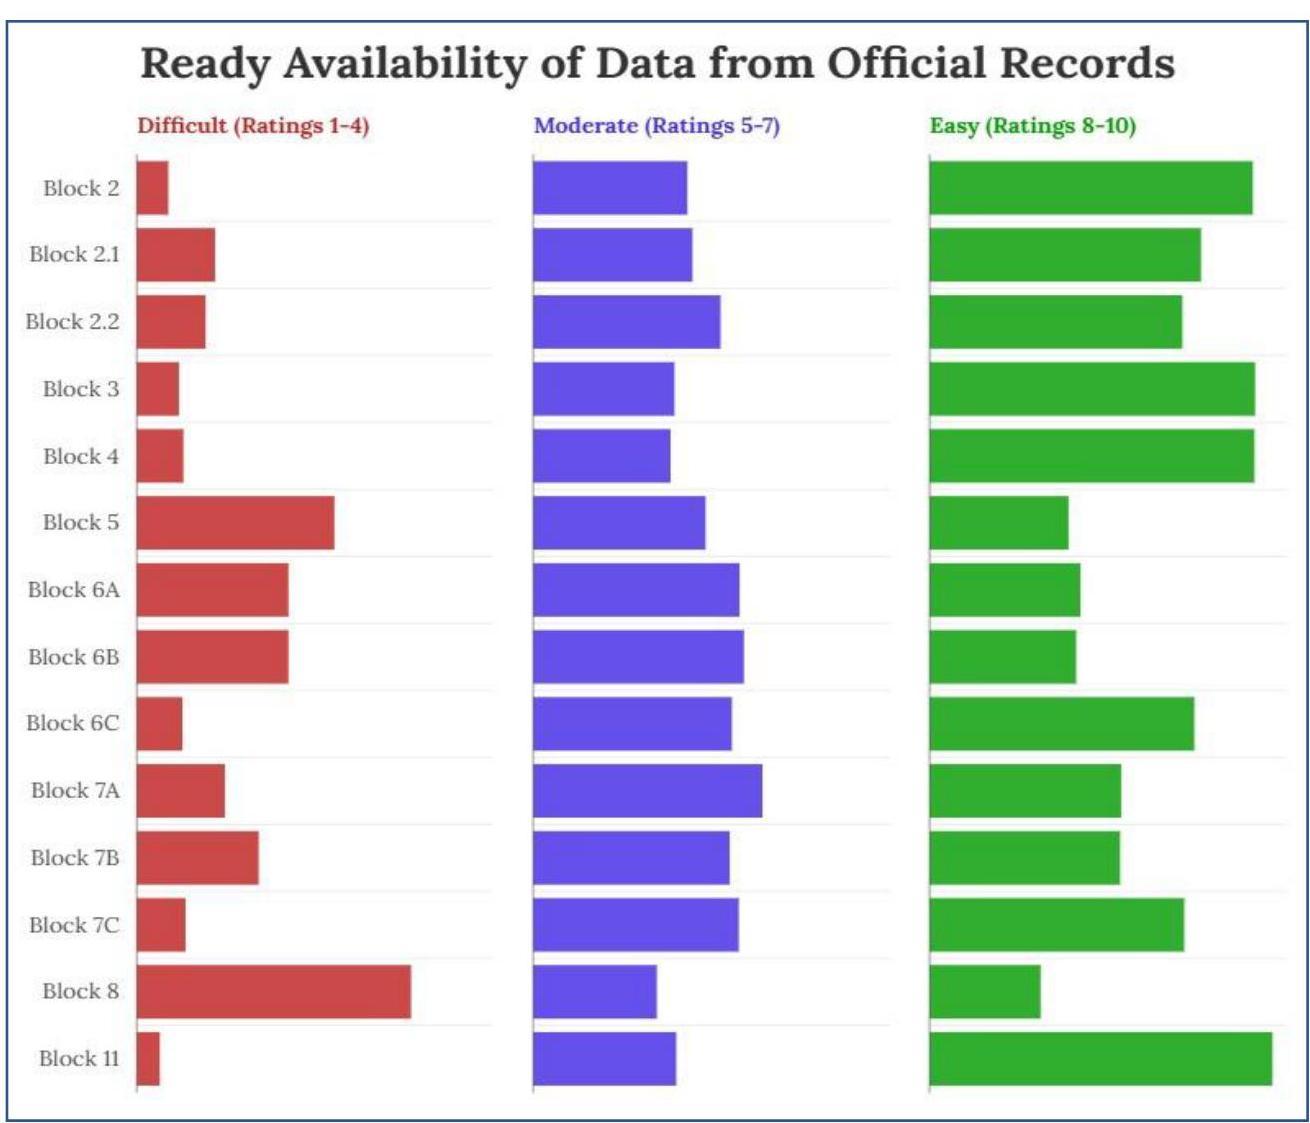
3.5.6. On the evaluation scale (ranging from $1-10,1$ being the most difficult and 10 being the simplest) on the ready availability of data from official records of the enterprises (books of accounts, balance sheets etc.) in filling out various blocks ${ }^{1}$ of the Phase-II schedule, the scoring pattern (in percentage) of the field enumerators have been diagrammatically represented in Figure 6. It is noteworthy that the Block 8 (Taxes, Subsidies and Distributive Expenses during the Accounting Period) was the most challenging.
Fig. 6: Ready availability of data from Official Records maintained by the Enterprises
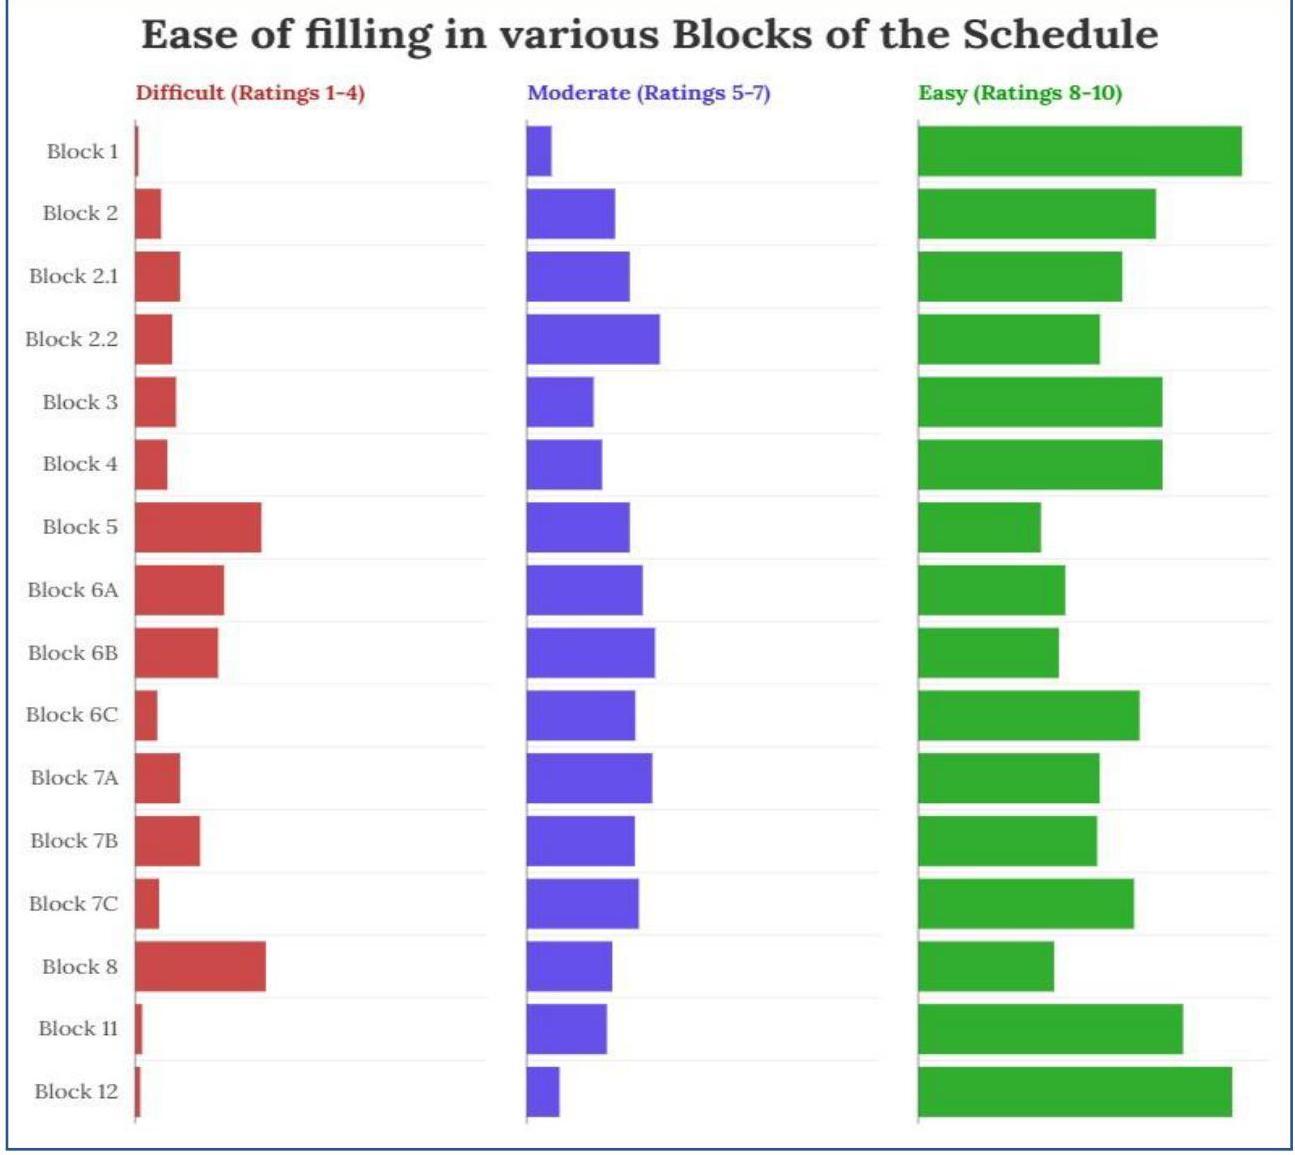
3.5.7. The ratings (in percentages) on the level of ease of filling in various blocks ${ }^{2}$ of the schedule from the available records, rated on a scale from 1 to 10 (with 1 being the most challenging and 10 the easiest), as reported by the field enumerators, has been demonstrated below in Figure 7. Block 8 (Taxes, Subsidies and Distributive Expenses during the Accounting Period) was found to be the most challenging block with the highest number of ‘Difficult” ratings, followed by Block 5 (Employment and Labour Cost during the Accounting Period).
Fig. 7: Ease of filling in various Blocks of the Schedule
3.5.8. Figure 8 outlines the level of simplicity of the field enumerators in understanding the Instruction Manual (Volume-I) of Phase-II of the Pilot Study on ASSSE, rated on a scale of $1-10,1$ being the most difficult and 10 being the simplest. Around two-third of the field enumerators have found the instruction manual for Phase-II as easy with ratings from 8 to 10.
Fig. 8: Simplicity in understanding the Instruction Manual
3.6. Data Findings of the Pilot Study
3.6.1. Operational Characteristics
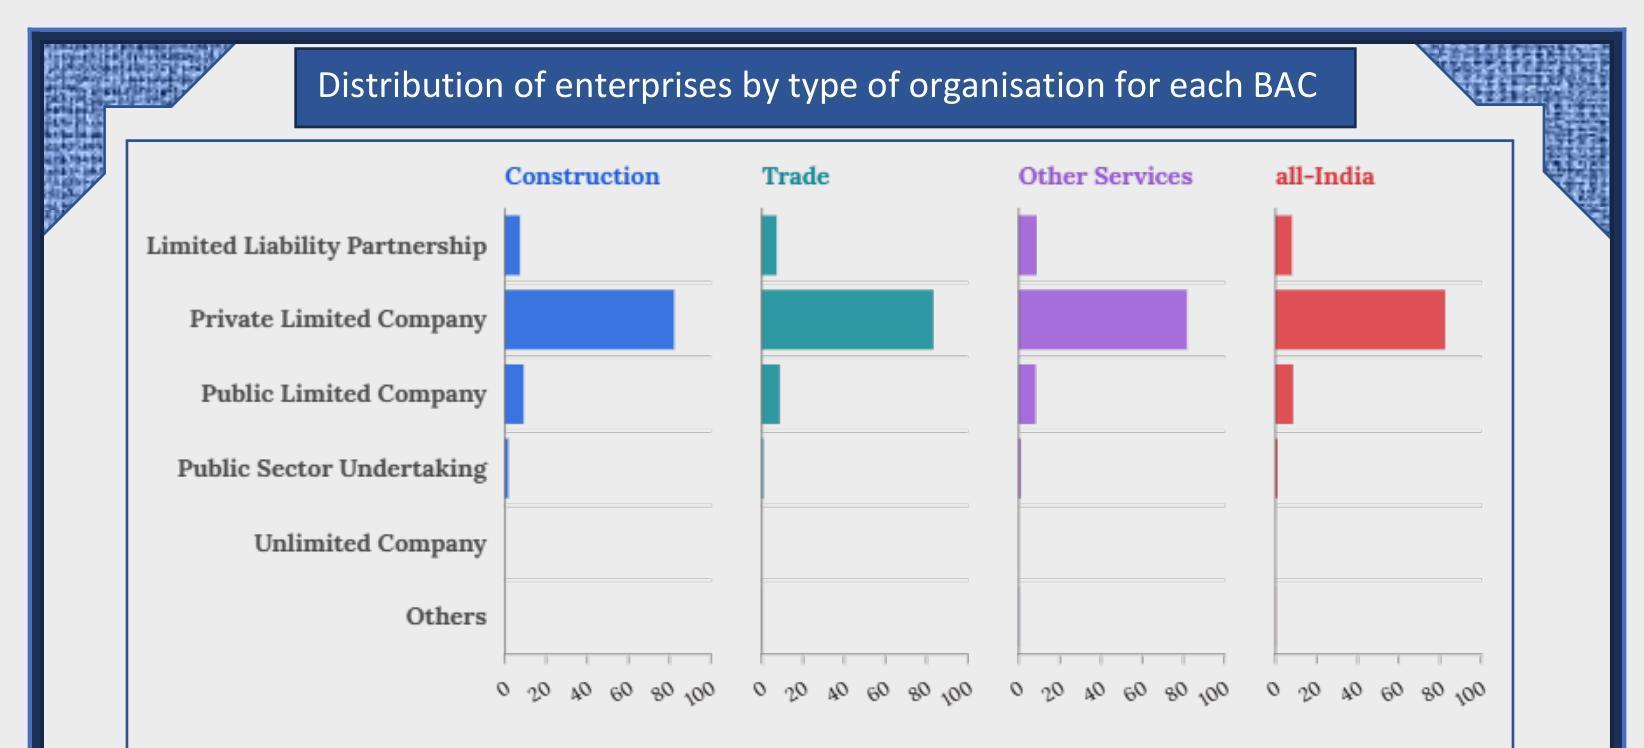
3.6.1.1. As already indicated earlier, ASSSE essentially captures the corporate service entities. Statement 4 gives the percentage distribution of the enterprises by different types of organization. It can be seen that majority of the corporate entities in the pilot study on ASSSE are private limited companies ( $82.40 \%$ at all-India level) during FY 2022-23. The same trend is noticeable for all the broad activity categories i.e., construction, trade and other services.
Statement 4: Percentage Distribution of Enterprises by types of organization (FY 202223)
| BAC | Limited Liability Partnership |
Private Limited Company |
Public Limited Company |
Public Sector Undertaking |
Unlimited Company |
Others |
|---|---|---|---|---|---|---|
| (1) | (2) | (3) | (4) | (5) | (6) | (7) |
| Construction | 7.25 | 82.16 | 9.02 | 1.57 | 0.00 | 0.00 |
| Trade | 7.17 | 83.38 | 8.66 | 0.71 | 0.00 | 0.07 |
| Other Services | 8.63 | 81.83 | 8.26 | 0.97 | 0.05 | 0.28 |
| all-India | $\mathbf{7 . 9 5}$ | $\mathbf{8 2 . 4 0}$ | $\mathbf{8 . 4 9}$ | $\mathbf{0 . 9 5}$ | $\mathbf{0 . 0 2}$ | $\mathbf{0 . 1 7}$ |
generated based on sample observations
Ref: Table 4 of Appendix A
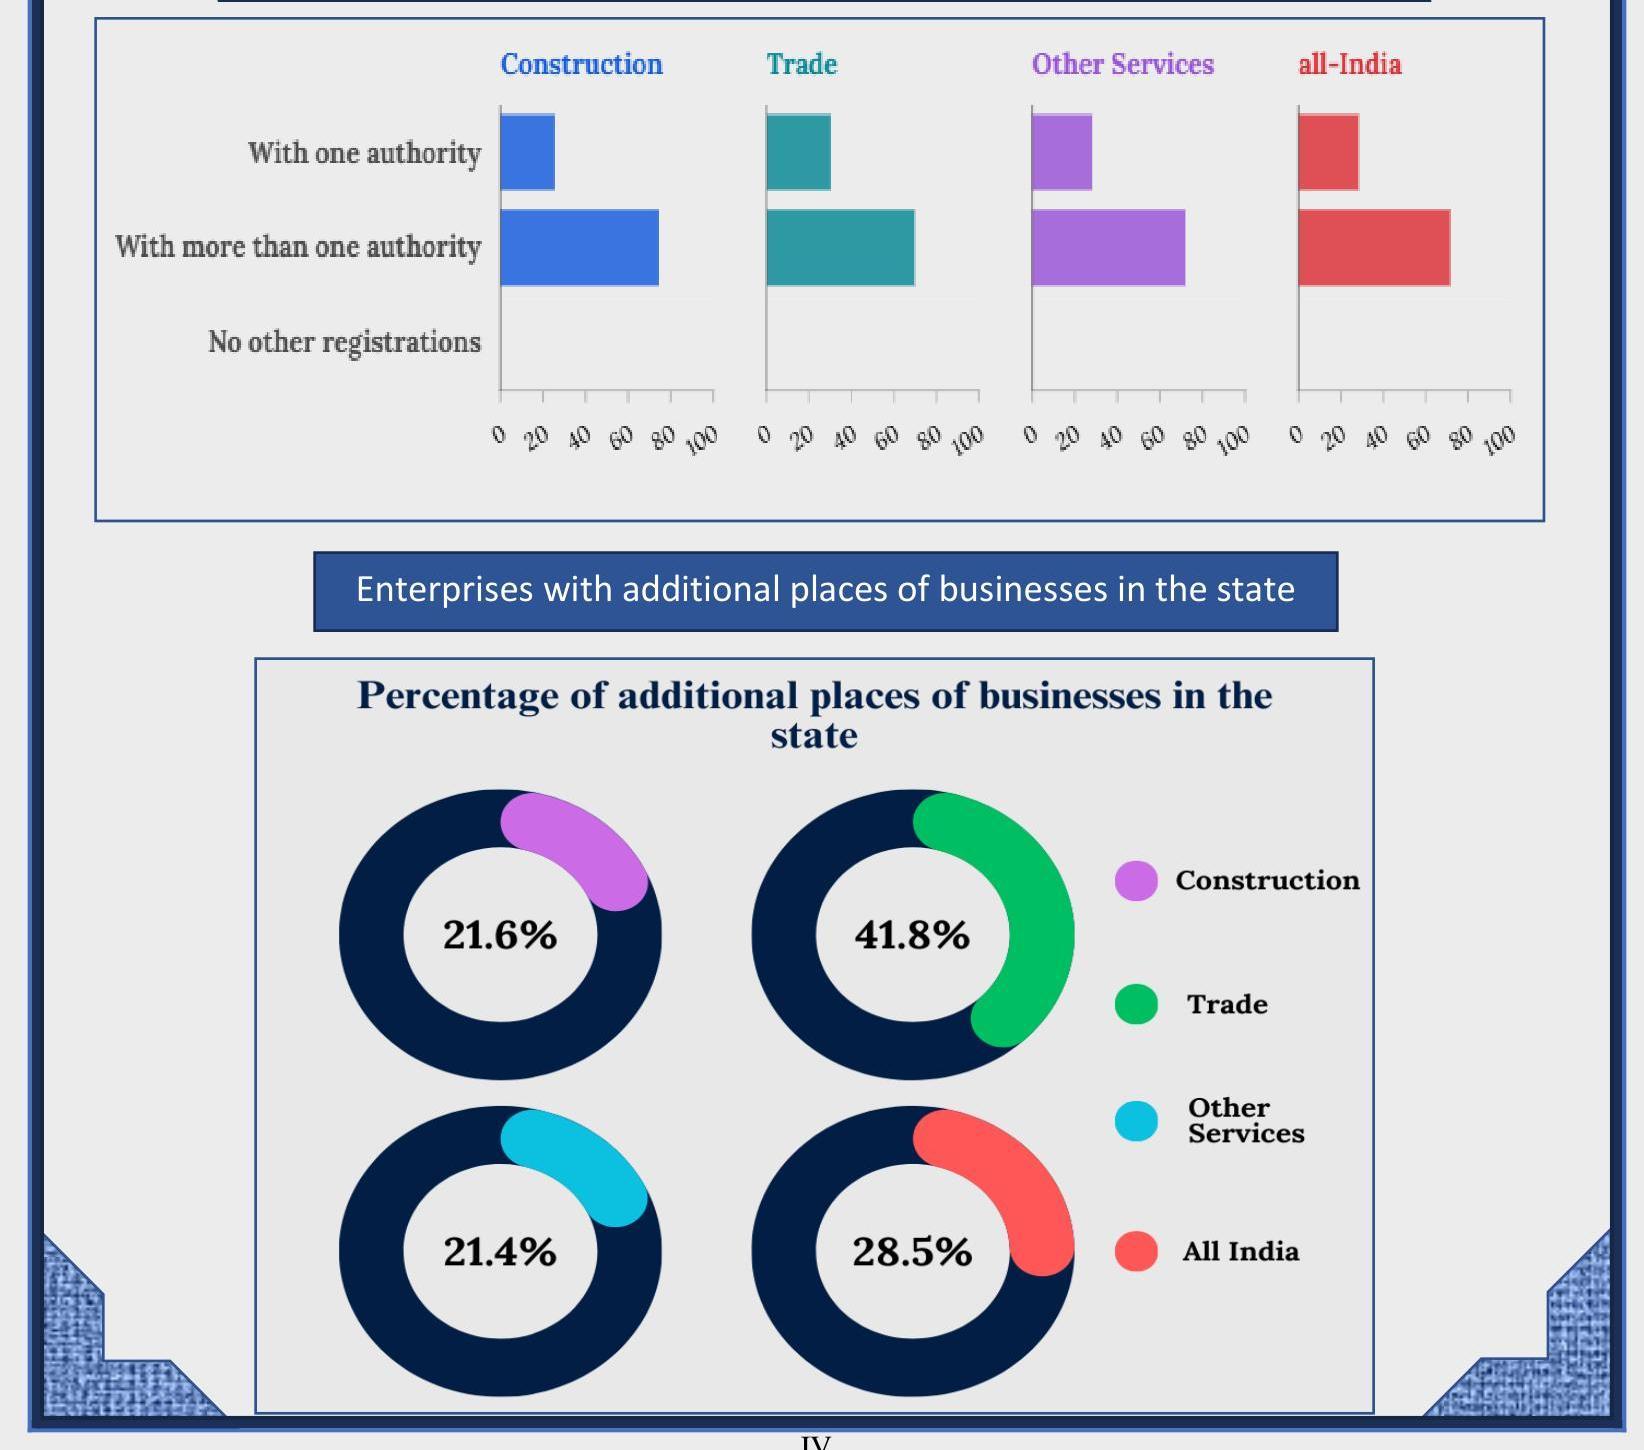
3.6.1.2. Since, ASSSE is conducted following enterprise approach using GSTN frame with one GSTIN representing one enterprise, it is quite possible that these entities have establishments within the State/UT. In the parlance of GSTN, these establishments are called ‘additional places of business’. Statement 5 gives an idea of State/UT-wise scenario of enterprises having additional places of business. It can be seen that at all India level, 28.46\% of the existing enterprises have at least one additional place of business in the State/UT.
Statement 5: Percentage of Enterprises having Additional Places of Business in the State
| State/UT | Percentage of enterprises having additional places of business in the state |
|---|---|
| Andhra Pradesh | 45.28 |
| Arunachal Pradesh | 25.00 |
| Assam | 35.42 |
| Bihar | 22.22 |
| Chhattisgarh | 24.53 |
| Delhi | 23.67 |
| Goa | 35.71 |
| Gujarat | 29.28 |
| Haryana | 24.02 |
| Himachal Pradesh | 16.28 |
| Jharkhand | 35.29 |
| Karnataka | 24.59 |
| Kerala | 23.68 |
| Madhya Pradesh | 24.05 |
| Maharashtra | 28.73 |
| Manipur | 58.33 |
| Meghalaya | 45.45 |
| Mizoram | 25.00 |
| State/UT | Percentage of enterprises having additional places of business in the state |
|---|---|
| Nagaland | 25.00 |
| Odisha | 33.33 |
| Punjab | 26.25 |
| Rajasthan | 36.62 |
| Sikkim | 16.67 |
| Tamil Nadu | 34.49 |
| Telangana | 25.91 |
| Tripura | 41.67 |
| Uttar Pradesh | 29.93 |
| Uttarakhand | 33.33 |
| West Bengal | 30.36 |
| A \& N Islands | 13.33 |
| Chandigarh | 19.57 |
| D \& N Haveli and Daman \& Diu | 13.33 |
| Jammu And Kashmir | 25.49 |
| Ladakh# | 0.00 |
| Lakshadweep# | 0.00 |
| Puducherry | 38.10 |
| All India | $\mathbf{2 8 . 4 6}$ |
| generated based on sample observations | Ref: Table 2 of Appendix |
# Ladakh had only five and Lakshadweep had only one surveyed enterprise in Phase-II
3.6.2. Economic Characteristics
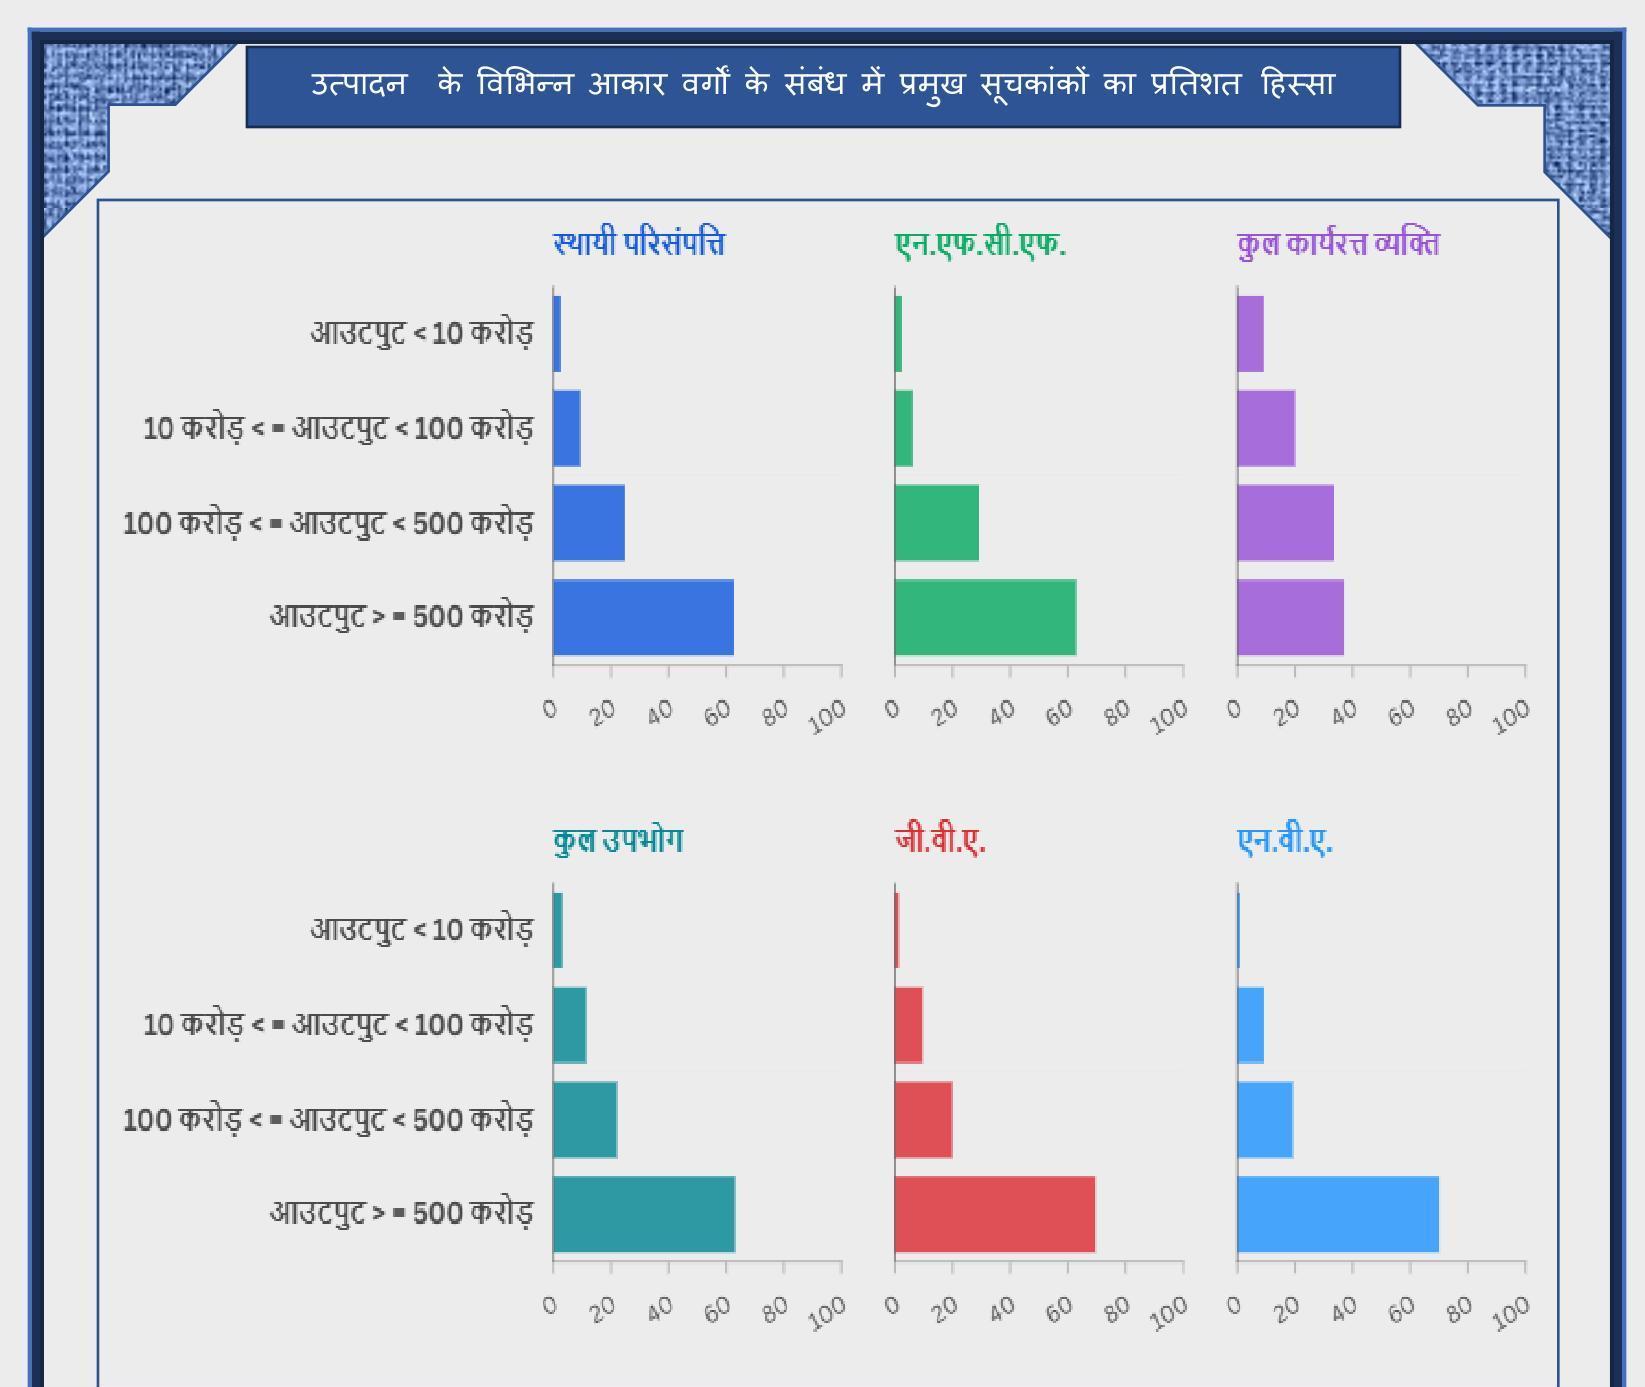
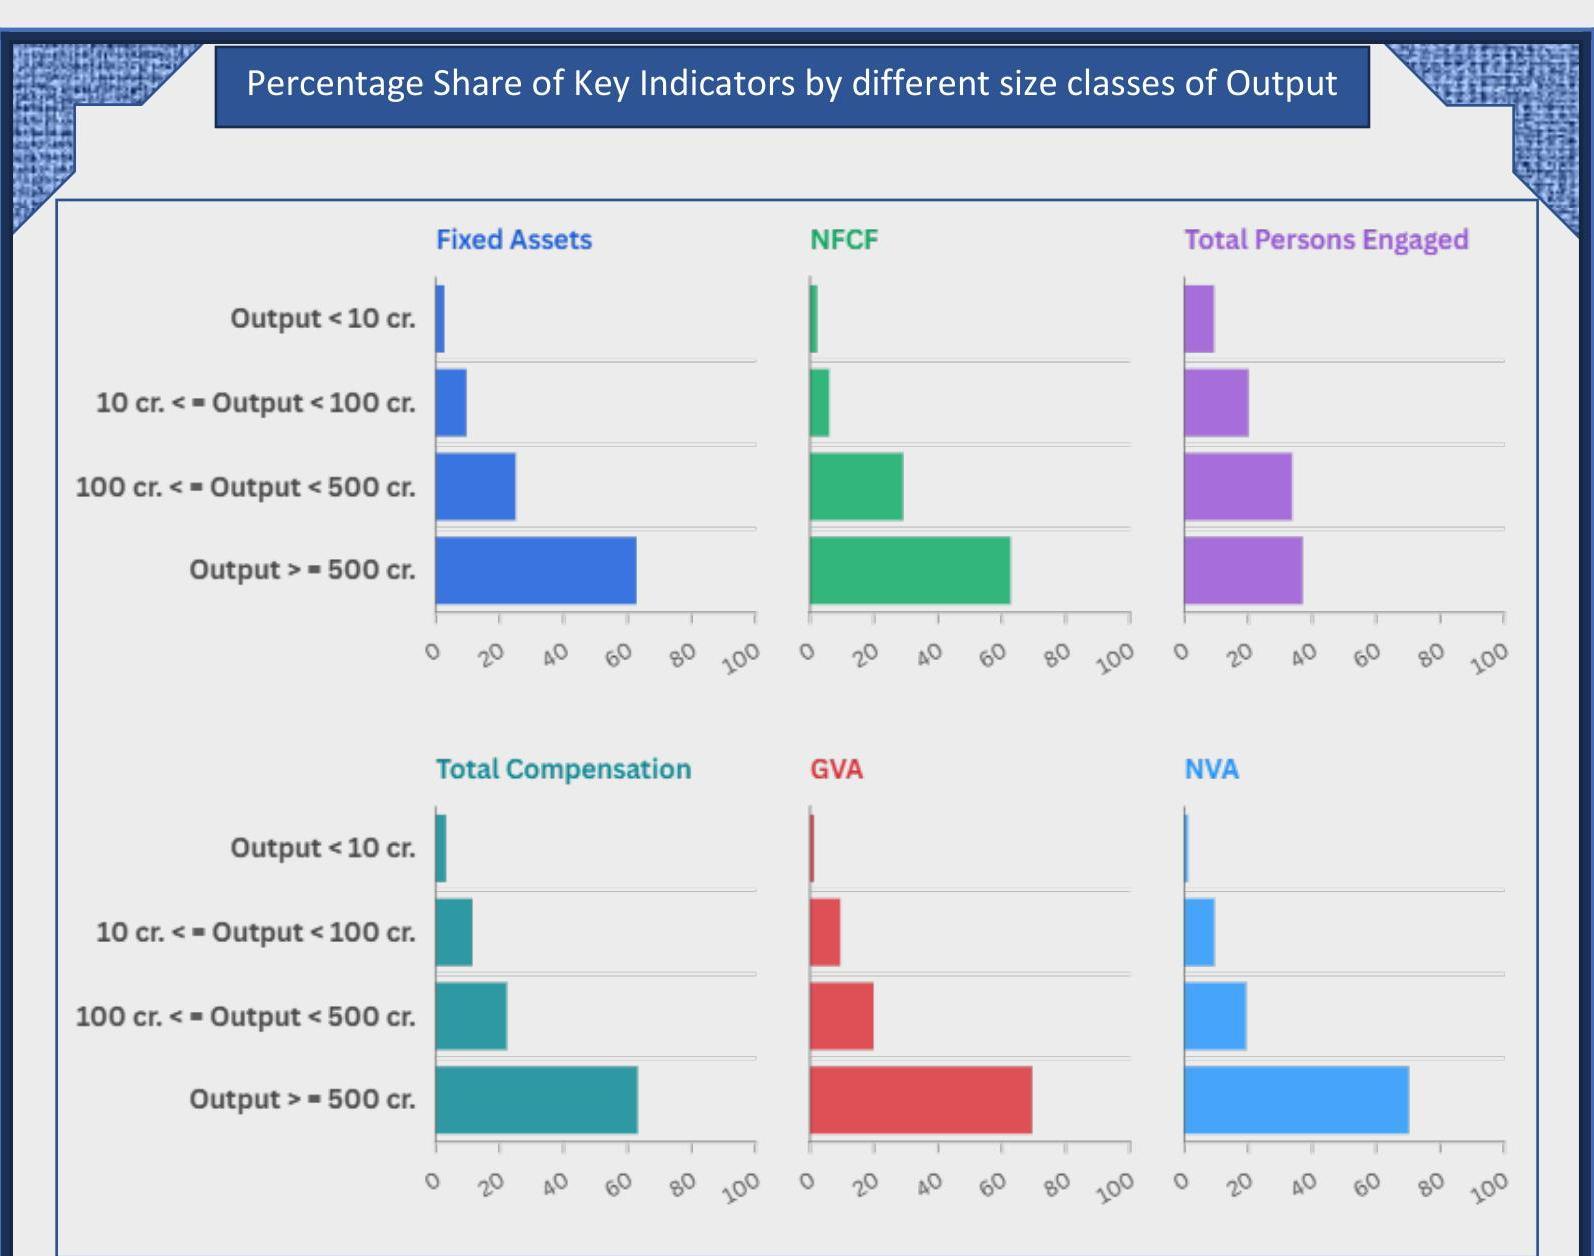
3.6.2.1. To understand the structure of corporate service sector enterprises, the percentage share across various size classes of output with respect to key economic indicators have been analysed. These indicators include fixed assets, capital formation measures (net, gross, and overall), outstanding loans, gross value added (GVA), and net value added (NVA). To facilitate this analysis, the following statements have been generated excluding the enterprises found non-existing, out of coverage and also, non-responding units.
Statement 6: Percentage share of economic indicators by different size classes of output (FY 2022-23)
| Size Class of Output (X) |
No. of enterprises surveyed |
Indicator (in percentages)* | ||||||
|---|---|---|---|---|---|---|---|---|
| Fixed Assets |
Net Fixed Capital Formation |
Gross Fixed Capital Formation |
Gross Capital Formation |
Outstanding Loan |
GVA | NVA | ||
| all-India | ||||||||
| X < 10 cr. | 2720 | 2.64 | 2.19 | 2.44 | 2.78 | 5.91 | 1.19 | 1.07 |
| $10 \mathrm{cr} . \leq \mathrm{X}$ $\leq 100 \mathrm{cr}$. |
927 | 9.58 | 6.00 | 8.32 | 12.67 | 15.83 | 9.45 | 9.38 |
| $100 \mathrm{cr} . \leq \mathrm{X}$ $\leq 500 \mathrm{cr}$. |
326 | 25.00 | 29.08 | 26.96 | 27.19 | 42.12 | 19.90 | 19.33 |
| X $\geq 500$ cr. | 113 | 62.77 | 62.73 | 62.28 | 57.36 | 36.14 | 69.47 | 70.21 |
| All | 4086 | 100.00 | 100.00 | 100.00 | 100.00 | 100.00 | 100.00 | 100.00 |
3.6.2.2. This distribution given in statement 6 reveals a highly skewed structure, where larger enterprises dominate in terms of asset ownership, capital formation, credit, and value addition. Large enterprises (with output Rs. 500 crores or more) constitute only $2.8 \%$ of the total surveyed enterprises but account for nearly $63 \%$ of fixed assets and capital formation, over $69 \%$ of Gross Value Added (GVA), and $70.2 \%$ of Net Value Added (NVA). The enterprises with output ranging between Rs100 and Rs. 500 crores represent $8 \%$ of the total count and contribute about $25 \%$ of fixed assets, over $42 \%$ of outstanding loans, around $20 \%$ of GVA. Enterprises with output less than Rs. 100 crores, but more than Rs. 10 crores though forming about $23 \%$ of the total enterprises, contribute less than $10 \%$ to each of the key economic indicators viz. fixed assets, gross and net fixed capital formation, gross and net value added. The smallest class (with output less than Rs. 10 crores) constitute more than $66 \%$ of the sampled units adding just $1.2 \%$ to GVA.
3.6.2.3 Percentage share of different employment indicators, like, Persons directly associated with the production of services, Supervisory and managerial staff, Total persons engaged and their wages/salaries are summarized in Statement 7 for different size classes of output.
Statement 7: Percentage share of employment indicators by different size classes of output (FY 2022-23)
| Size Class of Output $(\mathbf{X})$ |
No. of enterprises surveyed | Indicator* | |||||
|---|---|---|---|---|---|---|---|
| Persons directly associated with the production of services | Supervisory and managerial staff | Total persons engaged | $\begin{gathered} \text { Wages/salaries } \ \text { of Directly } \ \text { associated } \ \text { with the } \ \text { production of } \ \text { services } \end{gathered}$ | Wages/salaries of supervisory and managerial staff | Total compensation# | ||
| all-India | |||||||
| $\begin{aligned} & \mathrm{X}<10 \ & \mathrm{cr} . \end{aligned}$ | 2720 | 8.69 | 9.01 | 9.28 | 3.15 | 3.46 | 3.17 |
| $\begin{aligned} & 10 \mathrm{cr} . \ & \leq \mathrm{X}< \ & 100 \mathrm{cr} . \end{aligned}$ | 927 | 18.79 | 19.40 | 20.03 | 10.81 | 11.62 | 11.43 |
| $\begin{aligned} & 100 \mathrm{cr} . \ & \leq \mathrm{X}< \ & 500 \mathrm{cr} . \end{aligned}$ | 326 | 33.72 | 29.26 | 33.73 | 23.53 | 20.57 | 22.24 |
| $\begin{aligned} & \mathrm{X} \geq \ & 500 \mathrm{cr} . \end{aligned}$ | 113 | 38.81 | 42.33 | 36.96 | 62.51 | 64.35 | 63.17 |
| All | 4086 | 100.00 | 100.00 | 100.00 | 100.00 | 100.00 | 100.00 |
- generated based on sample observations
Ref: Table 8 of Appendix A
# includes bonus, contribution to provident fund and other funds and staff welfare expenses, etc.
3.6.2.4. The data reveals those smaller enterprises (with output below Rs. 10 crores) constitute about two-thirds of the sample but contribute only around $9 \%$ to total employment and a mere $3 \%$ to total compensation. In contrast, larger enterprises (with output above Rs. 500 crores) represent just $2.8 \%$ of enterprises but account for nearly $37 \%$ of total employment. Enterprises with output ranging between Rupees 100 crores \& Rupees 500 crores, while having almost a similar share in total persons engaged, their share in total compensation is much less in comparison to those having output Rupees 500 crores and above ( $22.2 \%$ vis-avis $63.2 \%$ ). Enterprises with output ranging between Rupees 10 crores and Rupees 100 crores account for about one-fifth of the total persons engaged while contributing $11.4 \%$ of the compensation.
# Converge of ASSSE as per NIC 2008 2-Digit Codes (Divisions)
| NIC 2008 Divisions |
Description |
|---|---|
| 36 | Water collection, treatment and supply |
| 37 | Sewerage |
| 38 | Waste collection, treatment and disposal activities; materials recovery |
| 39 | Remediation activities and other waste management services |
| 41 | Construction of buildings |
| 42 | Civil engineering |
| 43 | Specialized construction activities |
| 45 | Wholesale and retail trade and repair of motor vehicles and motorcycles Exclusions: 45200 (Maintenance and repair of motor vehicles) 45403 (Maintenance and repair of motor cycles, mopeds, scooters and three wheelers) |
| 46 | Wholesale trade, except of motor vehicles and motorcycles |
| 47 | Retail trade, except of motor vehicles and motorcycles |
| 49 | Land transport and transport via pipelines Exclusions: 491 (Transport via railways) 49212 (Urban or suburban tramways) 49213 (Urban or suburban underground or elevated railways) 493 (Transport via pipeline) |
| 50 | Water transport |
| 51 | Air transport (Activities of non-scheduled airlines only) |
| 52 | Warehousing and support activities for transportation |
| 53 | Postal and courier activities |
| 55 | Accommodation |
| 56 | Food and beverage service activities |
| 58 | Publishing activities |
| 59 | Motion picture, video and television programme production, sound recording and music publishing activities |
| 60 | Broadcasting and programming activities |
| 61 | Telecommunications |
| 62 | Computer programming, consultancy and related activities |
| 63 | Information service activities |
| 68 | Real estate activities |
| 69 | Legal and accounting activities |
| 70 | Activities of head offices; management consultancy activities |
| 71 | Architecture and engineering activities; technical testing and analysis |
| 72 | Scientific research and development |
| 73 | Advertising and market research |
| 74 | Other professional, scientific and technical activities |
| 75 | Veterinary activities |
| 77 | Rental and leasing activities |
| NIC 2008 Divisions |
Description |
|---|---|
| 78 | Employment activities |
| 79 | Travel agency, tour operator and other reservation service activities |
| 80 | Security and investigation activities |
| 81 | Services to buildings and landscape activities |
| 82 | Office administrative, office support and other business support activities |
| 85 | Education |
| 86 | Human health activities |
| 87 | Residential care activities |
| 88 | Social work activities without accommodation |
| 90 | Creative, arts and entertainment activities |
| 91 | Libraries, archives, museums and other cultural activities |
| 92 | Gambling and betting activities |
| 93 | Sports activities and amusement and recreation activities |
| 94 | Activities of membership organizations Exclusions: 942 (Activities of trade unions) 9492 (Activities of political organizations) |
| 95 | Repair of computers and personal and household goods |
| 96 | Other personal service activities |
Annexure-II
Details of the Blocks of the Phase-II Schedule
| Block No. | Block Description |
|---|---|
| Block 0 | Identification of the enterprise (updated after phase I) |
| Block 1 | Identification of the enterprise |
| Block 2 | Operational particulars of the enterprise |
| Block 2.1 | Distribution of establishments (additional places of businesses) over the districts of a state |
| Block 2.2 | Verification of activity details of the enterprise |
| Block 3 | Land and fixed assets owned and hired (long term lease) |
| Block 4 | Working capital and loans |
| Block 5 | Employment and labour cost |
| Block 6A | Purchase of goods for trading |
| Block 6B | Expenses (on goods and services) used for production of services (other than trading) |
| Block 6C | Other expenses for trading/production of services |
| Block 7A | Receipt from trading |
| Block 7B | Receipts from production of services (other than trading) |
| Block 7C | Other receipts from production of services |
| Block 8 | Taxes, subsidies and distributive expenses |
| Block 9* | Summary block (aggregates) |
| Block 10* | Summary block (ratios) |
| Block 11 | Particulars of use of Information and Communication Technology (ICT) by the enterprise |
| Block 12 | Particulars of field operations |
| Block No. | Block Description |
|---|---|
| Block 13 | Remarks by Survey Supervisor (SS) / Senior Statistical Officer (SSO) |
| Block 14 | Comments by inspecting/higher authority |
- for internal validation
APPENDIX A
DETAILED TABLES
Table 1: Distribution of Enterprises as per status in Phase-II (FY 2022-23)
| Status | Phase-II (FY 2022-23) | |
|---|---|---|
| No. of enterprises | Percentage of enterprises | |
| (1) | (2) | (3) |
| Open and Producing services (code 1) | 3979 | 79.26 |
| Existing with fixed assets and maintaining staff but not producing any services (code 2) | 28 | 0.56 |
| Existing with fixed assets but neither maintaining staff nor producing any services (code 3) | 79 | 1.57 |
| Enterprise is non-existing (code 4) | 89 | 1.77 |
| Owner/occupier of the enterprise is not traceable (code 5) | 91 | 1.81 |
| Out of coverage (code 6) | 175 | 3.49 |
| Non-response (code 7) | 579 | 11.53 |
| Total | 5020 | 100.00 |
Table 2: Number of Enterprises allotted and found existing in Phase-II (FY 2022-23) for each State/UT
| State/UT | Phase-II (FY 2022-23) | |||
|---|---|---|---|---|
| Allotted | No. of existing enterprises | Percentage of existing enterprises | Percentage of enterprises having additional places of business in the state | |
| (1) | (2) | (3) | (4) | (5) |
| Andhra Pradesh | 123 | 106 | 86.18 | 45.28 |
| Arunachal Pradesh | 10 | 8 | 80.00 | 25.00 |
| Assam | 58 | 48 | 82.76 | 35.42 |
| Bihar | 103 | 81 | 78.64 | 22.22 |
| Chhattisgarh | 69 | 53 | 76.81 | 24.53 |
| Delhi | 405 | 300 | 74.07 | 23.67 |
| Goa | 45 | 28 | 62.22 | 35.71 |
| Gujarat | 306 | 263 | 85.95 | 29.28 |
| Haryana | 297 | 229 | 77.10 | 24.02 |
| Himachal Pradesh | 49 | 43 | 87.76 | 16.28 |
| Jharkhand | 68 | 51 | 75.00 | 35.29 |
| Karnataka | 446 | 370 | 82.96 | 24.59 |
| Kerala | 168 | 152 | 90.48 | 23.68 |
| Madhya Pradesh | 102 | 79 | 77.45 | 24.05 |
| Maharashtra | 801 | 644 | 80.40 | 28.73 |
| Manipur | 17 | 12 | 70.59 | 58.33 |
| Meghalaya | 17 | 11 | 64.71 | 45.45 |
| Mizoram | 10 | 8 | 80.00 | 25.00 |
| Nagaland | 7 | 4 | 57.14 | 25.00 |
| Odisha | 80 | 57 | 71.25 | 33.33 |
| Punjab | 100 | 80 | 80.00 | 26.25 |
| Rajasthan | 184 | 142 | 77.17 | 36.62 |
| Sikkim | 15 | 12 | 80.00 | 16.67 |
| Tamil Nadu | 359 | 316 | 88.02 | 34.49 |
| Telangana | 291 | 220 | 75.60 | 25.91 |
| Tripura | 12 | 12 | 100.00 | 41.67 |
| Uttar Pradesh | 342 | 294 | 85.96 | 29.93 |
| Uttarakhand | 40 | 27 | 67.50 | 33.33 |
| West Bengal | 317 | 280 | 88.33 | 30.36 |
| A \& N Islands | 17 | 15 | 88.24 | 13.33 |
| Chandigarh | 53 | 46 | 86.79 | 19.57 |
| D \& N Haveli and Daman \& Diu | 20 | 15 | 75.00 | 13.33 |
| Jammu And Kashmir | 56 | 51 | 91.07 | 25.49 |
| Ladakh | 5 | 5 | 100.00 | 0.00 |
| Lakshadweep | 1 | 1 | 100.00 | 0.00 |
| Puducherry | 24 | 21 | 87.50 | 38.10 |
| All India* | 5020 | 4086 | 81.39 | 28.46 |
*Includes enterprises surveyed in ‘other territories’, i.e. they belong to Union of India but not to any particular State/UT Generated based on sample observations
Table 3: Number of existing enterprises along with percentage distribution of additional places of business in Phase-II (FY 2022-23) for each NIC Division
| NIC-2008 Division | Phase-II (FY 2022-23) | |
|---|---|---|
| No. of existing enterprises | Percentage of enterprises having additional places of business in the state | |
| (1) | (2) | (3) |
| BAC: Construction | ||
| 41 | 226 | 16.37 |
| 42 | 165 | 29.09 |
| 43 | 119 | 21.01 |
| Total | 510 | 21.57 |
| BAC: Trade | ||
| 45 | 153 | 74.51 |
| 46 | 888 | 35.02 |
| 47 | 367 | 44.41 |
| Total | 1408 | 41.76 |
| BAC: Other Services | ||
| 36 | 9 | 33.33 |
| 37 | 2 | 50.00 |
| 38 | 9 | 44.44 |
| 39 | 1 | 0.00 |
| 49 | 79 | 36.71 |
| 50 | 34 | 20.59 |
| 52 | 166 | 27.11 |
| 53 | 28 | 46.43 |
| 55 | 101 | 20.79 |
| 56 | 77 | 46.75 |
| 58 | 19 | 10.53 |
| 59 | 20 | 15.00 |
| 60 | 21 | 33.33 |
| 61 | 72 | 29.17 |
| 62 | 349 | 14.61 |
| 63 | 48 | 8.33 |
| 68 | 169 | 20.12 |
| 69 | 63 | 19.05 |
| 70 | 101 | 7.92 |
| 71 | 105 | 25.71 |
| 72 | 16 | 25.00 |
| 73 | 72 | 11.11 |
| 74 | 65 | 12.31 |
| 75 | 1 | 100.00 |
| 77 | 40 | 27.50 |
| 78 | 84 | 10.71 |
| 79 | 41 | 9.76 |
| 80 | 38 | 18.42 |
| 81 | 26 | 19.23 |
| 82 | 111 | 27.03 |
| 85 | 65 | 20.00 |
| 86 | 78 | 32.05 |
| 88 | 4 | 25.00 |
| 90 | 9 | 0.00 |
| 92 | 1 | 0.00 |
| 93 | 23 | 21.74 |
| 94 | 2 | 0.00 |
| 95 | 10 | 30.00 |
| 96 | 9 | 33.33 |
| Total | 2168 | 21.45 |
| All India | 4086 | 28.46 |
Generated based on sample observations
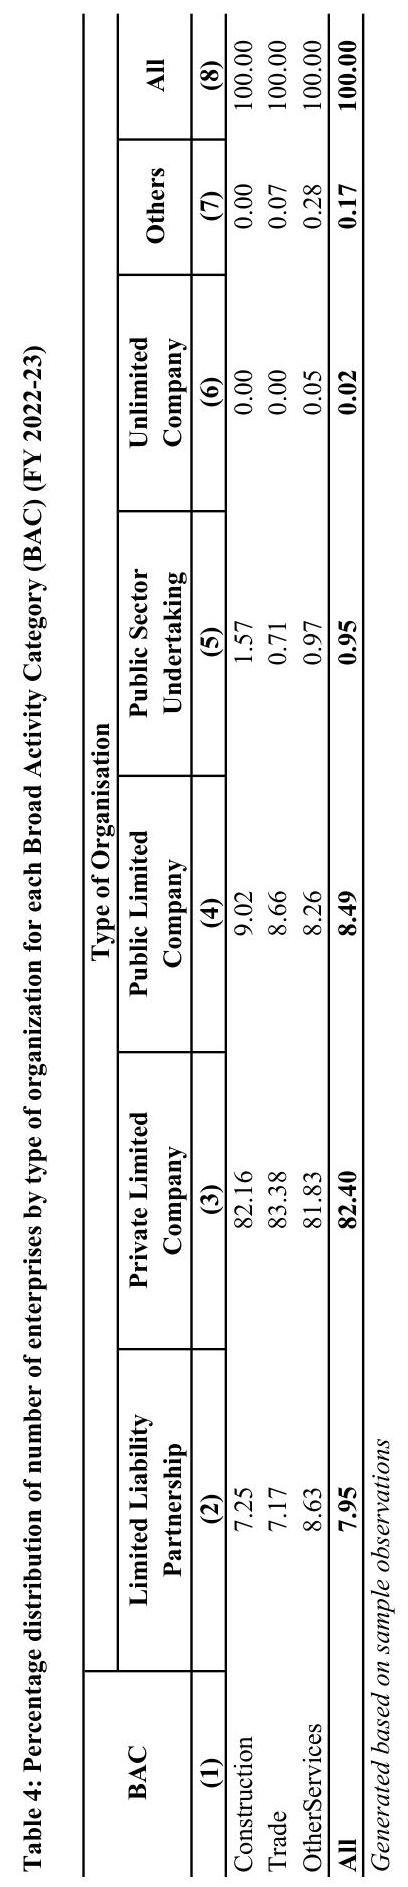
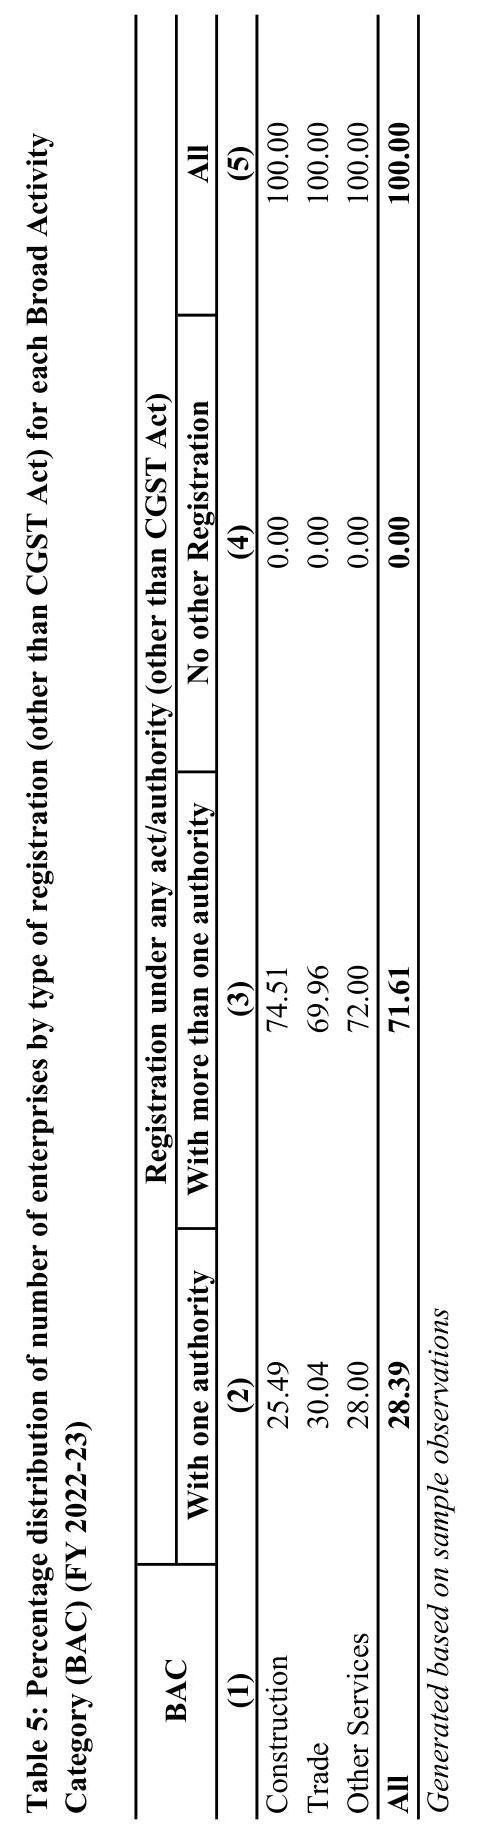
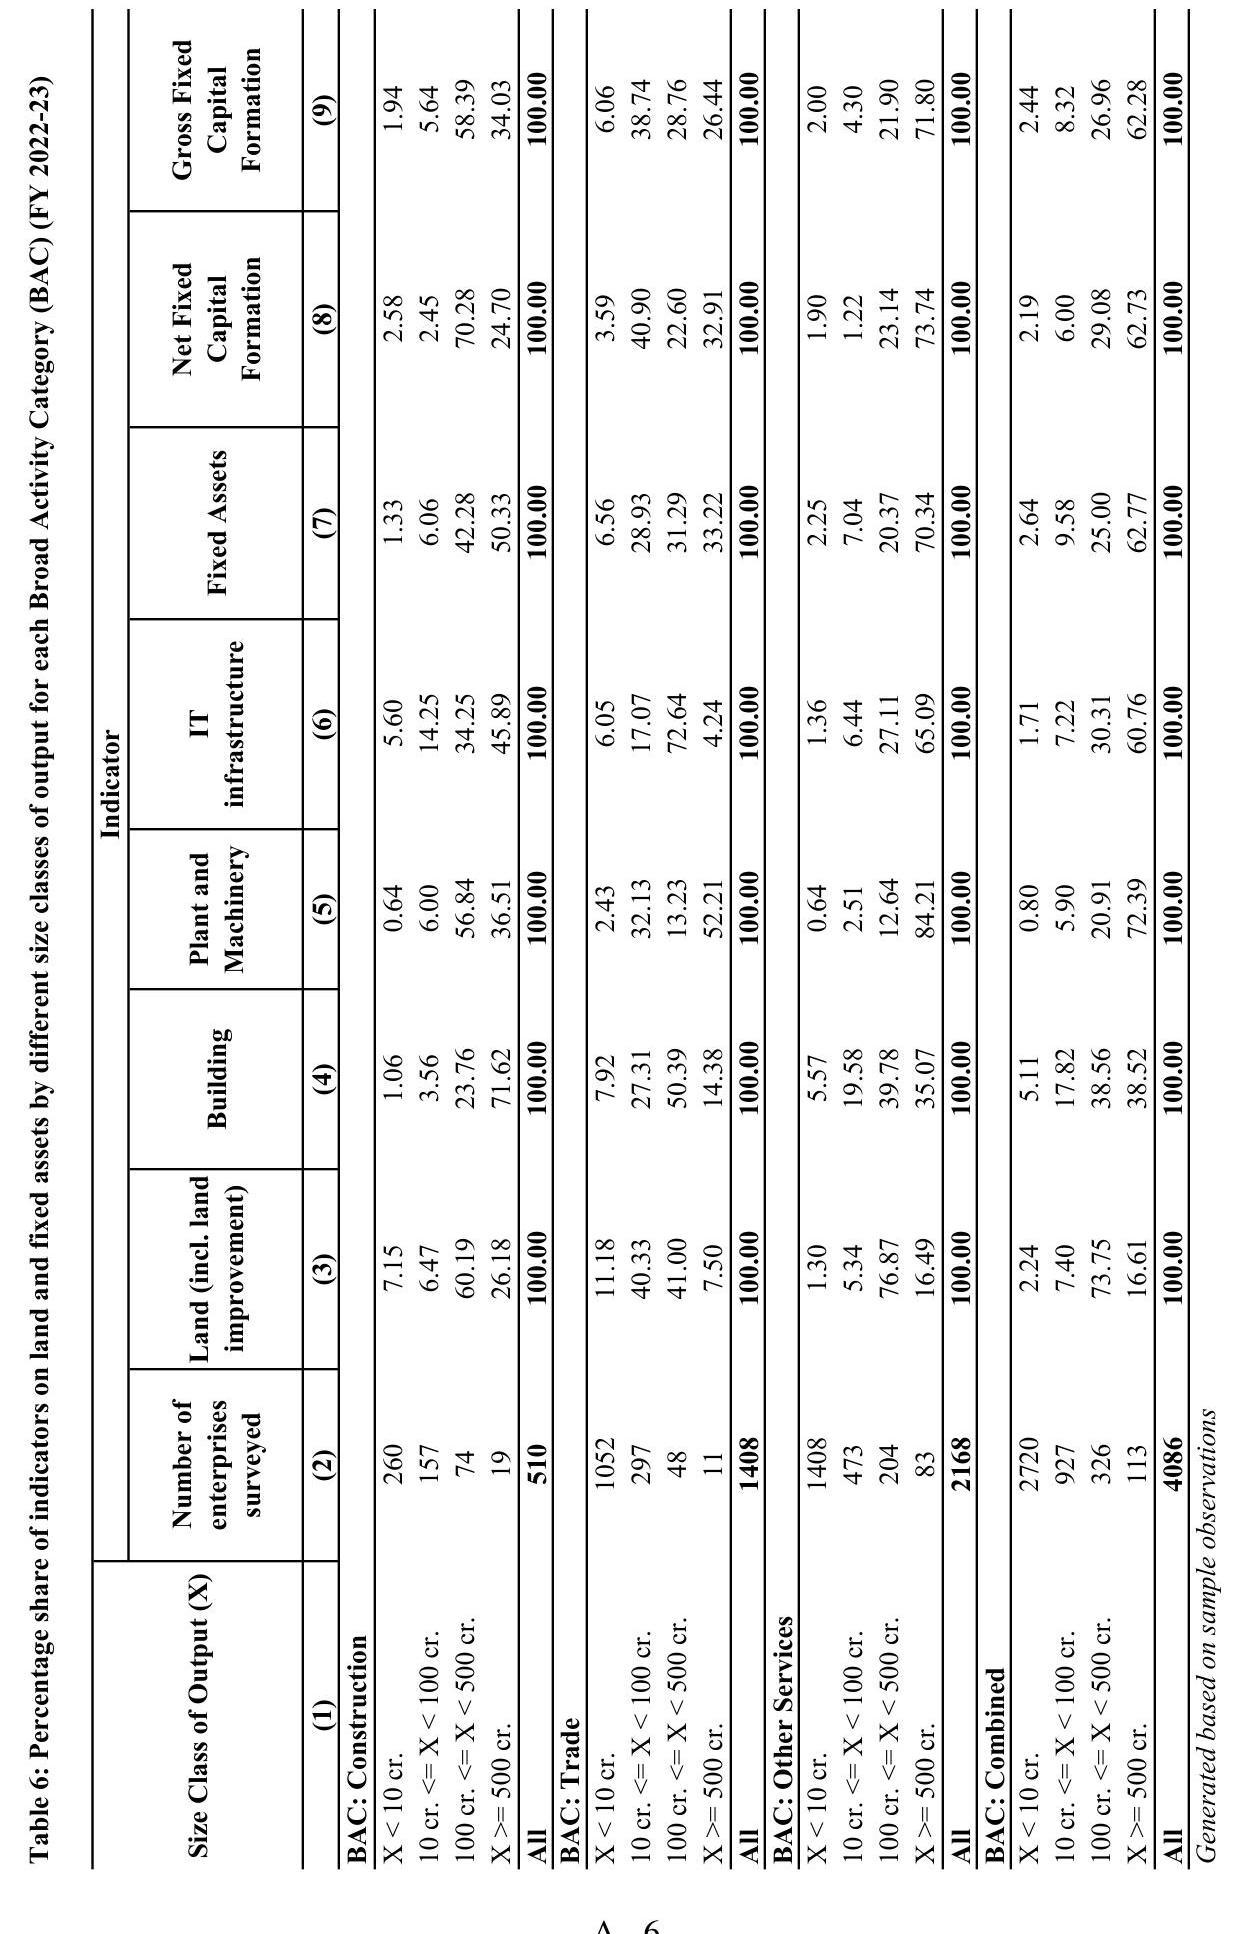
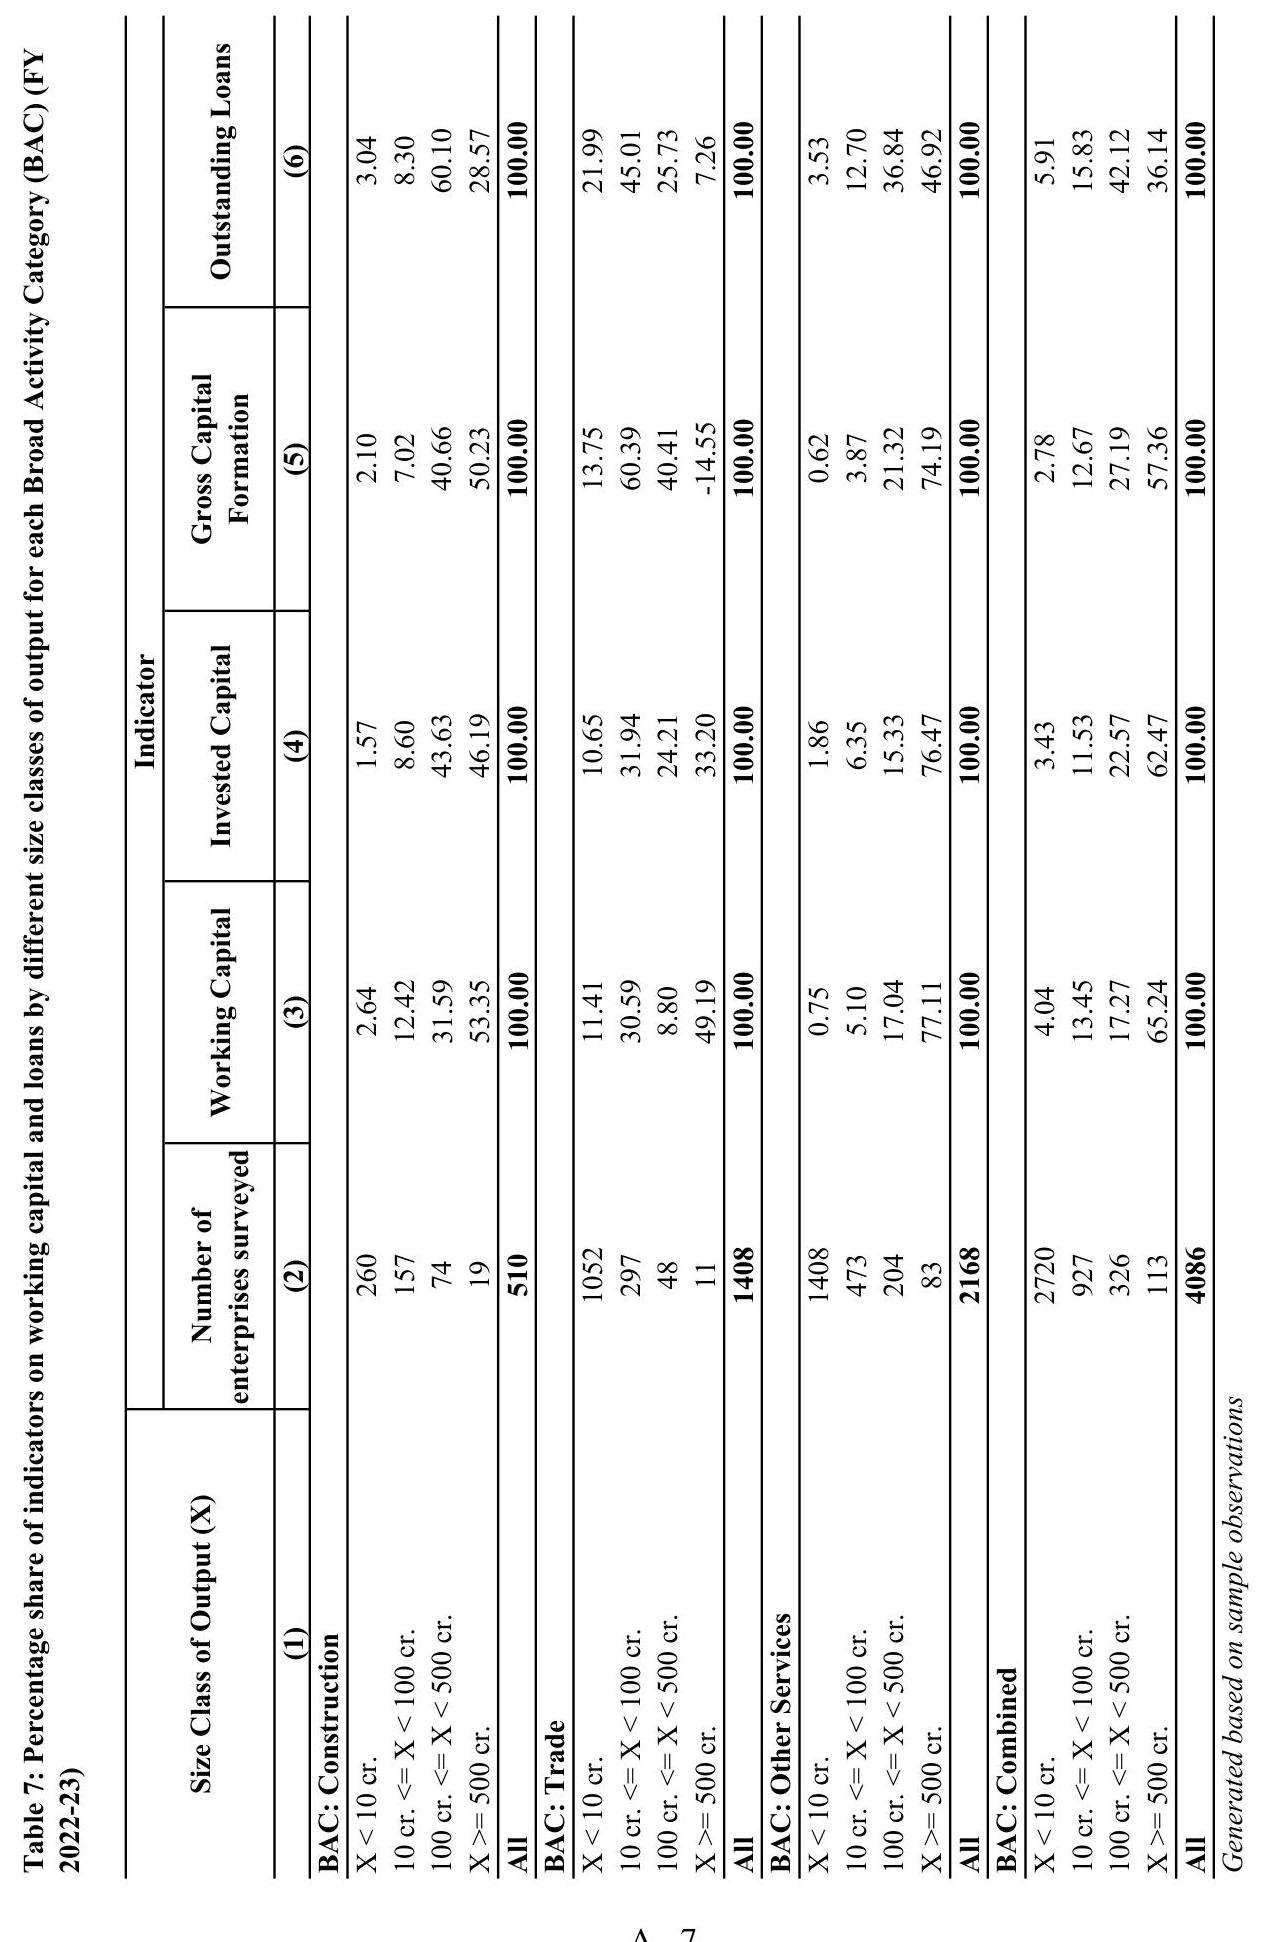
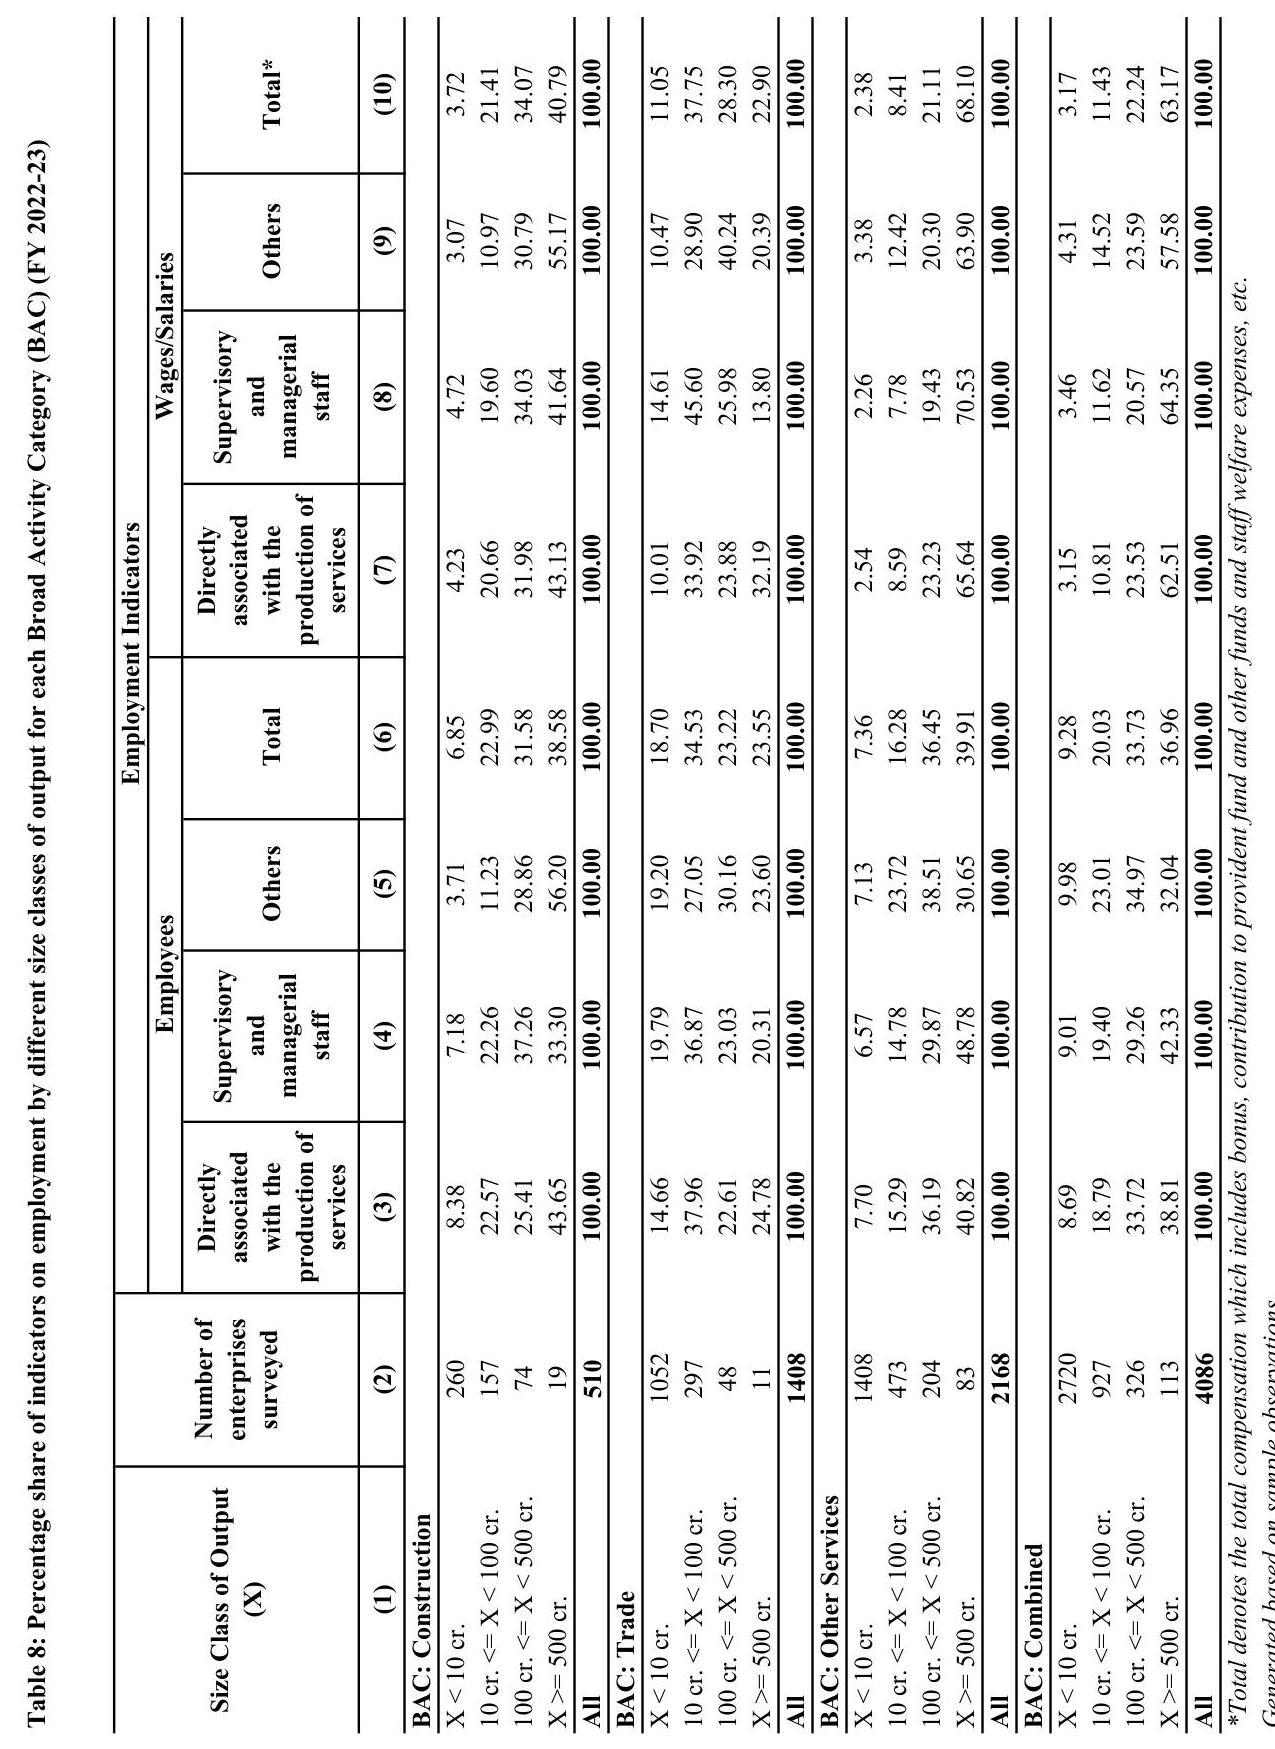
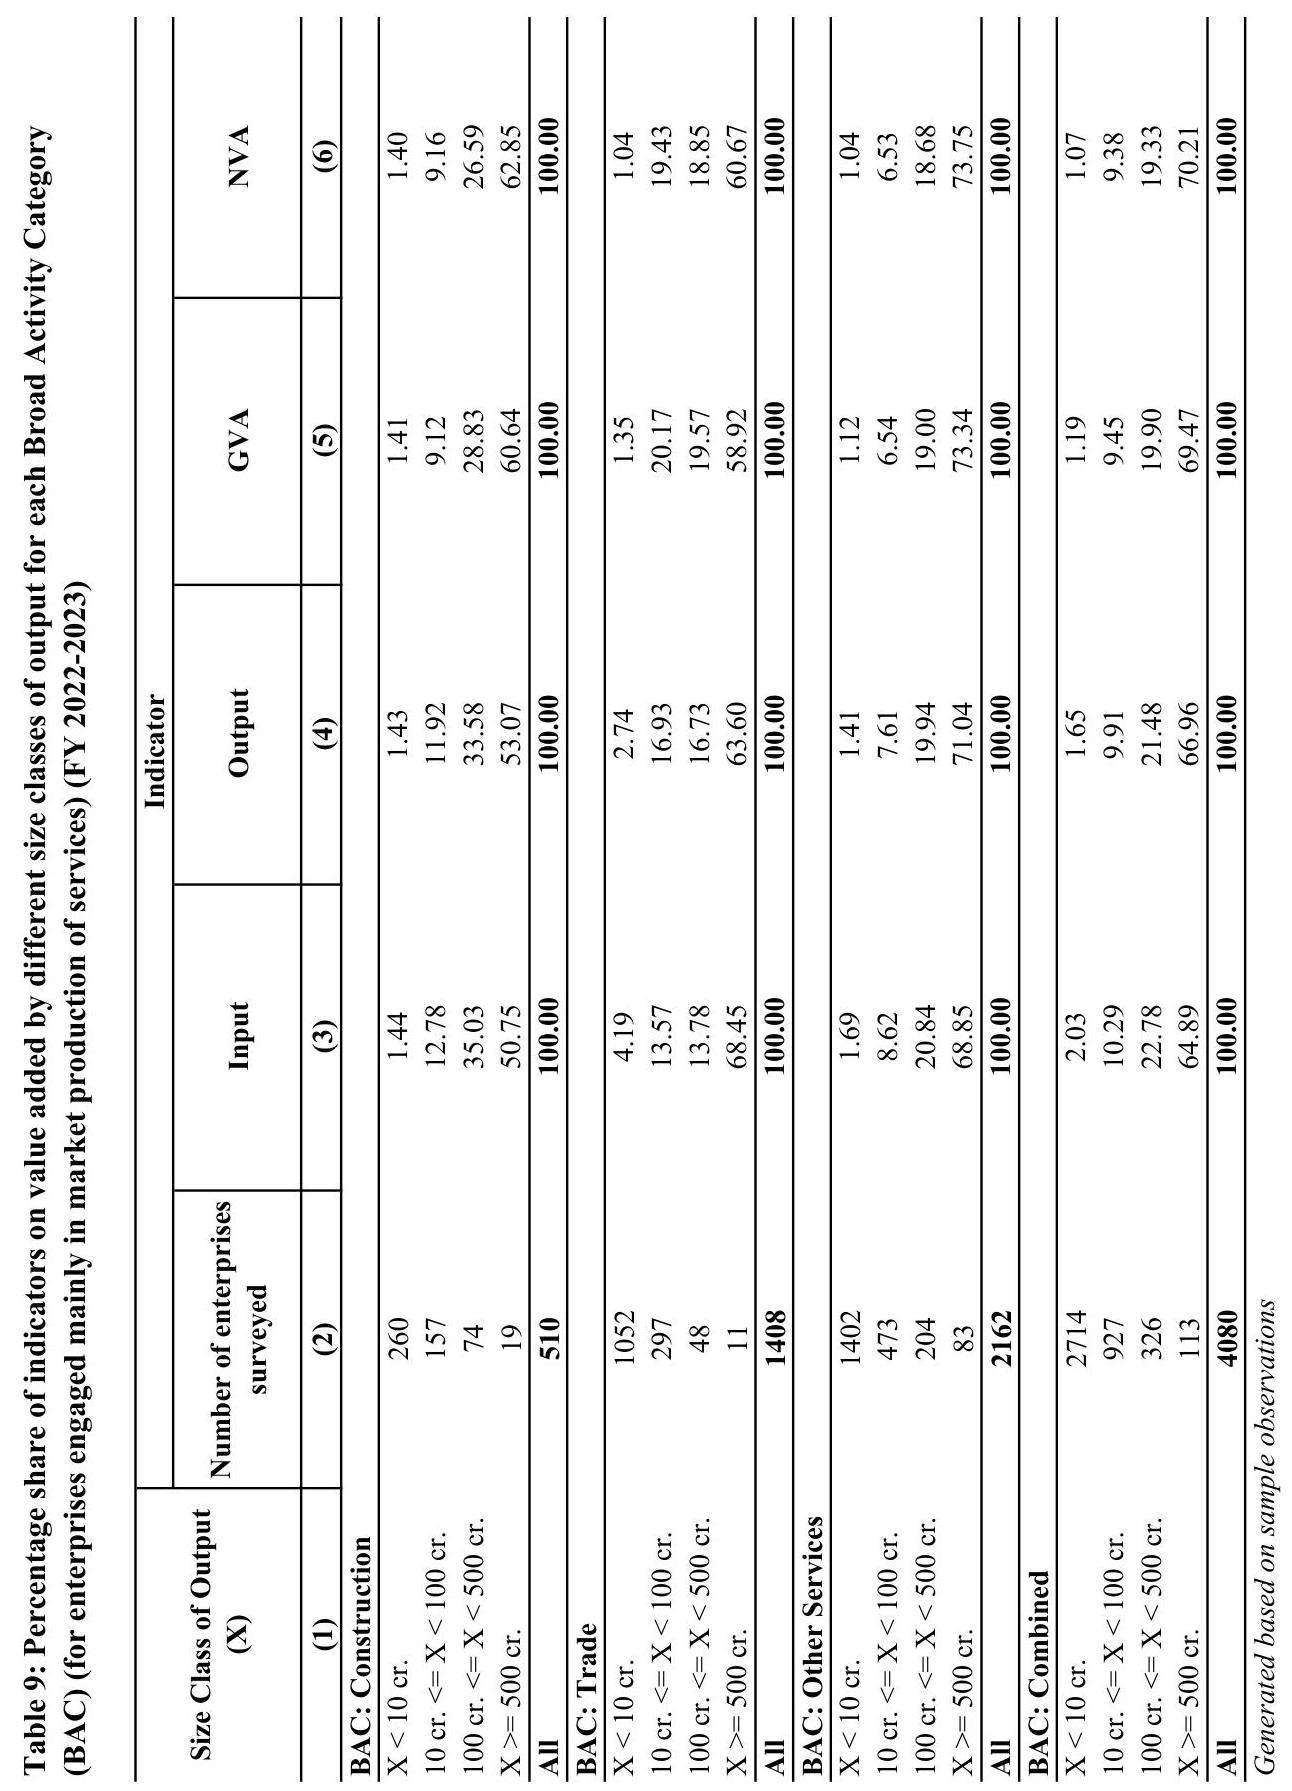
APPENDIX B
PHASE – I AND PHASE – II SCHEDULES
GOVERNMENT OF INDIA
NATIONAL STATISTICS OFFICE
ANNUAL SURVEY OF SERVICES SECTOR ENTERPRISE (ASSSE) ENTERPRISE SCHEDULE: PHASE-I
| Block A1: verification of identification details (in frame) of the enterprise | |||||||||||||
|---|---|---|---|---|---|---|---|---|---|---|---|---|---|
| sl. no. | item | information as per frame | is information in col. 3 correct? $\left(\right.$ Yes $-11 /$ No- ‘2’) | if ‘No’ in col. 4, then updated information in column 5 . | |||||||||
| (1) | (2) | (3) | (4) | (5) | |||||||||
| 1 | dispatch serial number (DSL) | ||||||||||||
| 2 | name | ||||||||||||
| 3 | address | ||||||||||||
| 4 | village/town | ||||||||||||
| 5 | district | ||||||||||||
| 6 | pin code | ||||||||||||
| 7 | State/UT | ||||||||||||
| 8 | GSTIN | ||||||||||||
| 9 | business type | ||||||||||||
| 10 | no. of establishments in the state |
Block A2: other details of the enterprise
| sl. no. | item | information | |||||||||
|---|---|---|---|---|---|---|---|---|---|---|---|
| (1) | (2) | (3) | |||||||||
| 1 | sector (1 -rural / 2- urban) | ||||||||||
| 2 | current status | ||||||||||
| 3 | contact number (with STD code) | ||||||||||
| 4 | name and designation | ||||||||||
| 5 | e-mail id | ||||||||||
| 6 | name of the data collector(FI/JSO/SSO) \& code | ||||||||||
| 7 | name of the supervisor (JSO/SSO) \& code | ||||||||||
| 8 | SRO/NSRO code | ||||||||||
| 9 | date of data collection (dd-mm-yyyy) |
Block B: verification of activity details of the enterprise
| sl. no. | activity as per frame | is the activity given in col. 2 and col. 3 actually pursued by the enterprise during the reference period? (yes – ‘1’/no- ‘2’/ new activity – ‘3’) |
if ‘Yes’ or ‘new activity’ in col. 4, then provide the correspond- ding NIC 3-digit |
$\%$ share of the NIC 3-digit (col. 5) to the total gross sale value(round figure) |
|
|---|---|---|---|---|---|
| 3-digit NIC- 2008 code |
description | ||||
| (1) | (2) | (3) | (4) | (5) | (6) |
| 1 | |||||
| 2 | |||||
| 3 | |||||
| 4 | |||||
| 5 | |||||
| Total | 100 |
- Any non-agricultural activity (at NIC 3-digi level) which was actually pursued by the enterprise during the reference period, but not exists in the frame, then its corresponding share of total gross sale value (in \%) may directly be entered in cols. 5 and 6 in a separate row with code ‘ 3 ‘ in col. 4 and leaving col. 2 and col. 3 blank.
| Block C: quantitative information of the enterprise | ||
|---|---|---|
| sl. no. | Item | information for the reference period |
| 1 | total gross sale value at State/UT level during the reference period (Rs.) (excl. agricultural and manufacturing) | |
| 2 | total persons engaged at State/UT level during the reference period (excl. agricultural and manufacturing) | |
| 3 | major activity (NIC 3-digit) of the enterprise (see col. 5 and col. 6 of Block B) | |
| 4 | is the enterprise covered in ASI for its major activity reported in C3? (yes -1/ no-2) |
Block D: remarks
GOVERNMENT OF INDIA
NATIONAL STATISTICS OFFICE
ANNUAL SURVEY OF SERVICES SECTOR ENTERPRISES (ASSSE)
ENTERPRISE SCHEDULE: PHASE II
| Block 0: identification of the enterprise (as on date of survey) (updated after Phase I) | |||||||||
|---|---|---|---|---|---|---|---|---|---|
| dispatch serial number (DSL) | |||||||||
| 1.name and address of the enterprise: | i. name: | ||||||||
| ii. address: | |||||||||
| iii. village/town: | |||||||||
| iv. district: | |||||||||
| v. state: | |||||||||
| vi. PIN Code: | |||||||||
| vii. SRO/NSRO code | |||||||||
| 2. Detail of contact information: | i. name | ||||||||
| ii. designation | |||||||||
| iii. landline (with STD code excluding leading zero)/Mobile no. (excluding country code) of the contact person | |||||||||
| iv. landline (with STD code excluding leading zero)/Mobile no. (excluding country code) of the enterprise | |||||||||
| v. e-mail: |
DECLARATION
I hereby declare that the information furnished in this return is correct and complete to the best of my knowledge and belief.
(Name and Signature of owner/Authorized Signatory with stamp)
Date:
Place:
Block 1: identification of the enterprise (during the accounting period)
| item no. |
item | code |
|---|---|---|
| 1. | sector (Rural – 1, Urban – 2) | |
| 2. | status of enterprise during the accounting period |
Codes for Block 1
item 2: status of enterprise during the accounting period
1 – open and producing services
2 – existing with fixed assets and maintaining staff but not producing any services
3 – existing with fixed assets but neither maintaining staff nor producing any services
4 – selected enterprise is non-existing
5 – owner/occupier of the enterprise is not traceable
6 – out of coverage
7 – non-response due to production of services not yet started or accounting year not closed during the accounting period or any other reason
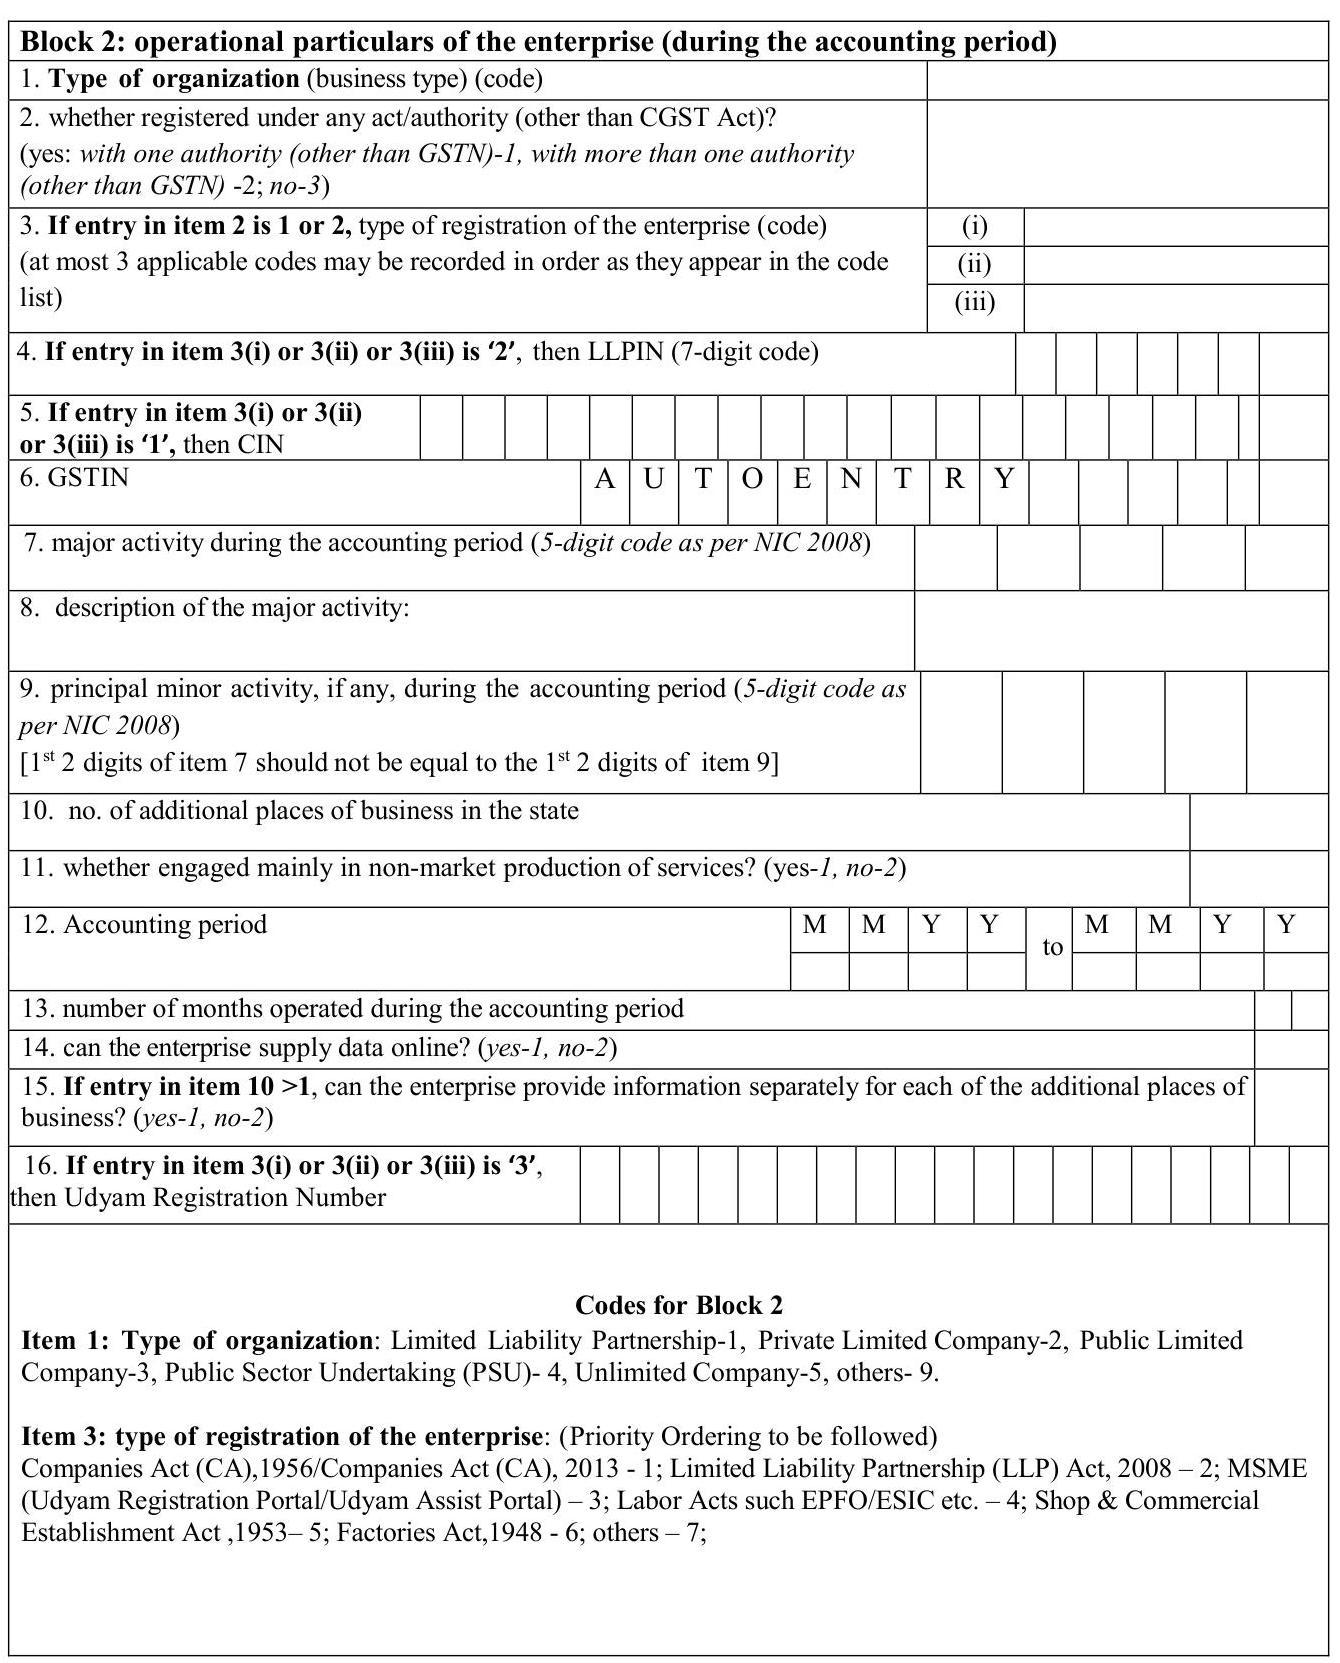
Block 2.1: distribution of establishments (additional places of businesses) over the districts of a state (during the accounting period)
| sl. no. | name of the district | district code |
number of establishments | |
|---|---|---|---|---|
| as per frame | actual | |||
| (1) | (2) | (3) | (4) | (5) |
| 1. | ||||
| 2. | ||||
| 3. | ||||
| 4. | ||||
| 5. | ||||
| 6. | ||||
| 7. | ||||
| 8. | ||||
| 9. | ||||
| 10. | ||||
| 11. | ||||
| 12. | ||||
| 13. | ||||
| 14. | ||||
| 15. | ||||
| 16. | ||||
| 17. | ||||
| 18. | ||||
| 19. | ||||
| 20. | ||||
| 21. | ||||
| 22. | ||||
| 23. | ||||
| 24. | ||||
| 25. | ||||
| 26. | ||||
| 27. | ||||
| 28. | ||||
| 29. | ||||
| 30. | ||||
| 31. | ||||
| 32. | ||||
| 33. | ||||
| 34. | ||||
| 35. | ||||
| 36. | ||||
| 37. | ||||
| 38. | ||||
| 39. | ||||
| 40. | ||||
| 41. | ||||
| 42. | ||||
| total no. of additional places of business (the value in col. 5 should exactly match with item10 of block 2 |
Block 2.2: verification of activity details of the enterprise (to be seen from Phase-I) (during the accounting period)
| sl. no. | activity as per Phase-I | is the activity given in col. 2 and col. 3 actually pursued by the enterprise during the accounting period? (yes $-{ }^{\prime} 1^{\prime} /$ no- ‘2’/ new activity $-{ }^{\prime} 3^{\prime}$ ) |
if ‘Yes’ or ‘new activity’ in col. 4, then provide the corresponding NIC 3-digit | \% share of the NIC 3-digit (col. 5) to the total gross sale value (round figure) | |
|---|---|---|---|---|---|
| NIC- 20083 – digit code |
description | ||||
| (1) | (2) | (3) | (4) | (5) | (6) |
| 100 |
*Any non-agricultural activity (at NIC 3-digit level) which was actually pursued by the enterprise during the accounting period, but not exists in the frame and its corresponding share of total gross sale value (in \%) may directly be entered in cols. 5 and 6 in a separate row with code ‘ 3 ‘ in col. 4 and leaving col. 2 and col. 3 blank.
| Block 3: Land and fixed assets owned and hired (long term lease) as on the last date of the accounting period (Rs. in whole number) [Data for this block will be available from the Balance Sheet] | |||||||||||
|---|---|---|---|---|---|---|---|---|---|---|---|
| sl. no. |
type of asset | gross value (Rs.) | depreciation/amortization (Rs.) | net value (Rs.) | |||||||
| $\begin{gathered} \text { openin } \ \text { g as on } \ \text { ——– } \end{gathered}$ | addition during the year (Rs.) | deduction and adjustment during the year | closing as on $\qquad$ (col. $3+$ col. $4+$ col. $5-$ col. 6$)$ |
upto year beginning | provided during the year | adjustment for sold/ discarded during the year | $\begin{gathered} \text { upto year } \ \text { end } \ \text { (col. } 8+ \ \text { col. } 9-\text { col. } \ 10) \ \hline \end{gathered}$ | opening as on —– (col.3 col. 8) | closing as on……… col. 7 – col. 11) |
|||
| (1) | (2) | (3) | (4) | (5) | (6) | (7) | (8) | (9) | (10) | (11) | (12) | (13) |
| 1 | land (including land improvement) | | | |||||||||
| 2 | building | | | |||||||||
| 3 | plant and machinery | | | |||||||||
| 4 | transport equipment | | | |||||||||
| 5 | furniture and fixtures | | | |||||||||
| 6 | software and database | | | |||||||||
| 7 | information, computer and telecommunications equipment | | | |||||||||
| 8 | tools and other fixed assets | | | |||||||||
| 9 | R\&D and other intellectual property products | | | |||||||||
| 10 | capital work in progress | | | |||||||||
| 11 | total (items 1 to 10) | | | |||||||||
| 12 | non-produced intangible assets | | |
| Block 4: working capital and loans (as on the last date of accounting period) | |||
|---|---|---|---|
| sl.no | Items | closing (Rs.) | opening (Rs.) |
| (1) | (2) | (3) | (4) |
| 1 | materials, supplies and stores | ||
| 2 | Others | ||
| 3 | sub-total (item 1 and 2) | ||
| 4 | semi-finished goods/work in progress | ||
| 5 | stock of trading goods (trading activities) | ||
| 6 | total inventory (items 3 to 5) | ||
| 7 | cash-in-hand \& at bank | ||
| 8 | sundry debtors | ||
| 9 | other current assets | ||
| 10 | total current assets (items 6 to 9) | ||
| 11 | sundry creditors | ||
| 12 | over draft, cash credit, other short-term loan from banks \& other financial institutions | ||
| 13 | other current liabilities | ||
| 14 | total current liabilities (items 11 to 13) | ||
| 15 | working capital (item 10 – item 14) * | ||
| 16 | outstanding loans (excluding interest) ** | ||
| *Give reasons in the remarks for negative values and abnormal variation in opening and closing values. **If outstanding loans include interest, remarks may be given. |
Block 5: employment and labour cost during the accounting period
| i. | number of working days of the enterprise during the accounting period (in whole number of days) | |||
|---|---|---|---|---|
| $\begin{aligned} & \text { sl. } \ & \text { no. } \end{aligned}$ | category of staff | average no. of days worked | total number of persons worked | total wages/salari es (in Rs.) during the accounting period |
| (1) | (2) | (3) | (4) | (5) |
Part A: details for each category of staff employed by the enterprise directly/ through contractor (on the payroll)
| 1 | persons directly associated with the production of services | male | |||
|---|---|---|---|---|---|
| 2 | female | ||||
| 3 | supervisory \& managerial staff | male | |||
| 4 | female | ||||
| 5 | others | male | |||
| 6 | female | ||||
| 7 | employed through contractors (on the payroll) | male | |||
| 8 | female | ||||
| 9 | all (item 7+item 8) |
Auto- calculated |
Auto-calculated | Auto-calculated | |
| 10 | total persons engaged (1 to 6 and 9 ) | ||||
| 11 | persons employed through contractors (not on the payroll) | ||||
| 12 | persons working voluntarily (without remuneration) |
Part B: other details for all categories of staff combined (items 1 to 6 and 9)
| 13 | bonus (in Rs.) | ||
|---|---|---|---|
| 14 | contribution to Provident fund and other funds (in Rs.) | ||
| 15 | staff welfare expenses (in Rs.) | ||
| 16 | compensation to employees: total of column 5 of item 10 + item 13 + item 14 + item 15) |
| Block 6A: purchase of goods for trading during the accounting period | |||||
|---|---|---|---|---|---|
| Sl. no. |
item description | item code (CPC 2.0) |
expenditure (in Rs.) |
imported (yes -1, no-2) |
If yes in col. 5, then percentage of import |
| (1) | (2) | (3) | (4) | (5) | (6) |
| 1 | |||||
| 2 | |||||
| 3 | |||||
| 4 | |||||
| 5 | |||||
| 6 | |||||
| 7 | other trading items | 60001 | |||
| 8 | total purchase value of goods traded (items 1 to 7) | 60009 |
Block 6B: expenses (on goods and services) used for production of services during the accounting period (other than trading)
| Sl. no. |
item description | item code (CPC 2.0) |
expenditure (in Rs.) |
imported (yes -1, no-2) |
If yes in item 5, then percentage of import |
|---|---|---|---|---|---|
| (1) | (2) | (3) | (4) | (5) | (6) |
| 1 | |||||
| 2 | |||||
| 3 | |||||
| 4 | |||||
| 5 | |||||
| 6 | |||||
| 7 | |||||
| 8 | |||||
| 9 | |||||
| 10 | others | 70001 | |||
| 11 | total of input items (items 1 to 10) | 70009 |
| Block 6C: other expenses for trading/production of services during the accounting period | |||||
|---|---|---|---|---|---|
| (1) | (2) | (3) | (4) | ||
| 1 | electricity charges | 70011 | |||
| 2 | fuel and lubricant | 70012 | |||
| 3 | Consumables | 70013 | |||
| 4 | service charges for work done by other concerns | 70014 | |||
| 5 | value of raw materials consumed for own construction | 70015 | |||
| 6 | transport expenses | 70016 | |||
| 7 | other expenses | 70017 | |||
| 8 | minor repair and maintenance of | building and other construction | 70018 | ||
| 9 | other fixed assets | 70019 | |||
| 10 | rental paid for fixed assets including building (other than land) | 70020 | |||
| 11 | total expenses (other than trading) [ (item 1 + item $2+$ $\qquad$ + item 10) plus (sl. no. 11, col 4 of Bl. 6B)] | 70029 | |||
| 12 | rent/royalties paid for land on lease and natural resources | 70031 | |||
| 13 | interest paid | 70032 | |||
| 14 | insurance premium paid | 70033 |
| Block 7A: receipt from trading during the accounting period | |||||
|---|---|---|---|---|---|
| sl. no |
item description | item code (CPC 2.0) |
receipt (in Rs.) |
exported (yes -1, no-2) |
If yes in col. 5, then percentage of export |
| (1) | (2) | (3) | (4) | (5) | (6) |
| 1 | |||||
| 2 | |||||
| 3 | |||||
| 4 | |||||
| 5 | |||||
| 6 | |||||
| 7 | other trading items | 80001 | |||
| 8 | total receipt of goods traded (items 1 to 7) | 80009 | |||
| 9 | Percentage of receipts through online, if any | 80011 |
Block 7B: receipts from production of services during the accounting period (other than trading)
| sl. no |
service description | item code (CPC 2.0) |
receipts (in Rs.) |
|---|---|---|---|
| (1) | (2) | (3) | (4) |
| 1 | |||
| 2 | |||
| 3 | |||
| 4 | |||
| 5 | |||
| 6 | |||
| 7 | |||
| 8 | |||
| 9 | |||
| 10 | Others | 90001 | |
| 11 | total receipts from services (items 1 to 10) | 90009 | |
| 12 | total receipts from foreigners by providing domestic services | 90011 | |
| 13 | total receipts from services delivered abroad through the internet | 90012 | |
| 14 | total receipts by placing personnel in foreign country | 90013 | |
| 15 | Percentage of receipts through online, if any | 90014 |
Block 7C: other receipts from production of services during the accounting period
| (1) | (2) | (3) | (4) |
|---|---|---|---|
| 1 | change-in-stock of semi-finished goods (item 4 of Bl. 4 (col. 3-col. 4)) | 90021 | |
| 2 | change-in-stock of finished goods/stock-in-trade (item 5 of Bl. 4 (col. 3-col. 4)) | 90022 | |
| 3 | value of own construction | 90023 | |
| 4 | other receipts | 90024 | |
| 5 | rental/royalty received for produced assets | 90025 | |
| 6 | total receipts other than trading [(item 1 + item 3 +item 4 + item 5) plus (sl. no. 11, col 4 of Bl. 7B)] | 90029 | |
| 7 | rent/royalty received for non-produced assets | 90031 | |
| 8 | interest received | 90032 |
Block 8: taxes, subsidies and distributive expenses during the accounting period
| sl.no. | item description | item code | value (in Rs.) |
|---|---|---|---|
| (1) | (2) | $(3)$ | $(4)$ |
| 1 | taxes on products/services, where receipts in Block 7A and 7B include these taxes (such as GST, excise duty, etc.) |
90041 | |
| 2 | amount paid as taxes on production (license fee, registration, etc.) | 90042 | |
| 3 | amount received as subsidies on product/services | 90043 | |
| 4 | amount received as other production subsidies | 90044 | |
| 5 | total distributive expenses | 90045 | |
| 6 | input tax credit received/receivable for purchase of input | 90046 |
| Block 9: summary block (aggregates) [FOR INTERNAL USE] | |||||
|---|---|---|---|---|---|
| sl. no. |
Items | current accounting period | last accounting period | percentage change | remarks |
| (1) | (2) | (3) | (4) | (5) | (6) |
| 1. | fixed capital (Rs.) (sl. no. 11, col. 13, block 3) | ||||
| 2. | working capital (Rs.) (sl. no. 15, col. 3, block 4) | ||||
| 3. | total persons engaged (sl. no. 10, col. 4, block 5) | ||||
| 4. | compensation to employees (Rs.) (sl. no. 16, col. 5, block 5) | ||||
| 5. | total input (Rs.) (sl. no. 11, col. 4 of block 6C) | ||||
| 6. | total receipts (Rs.) (sl. no. 6, col. 4 of block 7C) | ||||
| 7. | taxes less subsidies (Rs.) (on product/services) (sl. no. 1, col. 4 of block 8 minus sl. no. 3 , col. 4 of block 8 minus sl. no. 6 , col. 4 of block 8) | ||||
| 8. | total output (Rs.) [(sl. no. 6 + (sl. no. 8, col. 4 of block 7A minus sl. no. 8 , col. 4 of block 6 A plus (sl. no. 2 , col. 4 of block 7C) minus (sl. no. 7) minus sl. no. 5 , col. 4 of block 8$]$ |
||||
| 9. | gross value added (Rs.) (sl. no. 8 minus sl. no. 5) | ||||
| 10. | depreciation (Rs.) (sl. no. 11, col. 9, block 3) | ||||
| 11. | net value added (Rs.) (sl. no. 9 minus sl. no. 10) | ||||
| 12. | net rent paid (Rs.) (sl. no. 12, col. 4 of block 6C minus sl. no. 7, col. 4 of block 7C) | ||||
| 13. | net interest paid (Rs.) (sl. no. 13, col. 4 of block 6C minus sl. no. 8, col. 4 of block 7C) | ||||
| 14. | net income (Rs.) (sl. no. 11 minus sl. no. 12, col. 4 of block 6C minus sl. no. 13, col. 4 of block 6 C ) |
| Block 10: summary block (ratios) [FOR INTERNAL USE] | ||||
|---|---|---|---|---|
| sl. no. |
Items | current accounting period | last accounting period | remarks |
| (1) | (2) | (3) | (4) | (5) |
| 1 | working capital to total output (item 2, block 9/ item 8, block 9) | |||
| 2 | total output to total input (item 8, block 9/ item 5, block 9) | |||
| 3 | wage/salary per person directly associated with the production of service (Rs.) (col. 5, item 1+2, block 5/ col. 4 , item $1+2$, block 5) | |||
| 4 | wage/salary per supervisor (Rs.) (col. 5, item 3+4, block 5/ col. 4 , item $3+4$, block 5) |
Block 11: Particulars of use of Information and Communication technology (ICT) by the enterprise (during the accounting period)
| sl. no. | main items | item code | (yes-1, no-2) |
|---|---|---|---|
| (1) | (2) | (3) | (4) |
| 1. | did the enterprise had a web presence? | 90051 | |
| 2. | did the enterprise had an intranet? | 90052 | |
| for which of the following activities did the enterprise use the Internet for entrepreneurial purpose? | |||
| 3. | sending and receiving e-mail | 90053 | |
| 4. | telephoning over the Internet/VoIP, including video | 90054 | |
| 5. | conferencing | 90055 | |
| 6. | interacting /getting information with general government | 90057 | |
| 7. | organizations | 90058 | |
| 8. | receiving order online and/or delivering services online | 90059 | |
| 9. | internal or external recruitment | 90061 | |
| 10. | staff training | 90062 |
| Block 12: Particulars of field operations | ||||||||||||||
|---|---|---|---|---|---|---|---|---|---|---|---|---|---|---|
| sl. no. | Items | Survey Supervisor (SS) / Senior Statistical Officer (SSO) |
Inspecting / Higher Authority | |||||||||||
| (1) | (2) | (3) | (4) | |||||||||||
| 1 | (i) Name (block letters) | |||||||||||||
| (ii) Code | ||||||||||||||
| Date(s) of | D | D | M | M | Y | Y | D | D | M | M | Y | Y | ||
| 2 | (i) Survey / inspection | |||||||||||||
| 3 | (ii) Receipt | |||||||||||||
| 4 | (iii) Scrutiny | |||||||||||||
| 5 | (iv) Dispatch | |||||||||||||
| 6 | Number of investigators (FI/ISO) in the team | |||||||||||||
| 7 | Signature |
Block 13: Remarks by Survey Supervisor (SS) / Senior Statistical Officer (SSO)
Block 14: Comments by inspecting / higher authority

आटत लटकाट
Government of India
आखियिकी और कार्यक्रम कायल्वियन
जंज़ालय
Ministry of Statistics and Programme
Implementation
टाप्ट्रीय आंख्येकी कायल्विय
National Statistics Office